ClickHouse engineering is the work between “it runs on a laptop” and “it holds a signed SLO in production”: the schema decisions that cannot be changed later without a rewrite, the settings that move between LTS releases, the topology that decides what a region outage costs, and the review discipline that catches all of it before the first customer query. Most production incidents on ClickHouse trace back to a decision that was never reviewed, not to a bug.
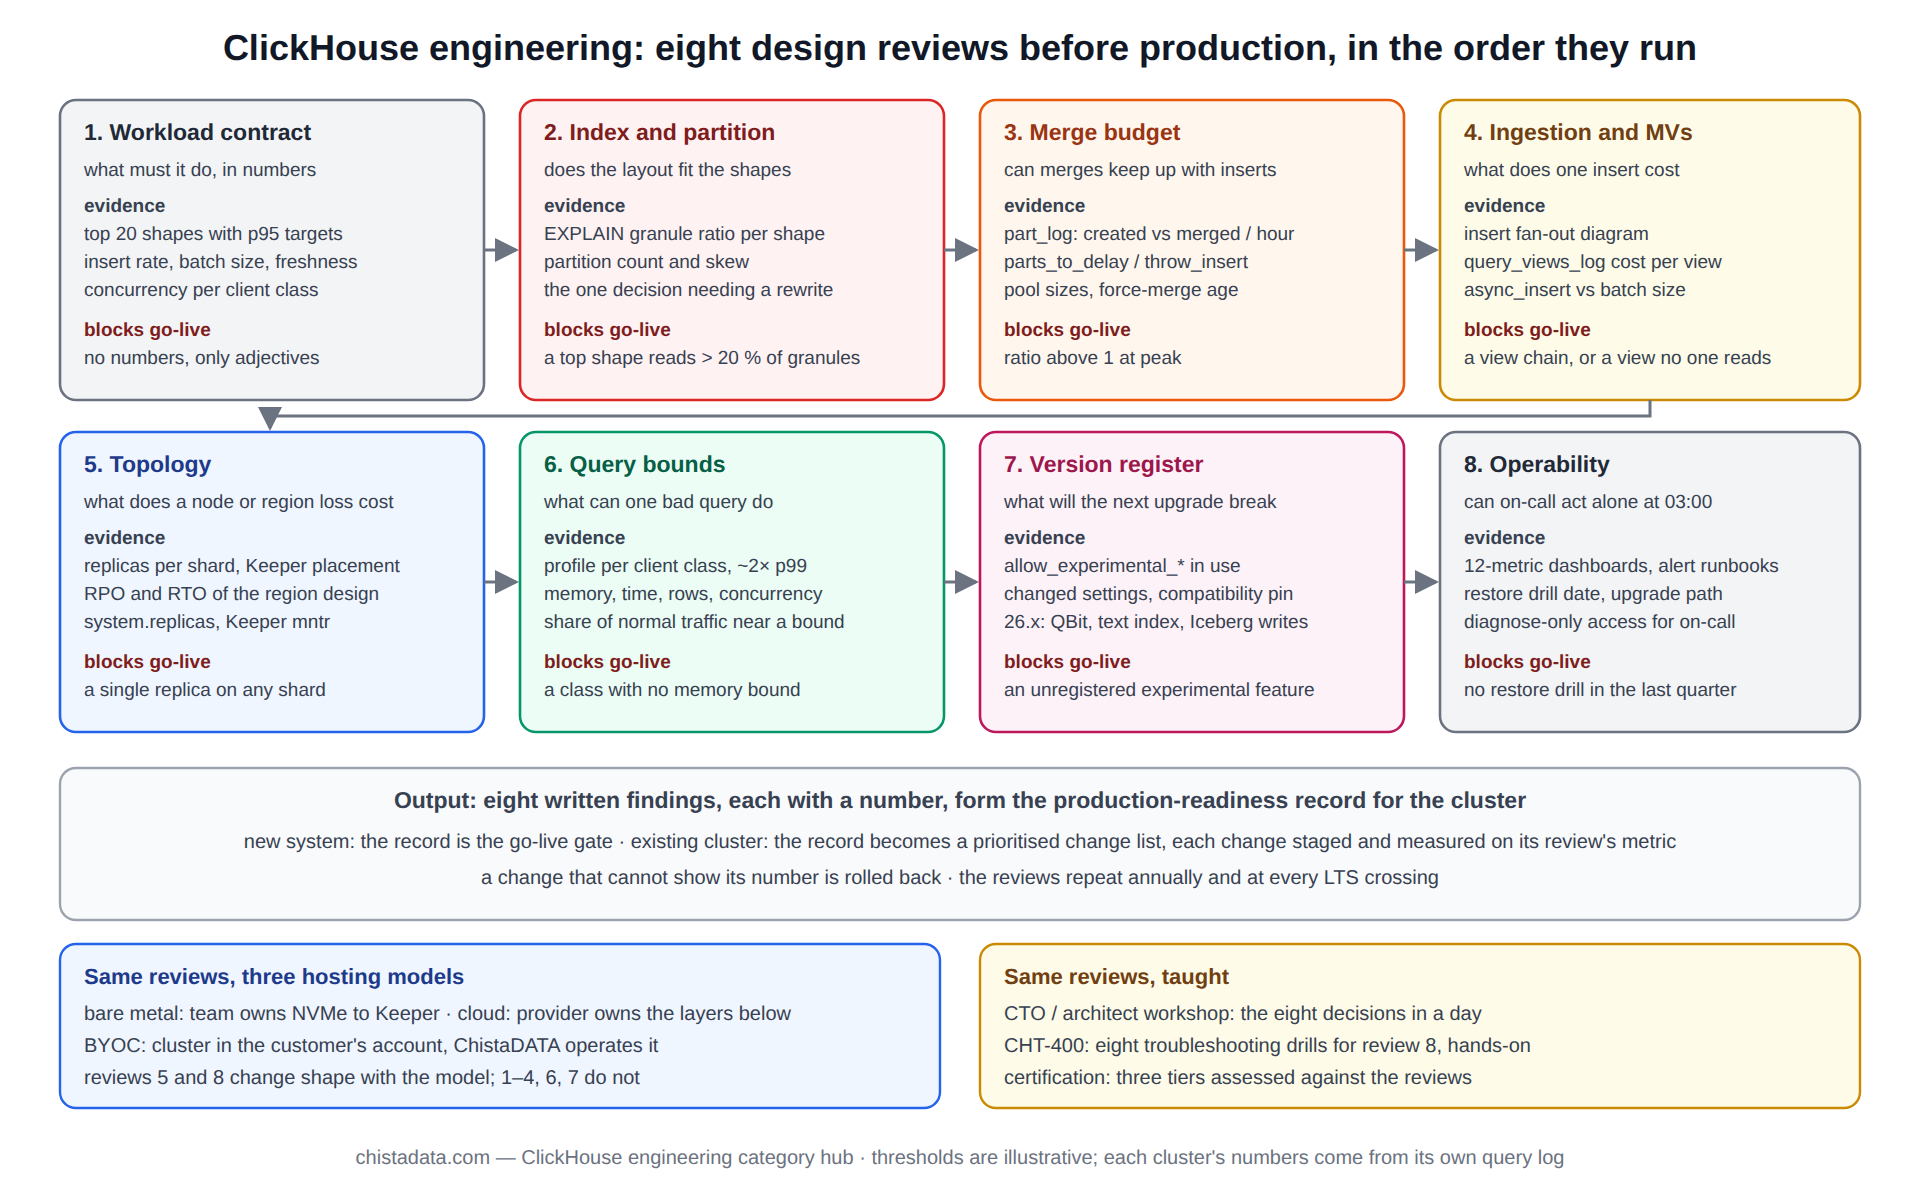
This page sets out the eight design reviews ChistaDATA runs before a ClickHouse system is declared production-ready, in the order they are run, with the question each review answers, the query or check that answers it, and the archive post that goes deeper. It is the engineering standard behind the workshops and certification tracks in this category as well as the customer engagements.
The archive under this category holds the 26.8 LTS settings and feature posts, the primary-index and MergeTree optimisation guides, the multi-region and BYOC architectures, the two “mistakes” posts, the lakehouse SLO design, and the workshop, drills and certification material from ChistaDATA University.
Why ClickHouse engineering is a review discipline, not a checklist
A checklist asks whether something was done; a ClickHouse engineering review asks whether the decision was right for this workload, and records the evidence. The difference matters on ClickHouse because the engine offers few guard rails: a sort key that matches no predicate, a partition expression with a thousand values, a materialised view chain that doubles insert cost, or a default setting that changed at the last LTS all run without error and show up months later as latency or cost.
Each review below ends with a written finding and a number, and the eight findings together form the production-readiness record for the cluster.
The 20 things not to do with ClickHouse and seven performance pitfalls posts are the catalogue of what the reviews are designed to catch.
Review 1: the workload contract every ClickHouse engineering decision refers to
Before any schema is examined, the review establishes what the system is for, in numbers: peak and sustained insert rate, retention, the top twenty query shapes with their p95 targets, expected concurrency per client class, and the freshness the consumers need. Without this, every later review is opinion. The real-time payments analytics post shows a complete workload contract for a payments estate, and the lakehouse with three signed SLOs post shows how the contract becomes an SLO document the customer signs.
-- the workload as the query log already records it (existing cluster) or as the load test produces it (new)
SELECT
    normalized_query_hash                        AS shape,
    count()                                      AS runs_7d,
    quantile(0.95)(query_duration_ms)            AS p95_ms,
    formatReadableSize(avg(read_bytes))          AS avg_read,
    formatReadableSize(max(memory_usage))        AS peak_mem,
    any(user)                                    AS client,
    any(substring(query, 1, 100))                AS sample
FROM system.query_log
WHERE type = 'QueryFinish' AND query_kind = 'Select'
  AND event_time > now() - INTERVAL 7 DAY
GROUP BY shape
ORDER BY runs_7d * p95_ms DESC
LIMIT 20;

-- insert rate and batch size, the two ingestion numbers
SELECT toStartOfHour(event_time) AS h, count() AS inserts, sum(written_rows) AS rows, round(avg(written_rows)) AS rows_per_insert
FROM system.query_log
WHERE type = 'QueryFinish' AND query_kind = 'Insert' AND event_time > now() - INTERVAL 1 DAY
GROUP BY h ORDER BY h;
Review 2: primary index and partition design, the ClickHouse engineering decision that cannot be undone
The sort key and partition expression are the two decisions that require a table rewrite to change, so the review spends its time here. The sort key is checked against the top shapes from review 1: every shape should constrain a prefix of the key, and the key should start with the lowest-cardinality filter that every query uses. The partition expression is checked for count (dozens to a few hundred partitions total, never thousands) and for alignment with retention, since TTL and DROP PARTITION work at partition granularity.
The primary index design: parts, partitions and granules post is the reference for this review, and the MergeTree optimisation post covers the sort-key, partitioning and skip-index trade-offs together.
-- does each top shape use the primary key? granule ratio per shape from EXPLAIN, recorded in the review
EXPLAIN indexes = 1
SELECT count() FROM events WHERE tenant_id = 42 AND ts >= now() - INTERVAL 1 DAY;
-- finding: PrimaryKey Granules 512/61440 (0.8 %) = key fits this shape

-- partition count and skew: the number that predicts merge and TTL behaviour
SELECT table, count(DISTINCT partition) AS partitions, max(rows_per_partition) / avg(rows_per_partition) AS skew
FROM (SELECT table, partition, sum(rows) AS rows_per_partition FROM system.parts WHERE active GROUP BY table, partition)
GROUP BY table ORDER BY partitions DESC;
Review 3: MergeTree settings and the ClickHouse engineering merge budget
Every insert creates a part and every part is merged, so the review sizes the merge workload against the insert pattern and checks the settings that govern it: parts_to_delay_insert and parts_to_throw_insert (defaults moved in 24.x), max_bytes_to_merge_at_max_space_in_pool, background pool sizes, and min_age_to_force_merge_seconds where old partitions should settle to one part. The finding is a merge budget: parts created per hour versus parts merged per hour, with the ratio below one under peak load.
The MergeTree hub covers the engine family and the merge loop; the performance settings in 26.8 LTS post lists the fourteen settings whose defaults or semantics changed in the current LTS.
-- merge budget: created vs merged parts per hour, last day
SELECT
    toStartOfHour(event_time)                                  AS h,
    countIf(event_type = 'NewPart')                            AS parts_created,
    countIf(event_type = 'MergeParts')                         AS merges,
    sumIf(rows, event_type = 'MergeParts')                     AS rows_merged,
    round(avgIf(duration_ms, event_type = 'MergeParts'))       AS avg_merge_ms
FROM system.part_log
WHERE event_time > now() - INTERVAL 1 DAY
GROUP BY h ORDER BY h;

-- settings under review, current values on this server
SELECT name, value, changed
FROM system.merge_tree_settings
WHERE name IN ('parts_to_delay_insert', 'parts_to_throw_insert', 'max_bytes_to_merge_at_max_space_in_pool',
               'min_age_to_force_merge_seconds', 'merge_with_ttl_timeout', 'number_of_free_entries_in_pool_to_execute_mutation');
Review 4: ingestion path and materialised-view chains
The ingestion review in ClickHouse engineering traces every row from producer to every table it lands in, because materialised views multiply insert cost silently: a fact table with five views is six writes per insert, and a view over a view is a chain whose failure stops the whole insert. The finding is a diagram of the insert fan-out with the cost per stage from system.query_views_log, and a decision per view on whether it earns its cost. Batch size and the async-insert configuration are checked against the merge budget from review 3.
The ingestion hub and materialised view hub hold the detail; the real-time analytics on 26.8 post covers the six levers that changed in the current LTS.
-- insert fan-out cost per view, last day (query_views_log must be enabled)
SELECT
    view_name,
    count()                                      AS fired,
    round(avg(view_duration_ms), 1)              AS avg_ms,
    sum(written_rows)                            AS rows_written,
    countIf(status != 'QueryFinish')             AS failures
FROM system.query_views_log
WHERE event_time > now() - INTERVAL 1 DAY
GROUP BY view_name
ORDER BY fired * avg_ms DESC;
Review 5: topology, replication and the region question
The topology review answers three questions with numbers: what is lost if one node fails (nothing, if every shard has two or more replicas and Keeper has quorum), what is lost if a region fails (the RPO and RTO of the cross-region design), and where the Keeper ensemble lives relative to the replicas it coordinates. Multi-region ClickHouse engineering has more wrong answers than right ones, because Keeper quorum across regions trades write latency for availability on every insert; the designing multi-region ClickHouse deployments post sets out the three viable patterns and their RPO.
The replication hub covers the mechanism and its failure modes; the 26.8 LTS performance and HA changes post lists what changed for this review in the current LTS.
-- replica and Keeper health, the two numbers the topology review records
SELECT hostName() AS host, database, table, is_leader, is_readonly, absolute_delay, queue_size, active_replicas, total_replicas
FROM clusterAllReplicas('ch_prod', system.replicas)
WHERE is_readonly OR absolute_delay > 30 OR active_replicas < total_replicas;

SELECT name, value FROM system.zookeeper WHERE path = '/keeper' AND name IN ('api_version');
-- and from Keeper itself: echo mntr | nc ${KEEPER_HOST} 9181 | grep -E 'zk_server_state|zk_avg_latency|zk_outstanding_requests'
Review 6: query bounds, the ClickHouse engineering answer to one bad query
The sixth review assumes a bad query will arrive and bounds what it can do: memory per query and per user, execution time, result rows, concurrent queries per client class, and the overcommit behaviour when the server is under pressure. Profiles are derived from review 1 at roughly twice the observed p99 per class. The finding is a table of client classes with their bounds and the evidence that normal traffic fits inside them; a profile that normal traffic hits is set wrong.
The memory hub covers the seven layers of memory accounting that these bounds act on.
CREATE SETTINGS PROFILE api_profile SETTINGS
    max_memory_usage            = 8000000000,
    max_execution_time          = 15,
    max_result_rows             = 200000,
    max_threads                 = 8,
    max_concurrent_queries_for_user = 60;

CREATE SETTINGS PROFILE etl_profile SETTINGS
    max_memory_usage            = 48000000000,
    max_bytes_before_external_group_by = 24000000000,
    max_execution_time          = 1800,
    max_threads                 = 16;

ALTER USER ${CH_API_USER} SETTINGS PROFILE 'api_profile';
ALTER USER ${CH_ETL_USER} SETTINGS PROFILE 'etl_profile';

-- evidence that normal traffic fits: share of queries within 50 % of each bound, per user
SELECT user, count() AS q, countIf(memory_usage > 4000000000) AS near_mem_bound, countIf(query_duration_ms > 7500) AS near_time_bound
FROM system.query_log WHERE type = 'QueryFinish' AND event_time > now() - INTERVAL 7 DAY
GROUP BY user;
Review 7: the version and feature register
In ClickHouse engineering terms, every experimental feature in use, every compatibility pin, and every setting whose default moved between the running version and the next LTS goes into a register, because the upgrade plan is written from it. ClickHouse 26.x brought QBit vector storage, the renamed text index, and Iceberg writes into production status; each is a line in the register with the migration it implies. The ClickHouse 26.x in production post covers the three, and the release notes hub covers how the register is maintained across LTS crossings.
-- the register, generated
SELECT version() AS running;
SELECT name, value FROM system.settings WHERE name LIKE 'allow_experimental_%' AND value = '1';
SELECT name, value, default FROM system.settings WHERE changed;
SELECT name, value FROM system.merge_tree_settings WHERE changed;
SELECT name, value FROM system.server_settings WHERE changed;
SELECT database, table, engine FROM system.tables WHERE engine LIKE '%Iceberg%' OR engine LIKE '%S3%';
Review 8: operability, the ClickHouse engineering test at 03:00
The last ClickHouse engineering review checks that the system can be operated by someone who did not build it: dashboards on the twelve metrics that matter, alerts with thresholds and runbooks, a tested backup with a restore drill in the last quarter, a documented upgrade path, and access controls that let the on-call engineer diagnose without the ability to drop a table by accident. The eight troubleshooting drills post is the CHT-400 curriculum that on-call engineers are trained against, and the reliability hub covers the SLO loop that keeps operability measured after go-live.
| Review | Question it answers | Evidence recorded | Blocks go-live when |
|---|---|---|---|
| 1. Workload contract | what must the system do, in numbers | top 20 shapes, insert rate, freshness, concurrency | no numbers, only adjectives |
| 2. Index and partition | does the layout fit the shapes | granule ratio per shape; partition count and skew | a top shape reads > 20 % of granules |
| 3. Merge budget | can merges keep up with inserts | parts created vs merged per hour | ratio above 1 at peak |
| 4. Ingestion and MVs | what does one insert cost | fan-out diagram, cost per view | a view chain, or a view with no reader |
| 5. Topology | what does a node or region loss cost | RPO, RTO, Keeper placement | single replica on any shard |
| 6. Bounds | what can one bad query do | profiles per class, fit evidence | a class with no memory bound |
| 7. Version register | what will the next upgrade break | experimental features, changed settings | unregistered experimental feature |
| 8. Operability | can on-call act alone | dashboards, alerts, restore drill date | no restore drill in the last quarter |
Where the platform runs: BYOC, cloud and bare metal
The reviews are the same whichever way the cluster is hosted, but the topology and operability reviews change shape with the hosting model. On bare metal the team owns everything from NVMe to Keeper; on a managed cloud the provider owns the layers below the database; in a BYOC model the cluster runs in the customer’s own account with ChistaDATA operating it, which keeps data residency and network control with the customer while moving operations out. The ClickHouse BYOC with ChistaDATA post sets out the 2026 architecture and which review findings the model changes.
ClickHouse engineering as a taught discipline
The same eight reviews are the spine of the training material in this category. The real-time analytics workshop for CTOs and data architects walks the reviews at decision level in a day; the CHT-400 drills teach the operability review hands-on; and the ClickHouse certification at ChistaDATA University post describes the three tiers that assess an engineer against them. Teams that have been through the reviews once tend to run them unprompted on the next system, which is the intended effect.
Running the reviews on an existing cluster
On a cluster already in production the ClickHouse engineering reviews run in the same order but from the query log rather than from a load test, and the findings become a prioritised change list rather than a go-live gate. The usual outcome is two or three high-value changes (a sort key, a merge setting, a missing memory bound) and a long tail that is recorded and scheduled. Each change is staged, measured against the review’s own metric, and rolled back if the metric does not move; ClickHouse engineering that cannot show its number is not finished.
-- one row per table: the numbers reviews 2 and 3 need, for an existing cluster
SELECT
    table,
    count()                                                              AS active_parts,
    count(DISTINCT partition)                                            AS partitions,
    formatReadableSize(sum(bytes_on_disk))                               AS on_disk,
    round(sum(data_uncompressed_bytes) / sum(data_compressed_bytes), 1)  AS compression,
    max(modification_time)                                               AS last_write
FROM system.parts
WHERE active AND database = currentDatabase()
GROUP BY table
ORDER BY sum(bytes_on_disk) DESC;
Version notes
system.query_views_log is 21.x and later and must be enabled in server config. parts_to_delay_insert and parts_to_throw_insert defaults moved to 1,000 and 3,000 in 24.x. QBit vector storage, the text index and Iceberg writes reached production status in 26.x. The MergeTree settings reference is the source for the merge-budget settings above; confirm each default on the running version before the review is signed.
Reading the archive
Read the two mistakes posts first, since they show what the reviews are for. Then, in review order: the payments and lakehouse posts for the workload contract; primary index design and MergeTree optimisation for the layout; the 26.8 settings post for the merge budget; real-time analytics on 26.8 for ingestion; multi-region deployment and the 26.8 HA changes for topology; ClickHouse 26.x in production for the register; and the troubleshooting drills for operability. The workshop, certification and BYOC posts cover how the discipline is taught and hosted.
ChistaDATA runs the eight reviews as a fixed-scope ClickHouse consulting engagement and repeats them annually for clusters under managed services. Every change a review produces is tested on staging with production-shaped data first, with the rollback written before the change and a tested restore in place.