Every ClickHouse incident we have worked in the ChistaDATA break-fix practice arrives the same way: a symptom, a deadline, and a strong opinion about the cause that turns out to be wrong. That experience is why CHT-400, the ClickHouse Troubleshooting programme at ChistaDATA University, teaches ClickHouse troubleshooting techniques as a method before it teaches any particular fix. This post lays out that method, walks through the eight incidents in the CHT-400 catalogue with the diagnostic queries we actually put in front of learners, and explains how the programme sits inside the wider ChistaDATA University competency ladder for teams that want the whole picture.
A word on what this is. The programme detail, module lists and booking route live on the ChistaDATA University page; this is the working content of one programme, written by the engineers who carry the pager, with the queries we would run on your cluster. Everything below is from lab data or from our own operations; there are no invented customer stories.
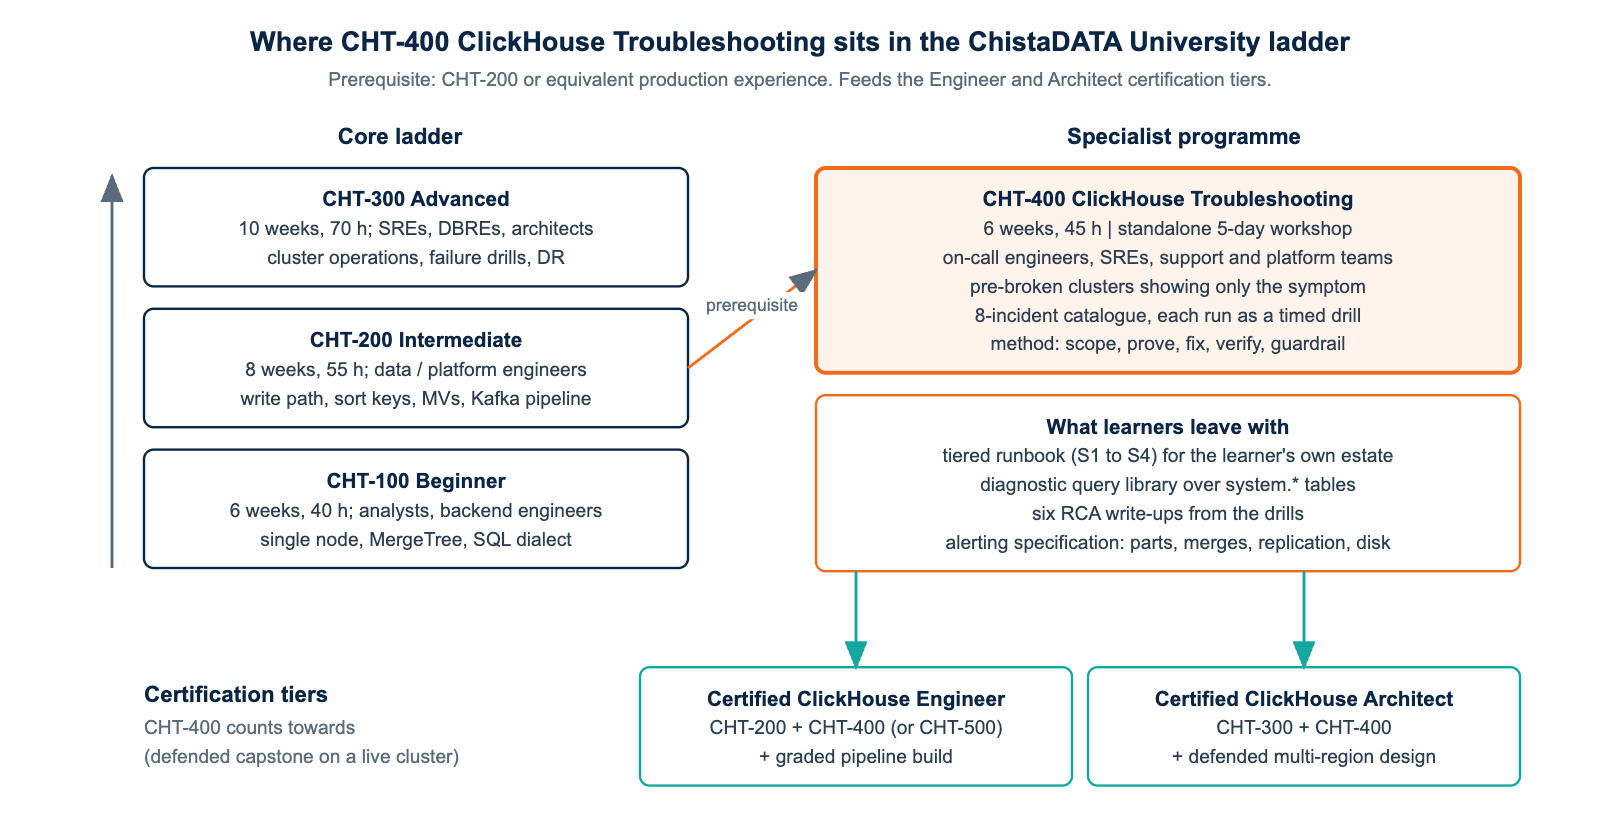
Where CHT-400 sits in the ChistaDATA University ladder
ChistaDATA University is built as a competency ladder rather than a catalogue of unrelated courses. Every learner takes a free 45-minute technical assessment and enters at the level it indicates. The curriculum is versioned against ClickHouse releases, so a cohort in September 2026 works with 26.8 LTS syntax, current table engines and current cluster topologies rather than deprecated patterns. Three core levels form the ladder: CHT-100 Beginner, CHT-200 Intermediate and CHT-300 Advanced. Two specialist programmes sit on top of it: CHT-400 ClickHouse Troubleshooting and CHT-500 Advanced Analytics in ClickHouse. CHT-900, a ten-hour executive track for CTOs and CXOs, runs in parallel so that business sponsorship and technical adoption move together.
CHT-400 is six weeks and forty-five learning hours, for on-call engineers, SREs and support and platform teams. The prerequisite is CHT-200 (CHT-300 is recommended), but it is also delivered standalone as a five-day workshop for teams already operating ClickHouse, in which case the only prerequisites are comfort with ClickHouse SQL and Linux administration. It is the one programme that grew out of a support practice rather than a syllabus, and it shows: learners receive pre-broken clusters that present only symptoms, and have to reach root cause with system tables, logs and profiling. The clusters reset between attempts, so getting it wrong costs only time, and the ClickHouse troubleshooting techniques stick because they were used under pressure.
The method behind the ClickHouse troubleshooting techniques we teach
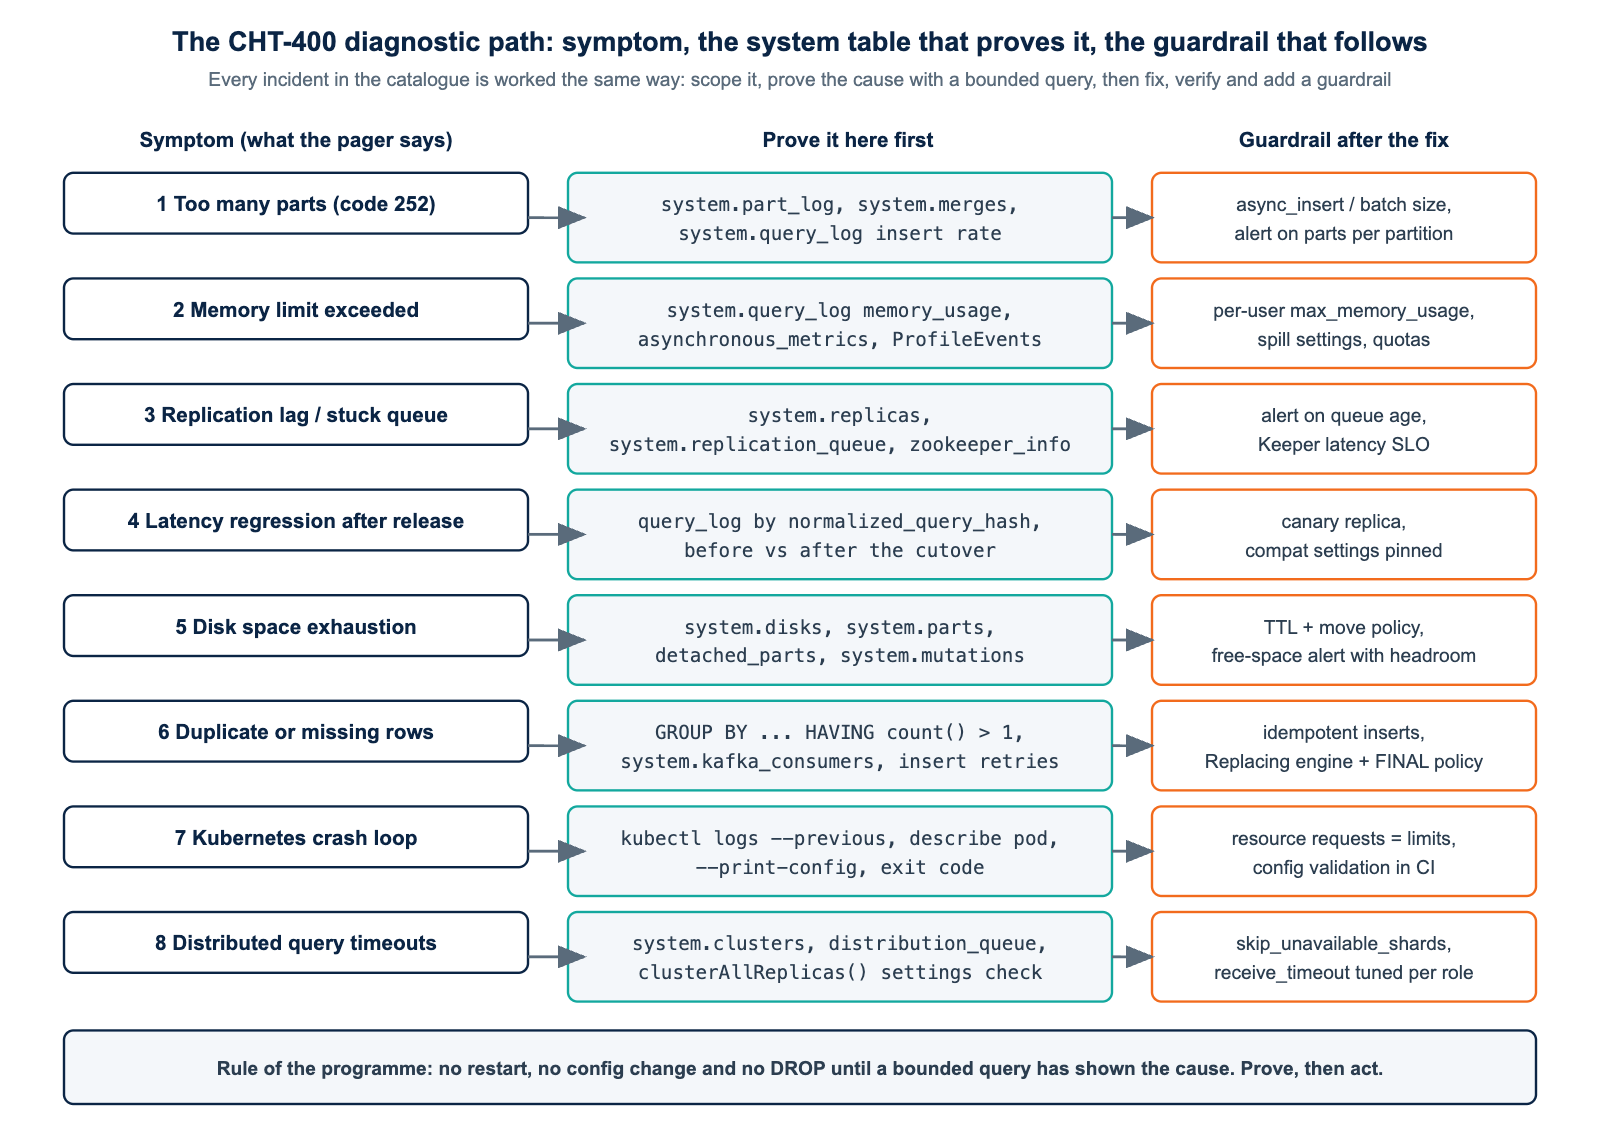
The methodology has three steps, and we are strict about the order because the failure mode of experienced engineers is to skip the first two. First, scope the issue: is it one query, one table, one node or the whole cluster? A query that is slow on every replica is a schema or plan problem; a query that is slow on one replica is a node problem, and the fixes do not overlap.
Second, prove the root cause with a bounded test and, where the CPU is involved, a flame graph, before touching anything. A hypothesis that cannot be reproduced in a bounded test is still a hypothesis. Third, fix, verify with the same measurement that showed the problem, and add a guardrail, whether an alert threshold, a settings profile or a schema constraint, so that the incident does not return.
The reason the method is release-independent is that it is built on ClickHouse’s own introspection surface, which has only grown: system.query_log, system.part_log, system.merges, system.replication_queue, system.replicas, system.errors, system.text_log, system.trace_log and, since 26.1, system.zookeeper_info. A learner who can read those tables can diagnose a release that did not exist when they took the course. The eight incidents below are how the method is practised.
Incident 1: too many parts
DB::Exception: Too many parts (300), error code 252, is the first incident in the catalogue because it is the most common and the most misdiagnosed. The reflex is to raise parts_to_throw_insert. That treats the alarm as the fire. The cause is almost always an insert pattern producing parts faster than merges can consolidate them, and the first hour of ClickHouse troubleshooting techniques is about proving which producer is doing it.
-- CHT-400 ClickHouse troubleshooting techniques, drill 1: too many parts
-- Who is creating parts, how many, and how small?
SELECT
    table,
    count()                                        AS new_parts_last_hour,
    round(avg(rows))                               AS avg_rows_per_part,
    formatReadableSize(avg(size_in_bytes))         AS avg_part_size
FROM system.part_log
WHERE event_type = 'NewPart'
  AND event_time >= now() - INTERVAL 1 HOUR
GROUP BY table
ORDER BY new_parts_last_hour DESC
LIMIT 10;

-- Which client is behind the small inserts? This is usually the whole answer.
SELECT
    user,
    client_name,
    count()                                        AS inserts,
    round(avg(written_rows))                       AS avg_rows,
    any(Settings['async_insert'])                  AS async_insert
FROM system.query_log
WHERE type = 'QueryFinish'
  AND query_kind = 'Insert'
  AND event_time >= now() - INTERVAL 1 HOUR
GROUP BY user, client_name
ORDER BY inserts DESC;

-- Are merges starved, or simply behind?
SELECT table, count() AS active_merges, max(elapsed) AS longest_merge_s
FROM system.merges
GROUP BY table;
The fix depends on what the second query shows. A chatty application gets async_insert with wait_for_async_insert = 1 in its settings profile (on by default since 26.3 LTS, but worth pinning explicitly) or batching at the producer. A Kafka table engine with too many consumers gets fewer consumers or a larger kafka_max_block_size. A partition key that is too fine gets a schema conversation. The guardrail is an alert on system.parts active part count per partition well below the throw threshold, so the next time you see it coming rather than arriving.
Incident 2: memory limit exceeded
Memory incidents come in two kinds that need different treatment: a single query exceeding max_memory_usage, and the server itself approaching max_server_memory_usage and being killed by the OS. The scoping question is which one you have, and system.query_log answers it in one pass.
-- CHT-400 ClickHouse troubleshooting techniques, drill 2: memory limit exceeded
-- Which query shapes are the memory hogs, and is it aggregation, join or sort?
SELECT
    normalized_query_hash,
    count()                                             AS runs,
    formatReadableSize(max(memory_usage))               AS peak,
    formatReadableSize(quantile(0.5)(memory_usage))     AS p50,
    sum(ProfileEvents['ExternalAggregationWritePart'])  AS agg_spills,
    sum(ProfileEvents['ExternalJoinWritePart'])         AS join_spills,
    sum(ProfileEvents['ExternalSortWritePart'])         AS sort_spills,
    any(left(query, 120))                               AS sample
FROM system.query_log
WHERE type IN ('QueryFinish', 'ExceptionWhileProcessing')
  AND event_time >= now() - INTERVAL 6 HOUR
GROUP BY normalized_query_hash
ORDER BY max(memory_usage) DESC
LIMIT 10;

-- Server-level: what is holding memory that is not a query?
SELECT metric, formatReadableSize(value) AS size
FROM system.asynchronous_metrics
WHERE metric IN ('MemoryResident', 'MemoryTracking', 'jemalloc.resident',
                 'UncompressedCacheBytes', 'MarkCacheBytes', 'PrimaryKeyCacheBytes')
ORDER BY metric;
A single-query hog with zero spills means the query runs entirely in memory and the fix is max_bytes_before_external_group_by or max_bytes_before_external_sort on that profile, or a schema change if the GROUP BY key cardinality is the problem.
Since 26.8 LTS, hash joins spill to disk automatically at 50 percent of the memory limit, which turns a kill into a slowdown; learners are taught to notice that a join that used to fit and now spills will present as a latency regression rather than a memory one. Server-level pressure with modest query peaks points at caches, dictionaries or a mark cache sized for a table count that has since tripled. The guardrail is max_memory_usage_for_user per profile, so one analyst cannot take the serving replicas down. Of all the ClickHouse troubleshooting techniques in the catalogue, this is the one learners most wish they had known earlier.
Incident 3: replication lag and stuck queues
Replication in ClickHouse is a per-table log of entries in Keeper that every replica replays, so a stuck queue is always a specific entry failing for a specific reason, and system.replication_queue will tell you which and why if you ask it correctly.
-- CHT-400 ClickHouse troubleshooting techniques, drill 3: replication lag
-- Where is the lag, and how deep?
SELECT database, table, absolute_delay, queue_size, inserts_in_queue, merges_in_queue, is_readonly
FROM system.replicas
WHERE absolute_delay > 60 OR queue_size > 100 OR is_readonly
ORDER BY absolute_delay DESC;

-- The entry that is actually stuck, and the reason ClickHouse gives
SELECT
    table,
    type,
    num_tries,
    create_time,
    postpone_reason,
    last_exception
FROM system.replication_queue
WHERE num_tries > 3 OR postpone_reason != ''
ORDER BY num_tries DESC
LIMIT 20;

-- Is Keeper itself healthy? (26.1+)
SELECT * FROM system.zookeeper_info FORMAT Vertical;
last_exception is the single most under-read column in ClickHouse. A missing part on every source replica, a checksum mismatch, a Keeper session that keeps expiring: each has a different remedy, and none of them is “restart the server”, which is what most teams do first. The lab clusters for this incident are broken in three different ways that look identical from absolute_delay, and the assessment is whether the learner reaches for system.replication_queue before reaching for systemctl. Repair follows the documented ladder: SYSTEM SYNC REPLICA, then SYSTEM RESTORE REPLICA, and only as a gated last resort a full re-clone.
Incident 4: query latency regression after a release
An upgrade lands, and on Monday a dashboard that took 400 ms takes 4 seconds. Nothing else changed, so the release is blamed, and sometimes correctly. The ClickHouse troubleshooting techniques here are about comparing the same query shape across the boundary rather than arguing from memory. The pairing of normalized_query_hash with the ProfileEvents map is what makes the comparison honest: rows read, marks selected and the join or aggregation algorithm actually used are all in the log.
-- CHT-400 ClickHouse troubleshooting techniques, drill 4: latency regression after a release
-- Same query shapes, before and after the release boundary
WITH toDateTime('2026-09-01 02:00:00') AS cutover
SELECT
    normalized_query_hash,
    countIf(event_time < cutover)                                        AS runs_before,
    countIf(event_time >= cutover)                                       AS runs_after,
    quantileIf(0.95)(query_duration_ms, event_time <  cutover)           AS p95_before_ms,
    quantileIf(0.95)(query_duration_ms, event_time >= cutover)           AS p95_after_ms,
    avgIf(read_rows, event_time <  cutover)                              AS rows_before,
    avgIf(read_rows, event_time >= cutover)                              AS rows_after,
    anyIf(Settings['join_algorithm'], event_time >= cutover)             AS join_algo_after,
    any(left(query, 100))                                                AS sample
FROM system.query_log
WHERE type = 'QueryFinish'
  AND event_time >= cutover - INTERVAL 7 DAY
  AND query_kind = 'Select'
GROUP BY normalized_query_hash
HAVING runs_before > 20 AND runs_after > 20 AND p95_after_ms > 2 * p95_before_ms
ORDER BY p95_after_ms - p95_before_ms DESC
LIMIT 20;

-- Which settings changed defaults across the boundary? Compare against the pre-upgrade capture.
SELECT name, value, default, changed
FROM system.settings
WHERE name IN ('max_insert_threads', 'join_algorithm', 'use_query_condition_cache',
               'enable_adaptive_aggregator', 'enable_group_by_top_k_optimization');
If rows_after is higher than rows_before for the same hash, an index or projection stopped being used and EXPLAIN indexes = 1 on the current version will show where. If rows are the same and duration is not, look at the algorithm columns and the changed defaults; the 26.x line changed several, and the lesson is that a settings-diff capture belongs in every upgrade runbook so that this query has something to compare against.
Incident 5: disk space exhaustion
Disk incidents look simple and hide two traps. The first is that merges need free space equal to the parts being merged, so a disk at 90 percent can stop merging long before it is full and turn into a too-many-parts incident. The second is that the space is often not where you think: detached parts, a backup left in shadow/, a system log table that nobody set a TTL on. The ClickHouse troubleshooting techniques for disk are about accounting for the space from ClickHouse’s point of view before touching the filesystem.
-- CHT-400 ClickHouse troubleshooting techniques, drill 5: disk space exhaustion
-- Disk view: how much room do merges actually have?
SELECT name, path, formatReadableSize(free_space) AS free, formatReadableSize(total_space) AS total,
       round(100 * free_space / total_space, 1) AS free_pct
FROM system.disks;

-- Largest tables and their active/inactive split (inactive parts are awaiting removal)
SELECT
    database, table,
    formatReadableSize(sumIf(bytes_on_disk, active))       AS active_bytes,
    formatReadableSize(sumIf(bytes_on_disk, NOT active))   AS inactive_bytes,
    countIf(NOT active)                                    AS inactive_parts
FROM system.parts
GROUP BY database, table
ORDER BY sumIf(bytes_on_disk, active) DESC
LIMIT 10;

-- System log tables without a TTL are the usual silent consumer
SELECT database, table, formatReadableSize(sum(bytes_on_disk)) AS size
FROM system.parts
WHERE database = 'system' AND active
GROUP BY database, table
ORDER BY sum(bytes_on_disk) DESC;

-- Detached parts nobody remembered
SELECT database, table, reason, count(), formatReadableSize(sum(bytes_on_disk)) AS size
FROM system.detached_parts
GROUP BY database, table, reason;
The guardrail is twofold: a TTL on every system.*_log table, and an alert on free_space against the largest active part size rather than a flat percentage, because the number that matters is whether the next merge fits. Nothing in this incident’s fix list deletes data without a confirmation gate; learners who reach for rm in the lab are asked to explain what they just removed.
Incident 6: duplicate or missing rows
Correctness incidents are the ones that reach the CTO, and they are almost always ingestion incidents wearing a query costume. Duplicates come from producer retries without idempotency, from a ReplacingMergeTree read without FINAL or before the merge, or from a materialised view that was rebuilt while inserts continued. Missing rows come from a Kafka consumer that committed offsets past an error, from kafka_handle_error_mode left at the default, or from a dedup window that swallowed a legitimate repeat. The technique is to establish which of these you have before rewriting anything.
-- CHT-400 ClickHouse troubleshooting techniques, drill 6: duplicate or missing rows
-- Are these duplicates identical rows (retry) or distinct rows with the same key (upsert)?
SELECT
    tenant_id, user_id, event_time,
    count()                         AS copies,
    uniqExact(event_name)           AS distinct_names
FROM lab.events_local
WHERE event_date = today()
GROUP BY tenant_id, user_id, event_time
HAVING copies > 1
ORDER BY copies DESC
LIMIT 20;

-- Did the same insert block arrive more than once? Dedup should have caught identical blocks.
SELECT
    query_id,
    count()                                     AS attempts,
    any(Settings['insert_deduplicate'])         AS insert_deduplicate,
    any(Settings['insert_deduplication_token']) AS token
FROM system.query_log
WHERE query_kind = 'Insert'
  AND event_date = today()
  AND type IN ('QueryFinish', 'ExceptionWhileProcessing')
GROUP BY query_id
HAVING attempts > 1
LIMIT 20;

-- Kafka side: consumer errors that would have dropped rows
SELECT database, table, consumer_id, num_messages_read, last_exception, last_exception_time
FROM system.kafka_consumers
WHERE last_exception != ''
ORDER BY last_exception_time DESC;
The lesson learners take from this lab is that the query that detects duplicates is not the fix. The fix is an insert_deduplication_token per producer batch, a dead-letter stream for Kafka errors, and since 26.8 LTS an atomic POPULATE for materialised views that removes the rebuild race entirely. A guardrail is a nightly reconciliation count against the source of truth, alerting on drift.
Incident 7: Kubernetes crash loop
On Kubernetes the symptom is a pod in CrashLoopBackOff and the temptation is to read the last twenty lines of the current log. The current log is empty because the server never started; the previous container’s log is where the exception is. The ClickHouse troubleshooting techniques for this incident are mostly about knowing where a server that cannot start leaves its evidence.
# CHT-400 ClickHouse troubleshooting techniques, drill 7: Kubernetes crash loop
# The exception is in the previous container, not the current one
kubectl -n clickhouse logs chi-prod-cluster-0-0-0 -c clickhouse --previous | tail -n 80

# Was it OOMKilled, a probe, or the server exiting on its own?
kubectl -n clickhouse describe pod chi-prod-cluster-0-0-0 | grep -A8 -E 'Last State|Reason|Exit Code'

# Validate the merged configuration the pod would load, without starting the server
kubectl -n clickhouse exec chi-prod-cluster-0-0-0 -c clickhouse -- \
  clickhouse-server --config-file=/etc/clickhouse-server/config.xml --print-config 2>&1 | head -n 40

# Recurring exit codes tell you the class: 137 is the kernel (memory limit),
# 70/232 range is ClickHouse refusing to start (bad config, incompatible metadata)
kubectl -n clickhouse get pod chi-prod-cluster-0-0-0 \
  -o jsonpath='{.status.containerStatuses[0].lastState.terminated.exitCode}{"\n"}'
Exit code 137 means the container memory limit is below what max_server_memory_usage_to_ram_ratio lets ClickHouse believe it has, and the fix is to align the two rather than to raise the limit blindly. A ClickHouse-side exit with a metadata error usually means a table whose DDL the new version refuses to load, which is why the upgrade runbook in CHT-300 includes a DDL replay on staging. A readiness probe that kills a server still replaying a large replication queue is the third common cause; the lab includes it because it is the one teams least expect.
Incident 8: distributed query timeouts
A query across a Distributed table times out and the initiator’s error message names a shard, which is rarely the shard at fault. The ClickHouse troubleshooting techniques here separate the three places a distributed query can stall: connection to a remote shard, the remote shard’s own execution, and the merge of results on the initiator.
-- CHT-400 ClickHouse troubleshooting techniques, drill 8: distributed query timeouts
-- Cluster health as the initiator sees it: error counts and estimated recovery per replica
SELECT cluster, shard_num, replica_num, host_name, errors_count, estimated_recovery_time, slowdowns_count
FROM system.clusters
WHERE cluster = 'analytics_cluster'
ORDER BY errors_count DESC;

-- Pending distributed inserts that will contend with reads
SELECT database, table, is_blocked, error_count, data_files, formatReadableSize(data_compressed_bytes) AS pending, last_exception
FROM system.distribution_queue
WHERE data_files > 0;

-- The same query on every shard directly: which one is actually slow?
SELECT hostName() AS host, count(), max(query_duration_ms) AS worst_ms
FROM clusterAllReplicas('analytics_cluster', system.query_log)
WHERE type = 'QueryFinish'
  AND event_time >= now() - INTERVAL 30 MINUTE
  AND log_comment = 'panel:top_events'
GROUP BY host
ORDER BY worst_ms DESC;

-- Timeouts that are actually set, rather than assumed
SELECT name, value FROM system.settings
WHERE name IN ('receive_timeout', 'send_timeout', 'connect_timeout_with_failover_ms',
               'skip_unavailable_shards', 'max_replica_delay_for_distributed_queries');
Once the slow shard is identified, the incident becomes one of the previous seven on that node: a merge backlog, a memory spill, a replica that is lagging and being read anyway because max_replica_delay_for_distributed_queries is too generous. That is deliberate. The point of ending the catalogue here is that distributed problems decompose into local ones, and the method that solves the local ones solves these too.
What learners leave CHT-400 with
Four deliverables are graded. A tiered incident runbook with severity classification and escalation paths, written for the learner’s own team. A reusable diagnostic query library saved as views, essentially the ClickHouse troubleshooting techniques in this post adapted to their schemas. Root-cause write-ups for six simulated incidents, each following the scope-prove-fix structure. And a preventive alerting specification with thresholds the learner can justify from the system tables rather than from a vendor default. Enterprise customers use CHT-400 completion as their on-call readiness sign-off, and it counts towards the Certified ClickHouse Engineer tier (with CHT-200 and a graded pipeline build) and is required for Certified ClickHouse Architect (with CHT-300 and a defended multi-region design).
The rest of the ladder, briefly
CHT-100 Beginner is six weeks and forty hours: columnar storage, MergeTree essentials, the SQL dialect, reading a query plan, a single-node deployment and a capstone dashboard over a hundred-million-row dataset. CHT-200 Intermediate is eight weeks and fifty-five hours on the write path: sorting and partition keys, skip indexes, materialised views, streaming ingestion, dictionaries, joins, codecs and mutations, with a Kafka-to-replicated-table pipeline as the graded build.
CHT-300 Advanced is ten weeks and seventy hours of internals and distributed systems: learners provision a three-shard, two-replica cluster with a Keeper ensemble and run failure drills, including Keeper quorum loss, replica divergence, merge starvation, a rolling upgrade and cross-region failover with measured RPO. CHT-500 Advanced Analytics is eight weeks and sixty hours on aggregate combinators, funnels, cohorts, retention, time series and approximate algorithms, replacing external pipelines with single queries. CHT-900 is the ten-hour executive briefing on architecture fit, TCO, migration risk, hiring and governance. Architecture is not a module in any of them; it is the spine that runs through all five at increasing depth.
A competency matrix tracks nine skills across the programmes at Intro, Applied, Core or Mastery depth; incident diagnosis and recovery is Core in CHT-400 and Applied in CHT-300, and sharding, replication and Keeper reach Mastery only in CHT-400, because you understand replication properly once you have repaired it. Three certification tiers sit on the matrix, each defended on a live multi-node cluster rather than answered on paper.
Delivery, labs, corporate and academic options
Every programme, CHT-400 included, is delivered in four ways: instructor-led virtual cohorts with two live sessions a week and a shared cluster, on-site workshops of three to five days on the customer’s own schemas, self-paced modules with auto-graded labs, and embedded mentorship where a principal engineer joins a team’s sprint ceremonies. The lab environment is a dedicated three-shard, two-replica cluster with a three-node Keeper ensemble, multi-billion-row datasets, and a companion stack of Kafka or Redpanda, Grafana, Prometheus, MinIO and Kubernetes with the ClickHouse operator. For CHT-400 specifically, the pre-broken sandboxes reset between attempts, labs run on the current stable line and one previous LTS, and access is retained for 30 days after the programme.
Corporate engagements swap the sample incidents for the customer’s own incident history under NDA, which turns the troubleshooting labs into a retrospective on the customer’s actual outages, and set the customer’s latency targets as lab pass criteria. Contracting is cohort licensing with volume tiers, multi-year agreements, purchase-order-friendly paperwork, pre- and post-assessment scores per competency, and annual delta workshops for each release line. On the academic side, the CHT-100 and CHT-200 material is packaged as a fourteen-week semester module, CHT-300 as a graduate seminar, with thesis sponsorship, faculty enablement and a discounted student certification pathway; departments can request syllabus mapping to their accreditation requirements.
Engagement process
Six stages, the first two free: a discovery call on workload, team size and current pain; a per-engineer skills assessment; syllabus and SOW fixing modules, schedule, pass criteria and pricing; delivery on a dedicated cluster with weekly reviews; certification by proctored exam and live-cluster capstone defence; and aftercare of 30 days of lab access, an annual refresh and optional 24×7 support. Public cohorts start monthly; a customised corporate CHT-400 typically starts two to three weeks after syllabus sign-off, which is the time it takes to rebuild the broken clusters around your schemas.
ClickHouse troubleshooting techniques FAQ
Can we take CHT-400 without the rest of the ladder? Yes. It is regularly run as a standalone five-day workshop for on-call teams already operating ClickHouse. You need comfort with ClickHouse SQL and Linux administration; the ClickHouse troubleshooting techniques are taught from first principles.
Which release do the labs run on? The current stable line and one previous LTS, so at the time of writing 26.8 LTS and 26.3 LTS, which also lets a cohort rehearse an upgrade and then troubleshoot what it broke.
Are the incidents realistic or textbook? The catalogue is drawn from our break-fix practice. In corporate cohorts we go further and rebuild the sandboxes around your own incident history under NDA.
Do these ClickHouse troubleshooting techniques help on ClickHouse Cloud? The method and most of the queries carry over. Incidents that depend on Keeper, merges and disks behave differently on SharedMergeTree and are out of your hands there; the query-side incidents, memory, latency regression, duplicates and distributed timeouts, are the same.
Which programme should our team start with? Take the free assessment. Teams already running multi-node production clusters usually go straight to CHT-400.
Where we land
Troubleshooting is the one ClickHouse skill that cannot be learned from documentation alone, because documentation describes the system working. CHT-400 exists to give engineers the experience of the system failing, in a place where failure is free, with the discipline of proving the cause before changing anything. If your team carries a ClickHouse pager, the ClickHouse troubleshooting techniques in CHT-400 are where we would start, and the assessment that places you costs nothing.
The usual caveat applies with more than usual force to a post about troubleshooting: the queries here read system tables and change nothing, but every remedy described alongside them changes behaviour under load. Test on staging with your own workload before production, keep a verified backup and a rehearsed restore, and treat your DR site as part of the estate you are diagnosing. If you would rather have us look at an incident with you, that is what the ChistaDATA 24×7 support team does.
Sources: ChistaDATA University programme page, system.replication_queue, system.query_log, system.part_log, system.clusters, ClickHouse changelog.
Running ClickHouse in production? ChistaDATA provides ClickHouse consulting for architecture, performance and migrations, and 24×7 ClickHouse support with a 15-minute S1 response. For day-to-day operations see ClickHouse DBA services and ClickHouse managed services.
