ChistaDATA · ClickHouse Performance Tuning · Schema first, settings last
ClickHouse Performance Tuning and Optimization: Five Levers, Worked in Order, Measured at Every Step
ClickHouse performance tuning at ChistaDATA is not a list of settings. It is an order of operations. The sort key and partition decide how many granules a query must read; the query shape decides how much work is done per granule; MergeTree settings decide write amplification; server settings decide concurrency and memory headroom; hardware sets the ceiling. We work those five levers from the top down, re-measure from system.query_log after each one, and never touch a setting to compensate for a schema mistake.
This page documents the method in enough detail for your own engineers to apply it, including the DDL, the queries and the settings we actually use. Where we tune your cluster ourselves, every change is filed with its scope, current and proposed value, unit, reload-or-restart class and the verification query.
ORDER OF OPERATIONS
How we sequence ClickHouse performance tuning
- Schema: ORDER BY, PARTITION BY, types, codecs, granularity
- Query shape: PREWHERE, JOIN algorithm, pre-aggregation, LIMIT BY
- MergeTree settings: parts, merges, async inserts, TTL timing
- Server and profile settings: threads, memory, caches, concurrency
- Hardware and OS: NVMe, RAM, THP, scheduler, NUMA, network
On this page
ClickHouse performance tuning, lever by lever
Each lever below has its own section with the evidence we collect, the change we make, and the query that proves the change worked. The order is deliberate: a lever lower in the list rarely fixes a problem created by a lever above it.
Method
Why ClickHouse performance tuning has an order
ClickHouse reads data in granules of index_granularity rows, selected by the sparse primary index and pruned by partition and skip indexes. Everything a query does afterwards, from decompression to aggregation to network transfer, is proportional to the granules it selected. That is why schema is lever one: a sort key that matches the workload’s predicates removes more work than any setting can add back.
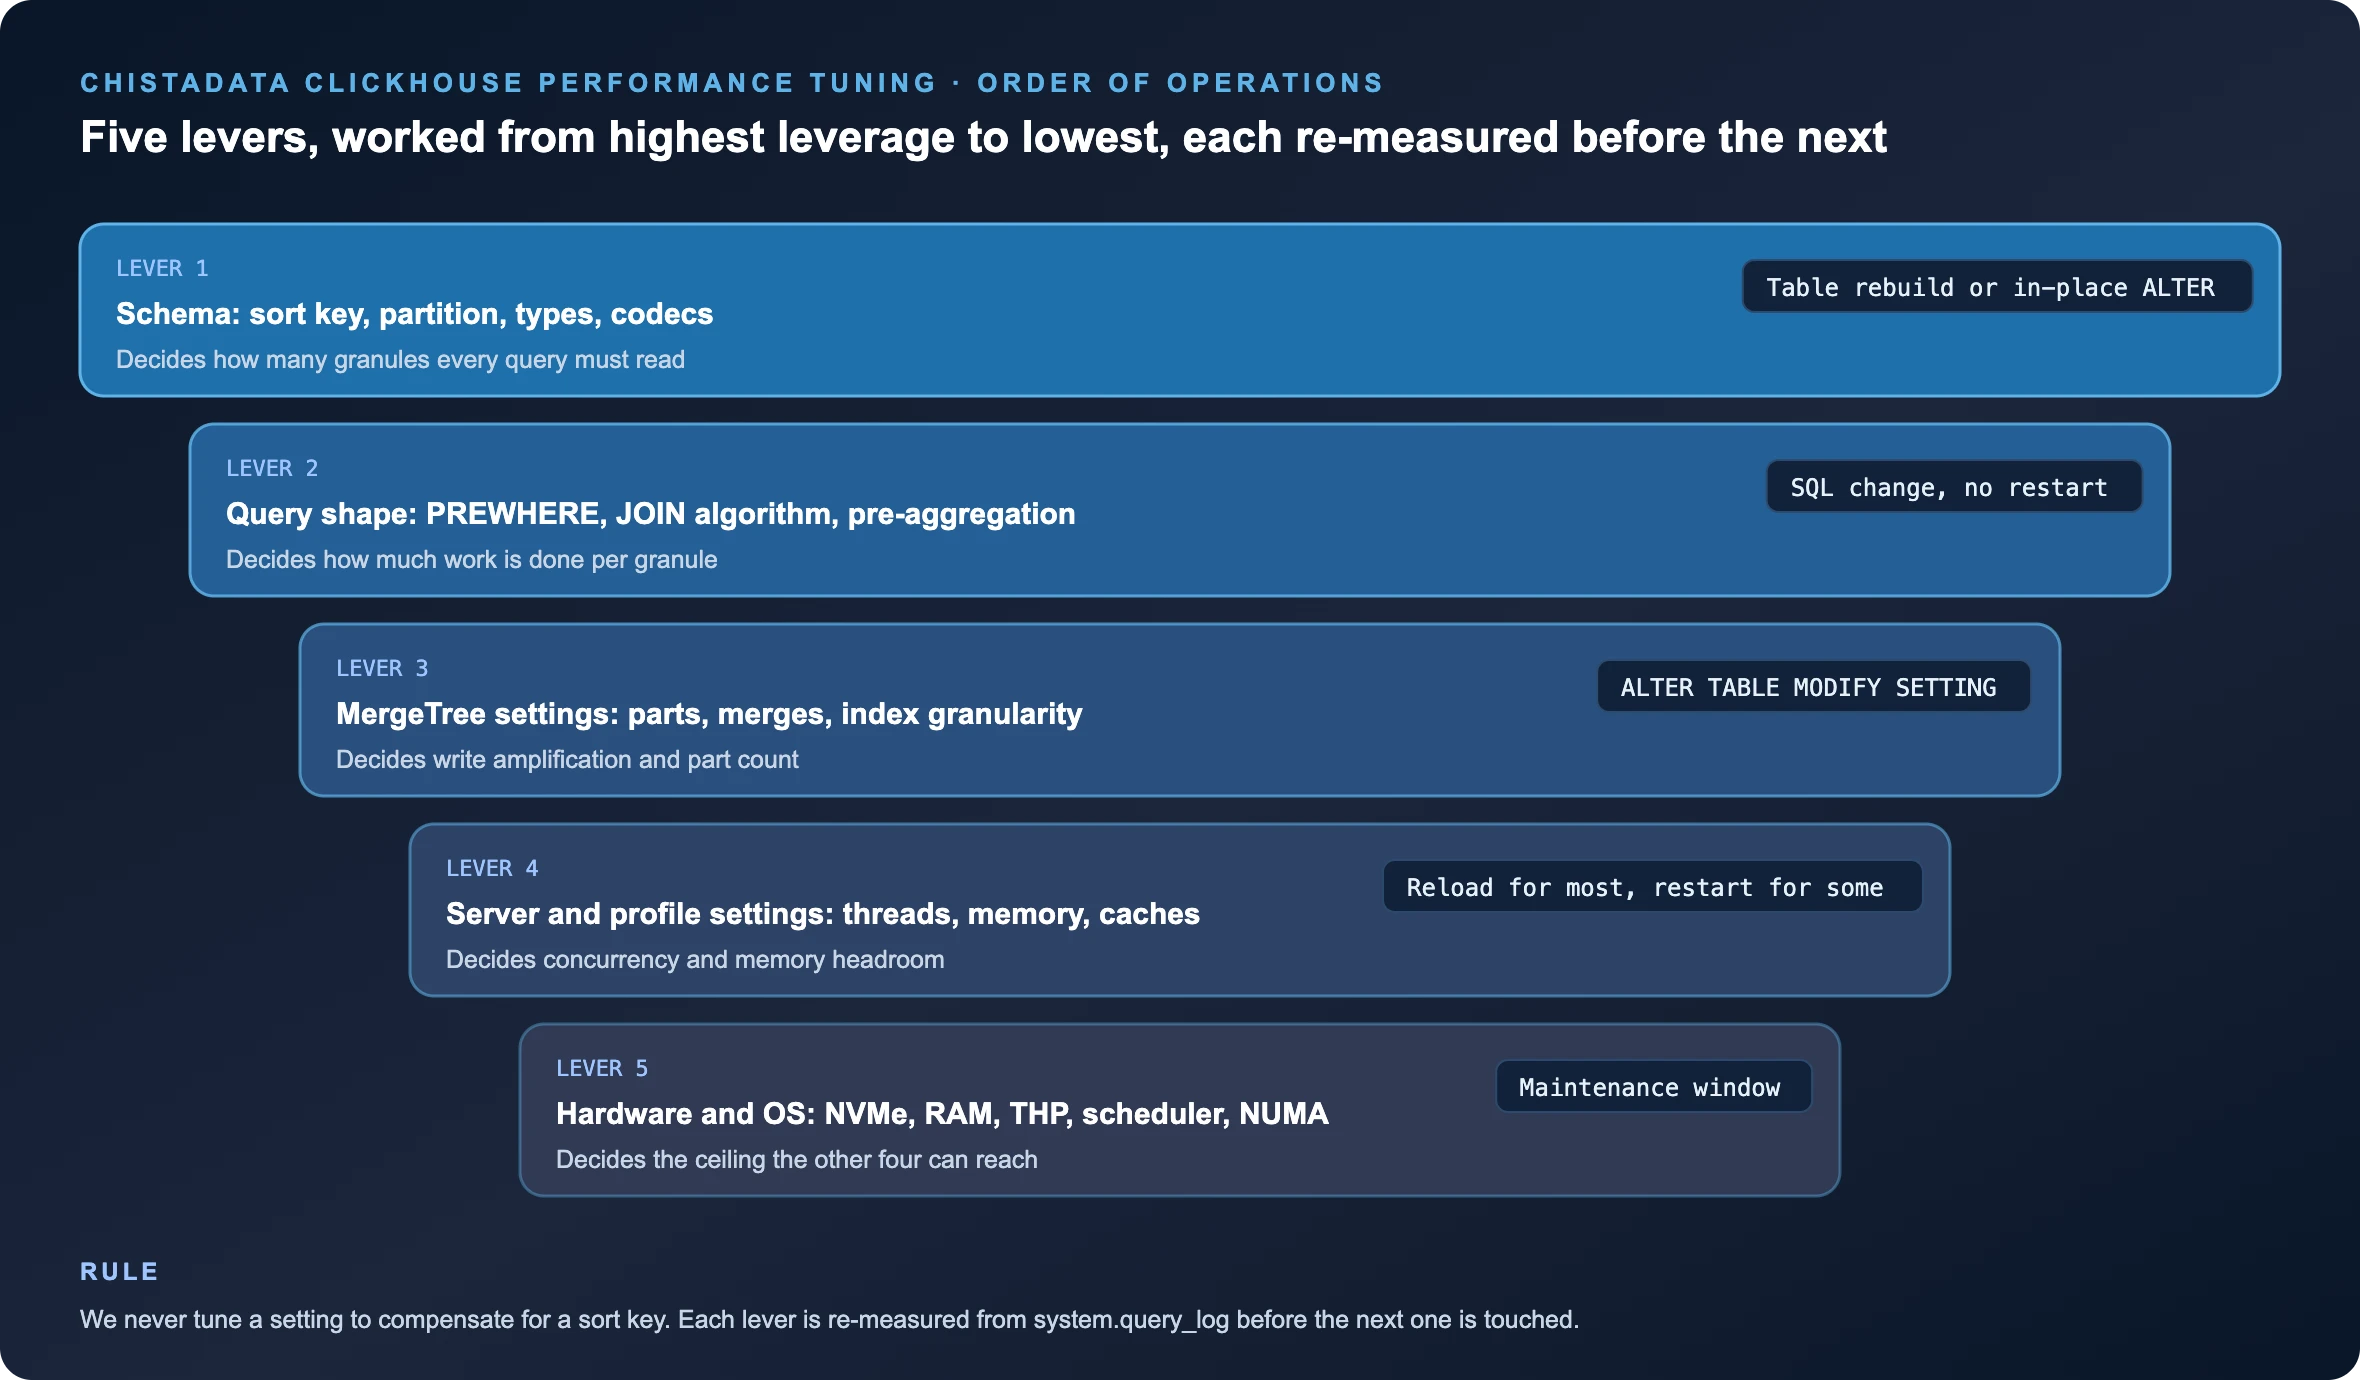
The order also reflects blast radius. A sort key change is a table rebuild and a cut-over; a query rewrite is a pull request; a MergeTree setting is an ALTER TABLE ... MODIFY SETTING that affects only new parts; most server settings reload without a restart. We push the expensive, high-leverage changes to the front of the plan where they are worth their cost, and keep the cheap, low-leverage ones for the end where they polish a workload that already reads the right granules.
Lever 1 · Schema
ClickHouse performance tuning lever 1: sort key, partition, column types and codecs
The single most effective ClickHouse performance tuning change is an ORDER BY that leads with the columns the workload filters on, in ascending cardinality, followed by the column that orders the scan. Everything else in this section is refinement.
ORDER BY and PRIMARY KEY
In ClickHouse performance tuning the key is derived from the top query classes in system.query_log, not from the data model. A multi-tenant events table filtered by tenant then time gets ORDER BY (tenant_id, event_type, event_time), with a shorter PRIMARY KEY (tenant_id, event_type) when the full key would bloat the in-memory index. The primary key must be a prefix of the sort key; the sort key can be longer to improve compression and ReplacingMergeTree semantics.
-- Rebuilt table with a workload-derived key (shadow-table pattern, cut over after backfill)
CREATE TABLE analytics.events_v2
(
 tenant_id     UInt32,
 event_type    LowCardinality(String),
 event_time    DateTime64(3, 'UTC'),
 user_id       UInt64,
 session_id    UUID,
 url           String CODEC(ZSTD(3)),
 latency_ms    UInt32 CODEC(T64, LZ4),
 amount        Decimal(18, 4),
 country       LowCardinality(FixedString(2)),
 properties    Map(LowCardinality(String), String)
)
ENGINE = ReplicatedMergeTree('/clickhouse/tables/{shard}/analytics/events_v2', '{replica}')
PARTITION BY toYYYYMM(event_time)
PRIMARY KEY (tenant_id, event_type)
ORDER BY (tenant_id, event_type, event_time)
TTL toDateTime(event_time) + INTERVAL 13 MONTH DELETE
SETTINGS index_granularity = 8192,
 min_bytes_for_wide_part = 10485760,
 ttl_only_drop_parts = 1;  -- Prove the key prunes before cutting over
EXPLAIN indexes = 1
SELECT count()
FROM analytics.events_v2
WHERE tenant_id = 4711
 AND event_type = 'purchase'
 AND event_time >= now() - INTERVAL 7 DAY;
Partition key
Partitions exist for data lifecycle, not for query speed, and ClickHouse performance tuning treats them that way. One partition per month is the default we start from; per-day partitions are justified only when the retention policy drops days, and per-hour partitions almost never survive a review because merges cannot consolidate across partitions and part counts explode. ttl_only_drop_parts = 1 turns TTL into a partition drop instead of a rewrite.
Types and codecs
Type and codec work is the quiet half of ClickHouse performance tuning. Every Nullable column costs a separate null-map read; we replace them with sentinels where the workload allows. Strings with fewer than a few tens of thousands of distinct values become LowCardinality(String); two-letter codes become FixedString(2); monotonic counters and timestamps take DoubleDelta or T64 before LZ4 or ZSTD. We measure the effect per column in system.parts_columns rather than assuming it.
-- In-place codec change on a hot column: applies to new parts, existing parts on next merge or OPTIMIZE
ALTER TABLE analytics.events_v2
 MODIFY COLUMN latency_ms UInt32 CODEC(T64, ZSTD(1));  -- Verify compression ratio per column after merges catch up
SELECT column, type, any(compression_codec) AS codec,
 formatReadableSize(sum(column_data_compressed_bytes))   AS compressed,
 round(sum(column_data_uncompressed_bytes) / greatest(sum(column_data_compressed_bytes), 1), 2) AS ratio
FROM system.parts_columns
WHERE active AND database = 'analytics' AND table = 'events_v2'
GROUP BY column, type
ORDER BY sum(column_data_compressed_bytes) DESC;
Skip indexes and projections
Skip indexes are the most over-used ClickHouse performance tuning tool we see. A data-skipping index only helps when the indexed column is correlated with the sort order at granule scale. minmax on a timestamp that is already in the sort key is redundant; bloom_filter on a high-cardinality user_id that is not in the key is the classic win; tokenbf_v1 on URL paths serves LIKE and hasToken. A projection gives a second sort order or a pre-aggregated shape inside the same table at the cost of extra merge work; we add one when a second query class cannot be served by the primary key and the write path has headroom.
ALTER TABLE analytics.events_v2
 ADD INDEX idx_user_bf user_id TYPE bloom_filter(0.01) GRANULARITY 4;
ALTER TABLE analytics.events_v2 MATERIALIZE INDEX idx_user_bf;  ALTER TABLE analytics.events_v2
 ADD PROJECTION proj_by_user
 (SELECT * ORDER BY (user_id, event_time));
ALTER TABLE analytics.events_v2 MATERIALIZE PROJECTION proj_by_user;  -- Which indexes exist, how big they are, and whether queries use them
SELECT database, table, name, type, granularity,
 formatReadableSize(data_compressed_bytes) AS on_disk
FROM system.data_skipping_indices
WHERE database = 'analytics';Lever 2 · Query shape
ClickHouse performance tuning lever 2: PREWHERE, JOIN algorithms and aggregation
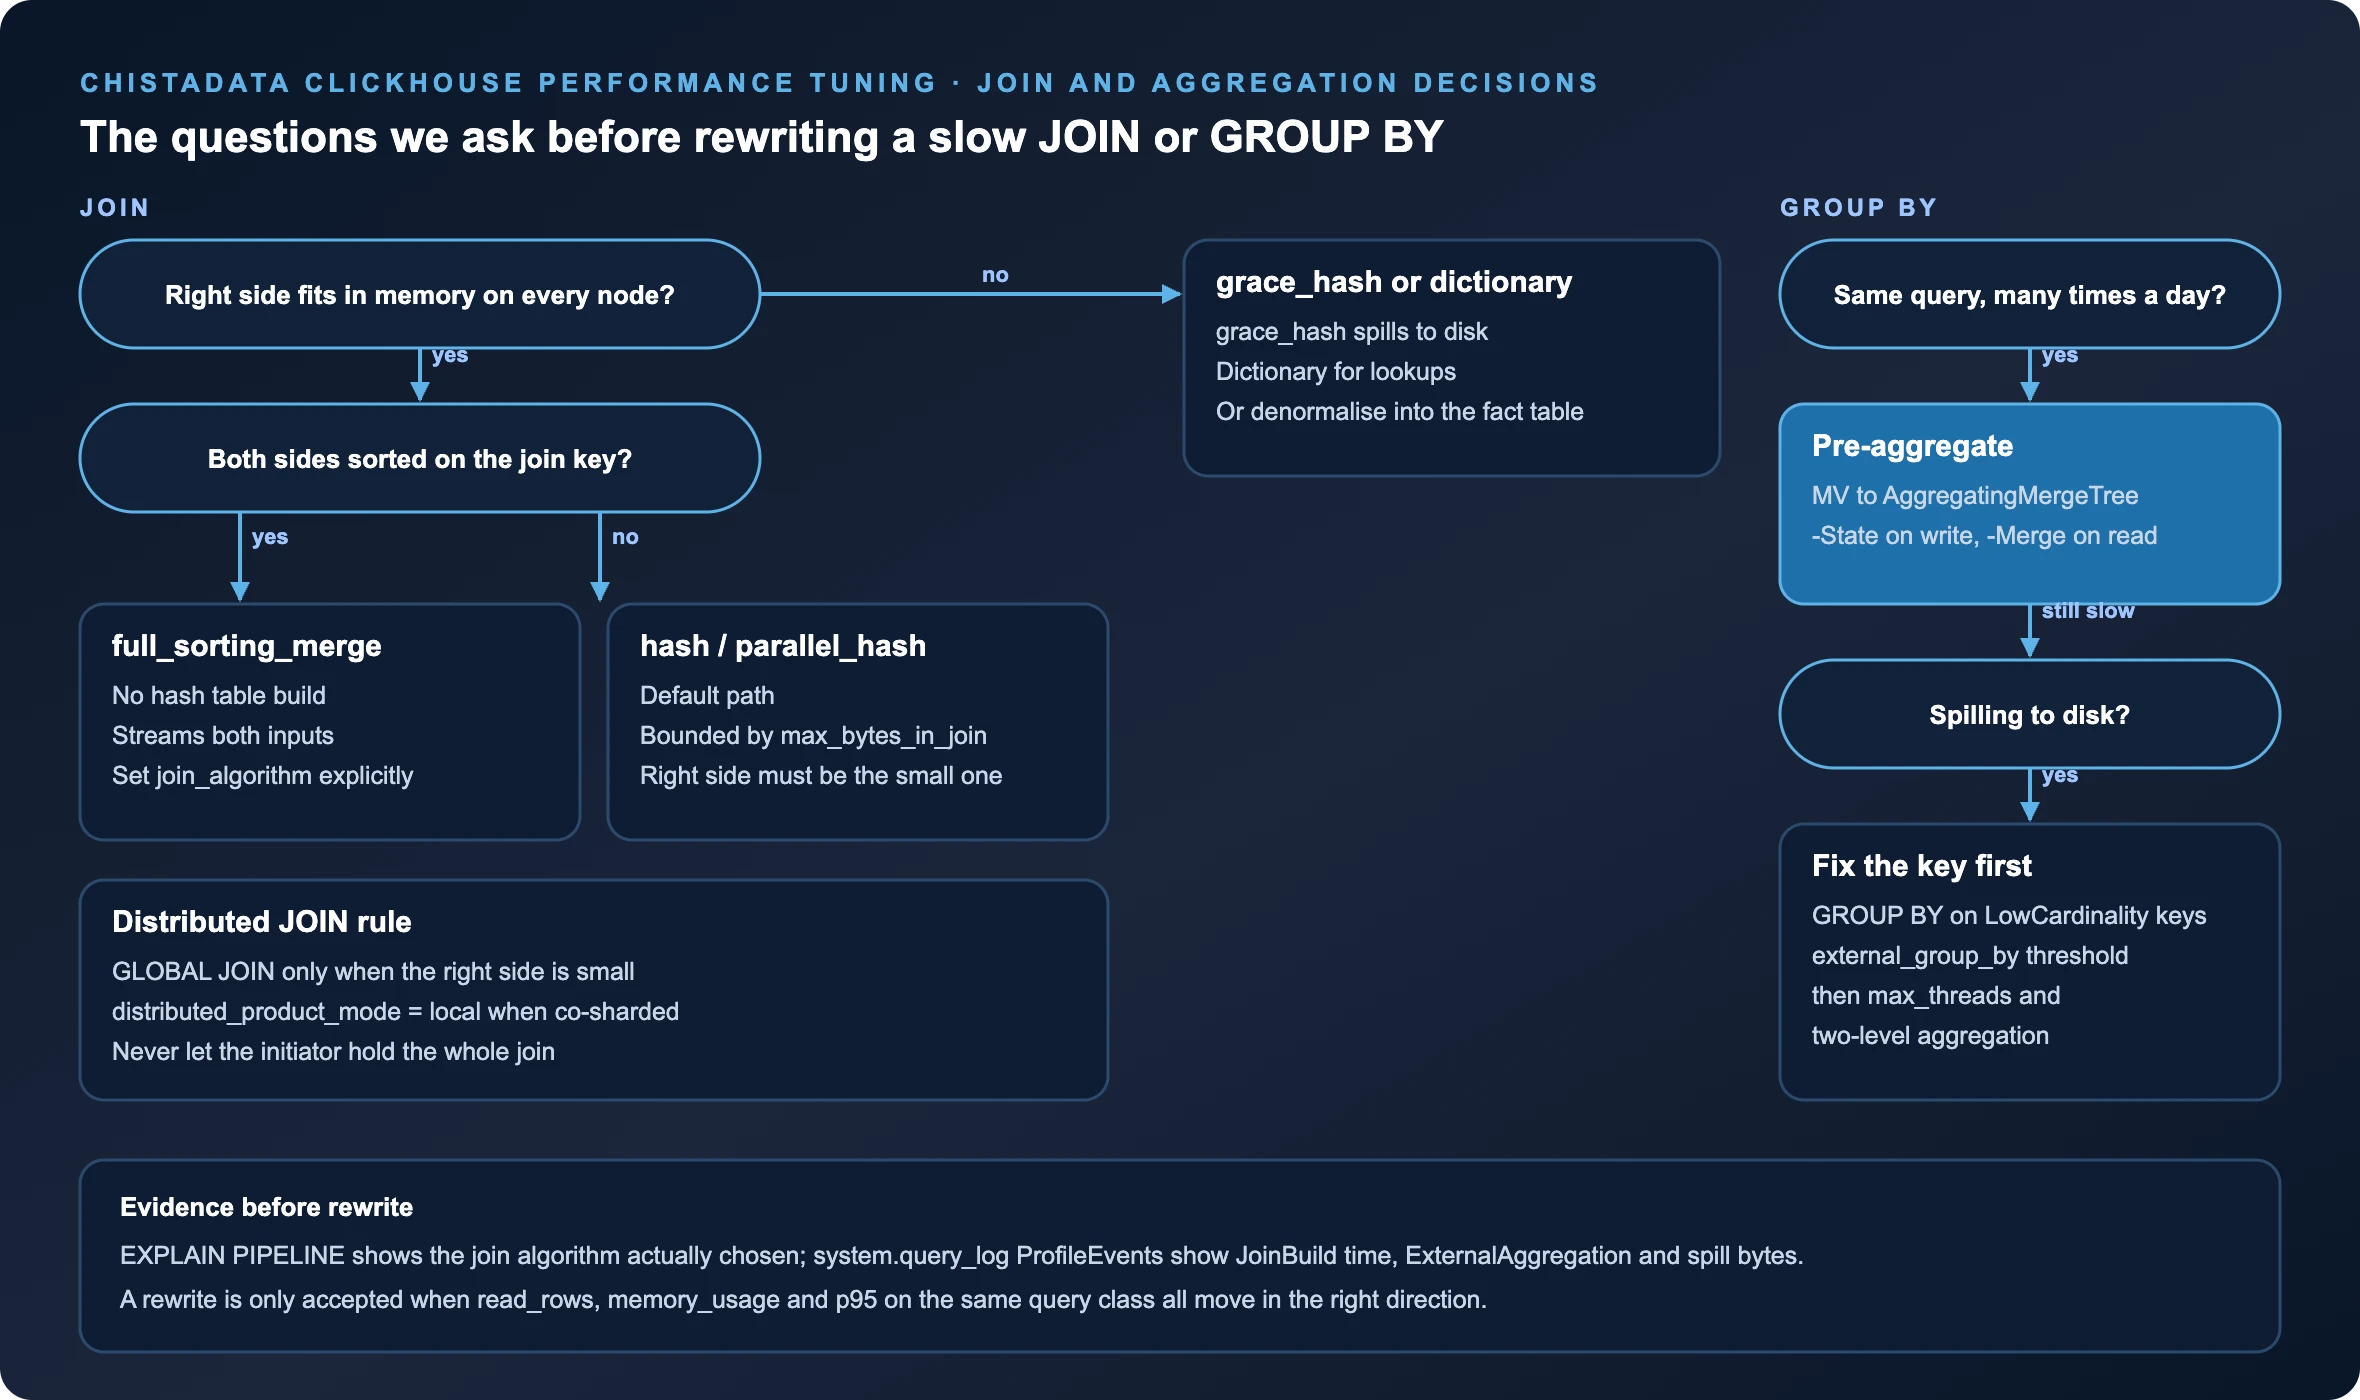
With the right granules selected, the next ClickHouse performance tuning question is how much work is done per granule. Most of that is decided by three things: which columns are read before filtering, which JOIN algorithm builds what in memory, and whether the GROUP BY key lets the aggregator stay in one level.
PREWHERE and column reads
PREWHERE is the first ClickHouse performance tuning check on any wide table. ClickHouse moves the most selective, cheapest predicates into PREWHERE automatically when optimize_move_to_prewhere is on, but it cannot see cost the way an engineer can. When a wide table is filtered on a narrow column, we write the PREWHERE explicitly, verify with EXPLAIN PIPELINE that the filter runs before the wide columns are read, and check ProfileEvents['ReadCompressedBytes'] on the query class.
JOIN algorithm selection
JOIN algorithm choice is where ClickHouse performance tuning most often changes a query from minutes to seconds without touching the schema. The default hash join builds the right side in memory on every node, so the right side must be the small one and must fit under max_bytes_in_join. When both sides are large and sorted on the join key, full_sorting_merge streams them without a hash table. When the right side does not fit, grace_hash spills in buckets, or the lookup moves into a dictionary, or the column is denormalised into the fact table at insert time. Across shards, GLOBAL JOIN ships the right side to every node and is only acceptable when it is small.
-- Dictionary instead of a repeated dimension JOIN
CREATE DICTIONARY analytics.dim_country
(
 country_code FixedString(2),
 region       String,
 tier         UInt8
)
PRIMARY KEY country_code
SOURCE(CLICKHOUSE(TABLE 'dim_country_src' DB 'analytics'))
LAYOUT(COMPLEX_KEY_HASHED())
LIFETIME(MIN 300 MAX 600);  SELECT
 dictGet('analytics.dim_country', 'region', country) AS region,
 count()                                             AS events
FROM analytics.events_v2
WHERE tenant_id = 4711
 AND event_time >= today() - 30
GROUP BY region;  -- Large-to-large join on a shared sort key: choose the algorithm explicitly
SELECT e.tenant_id, count()
FROM analytics.events_v2 AS e
INNER JOIN analytics.sessions AS s ON e.session_id = s.session_id
WHERE e.event_time >= today() - 1
GROUP BY e.tenant_id
SETTINGS join_algorithm = 'full_sorting_merge', max_threads = 16;
Aggregation shape
Aggregation is the last query-shape lever in ClickHouse performance tuning. GROUP BY on LowCardinality or small integer keys keeps the hash table compact and lets two-level aggregation parallelise cleanly. Wide string keys, uniqExact on high-cardinality columns and unbounded groupArray are the usual suspects when ProfileEvents['ExternalAggregationWritePart'] shows spilling. The fix order is key type first, then uniq or uniqCombined64 in place of uniqExact where the error is acceptable, then max_bytes_before_external_group_by as a safety net rather than a strategy.
-- Top-N per group without a self-join
SELECT tenant_id, event_type, cnt
FROM
(
 SELECT tenant_id, event_type, count() AS cnt
 FROM analytics.events_v2
 WHERE event_time >= today() - 7
 GROUP BY tenant_id, event_type
)
ORDER BY tenant_id, cnt DESC
LIMIT 3 BY tenant_id;  -- Latest row per key with argMax instead of a correlated subquery
SELECT session_id,
 argMax(url, event_time)        AS last_url,
 argMax(event_type, event_time) AS last_event
FROM analytics.events_v2
WHERE tenant_id = 4711 AND event_time >= today() - 1
GROUP BY session_id;Lever 3 · MergeTree
ClickHouse performance tuning lever 3: insert batching, parts and background merges
Every insert creates at least one part per partition it touches, and only merges consolidate them. ClickHouse performance tuning on the write path is therefore about keeping the merge rate ahead of the insert rate at peak, not about a single magic setting.
Batch at the source, then async_insert
The cheapest ClickHouse performance tuning fix on the write path is upstream: batch producers to tens of thousands of rows per insert. When producers cannot batch, async_insert = 1 with wait_for_async_insert = 1 lets the server buffer and flush by async_insert_max_data_size and async_insert_busy_timeout_ms while still acknowledging durability. We set it on the ingest user’s profile, not globally.
-- Ingest profile for high-frequency producers
CREATE SETTINGS PROFILE IF NOT EXISTS ingest_async
SETTINGS
 async_insert = 1,
 wait_for_async_insert = 1,
 async_insert_max_data_size = 10485760,
 async_insert_busy_timeout_ms = 1000,
 max_insert_block_size = 1048576,
 max_partitions_per_insert_block = 100;  ALTER USER ${CH_INGEST_USER} SETTINGS PROFILE 'ingest_async';  -- Is the merge rate keeping up? Parts created vs merged per hour on the hot tables
SELECT toStartOfHour(event_time)             AS hour,
 table,
 countIf(event_type = 'NewPart')        AS parts_created,
 countIf(event_type = 'MergeParts')     AS merges_done,
 round(avgIf(duration_ms, event_type = 'MergeParts')) AS avg_merge_ms
FROM system.part_log
WHERE event_time >= now() - INTERVAL 1 DAY
 AND database = 'analytics'
GROUP BY hour, table
ORDER BY hour, parts_created DESC;
Merge and part settings that are safe to tune
| Setting | Scope | What it bounds | How we tune it |
|---|---|---|---|
parts_to_delay_insert / parts_to_throw_insert | Table | Active parts per partition before inserts slow, then fail | Left at defaults; raising them hides an ingestion problem. We fix batching instead. |
max_bytes_to_merge_at_max_space_in_pool | Table | Largest merge the scheduler will attempt | Lowered on tables with very large partitions when big merges starve small ones. |
background_pool_size / background_merges_mutations_concurrency_ratio | Server | Concurrent merges and mutations | Raised only with measured CPU headroom at peak; restart or reload depending on release. |
min_bytes_for_wide_part | Table | Compact vs Wide part format threshold | Raised on tables with many small inserts so small parts stay compact and cheap to merge. |
merge_with_ttl_timeout / ttl_only_drop_parts | Table | How often TTL merges run and whether they rewrite parts | Drop whole parts where the partition key allows; schedule TTL merges off-peak. |
index_granularity / index_granularity_bytes | Table | Rows and bytes per granule | Lowered for point-lookup workloads on wide rows; raised for pure scans. Requires a rebuild. |
Mutations deserve their own line in any ClickHouse performance tuning plan. Mutations (ALTER ... UPDATE/DELETE) rewrite entire parts and queue behind merges on the same parts. We replace routine mutations with lightweight deletes where the release supports them, or with ReplacingMergeTree and FINAL-free read patterns, and keep system.mutations empty as an operational target.
Lever 4 · Server and profile
ClickHouse performance tuning lever 4: memory budget, threads, caches and concurrency
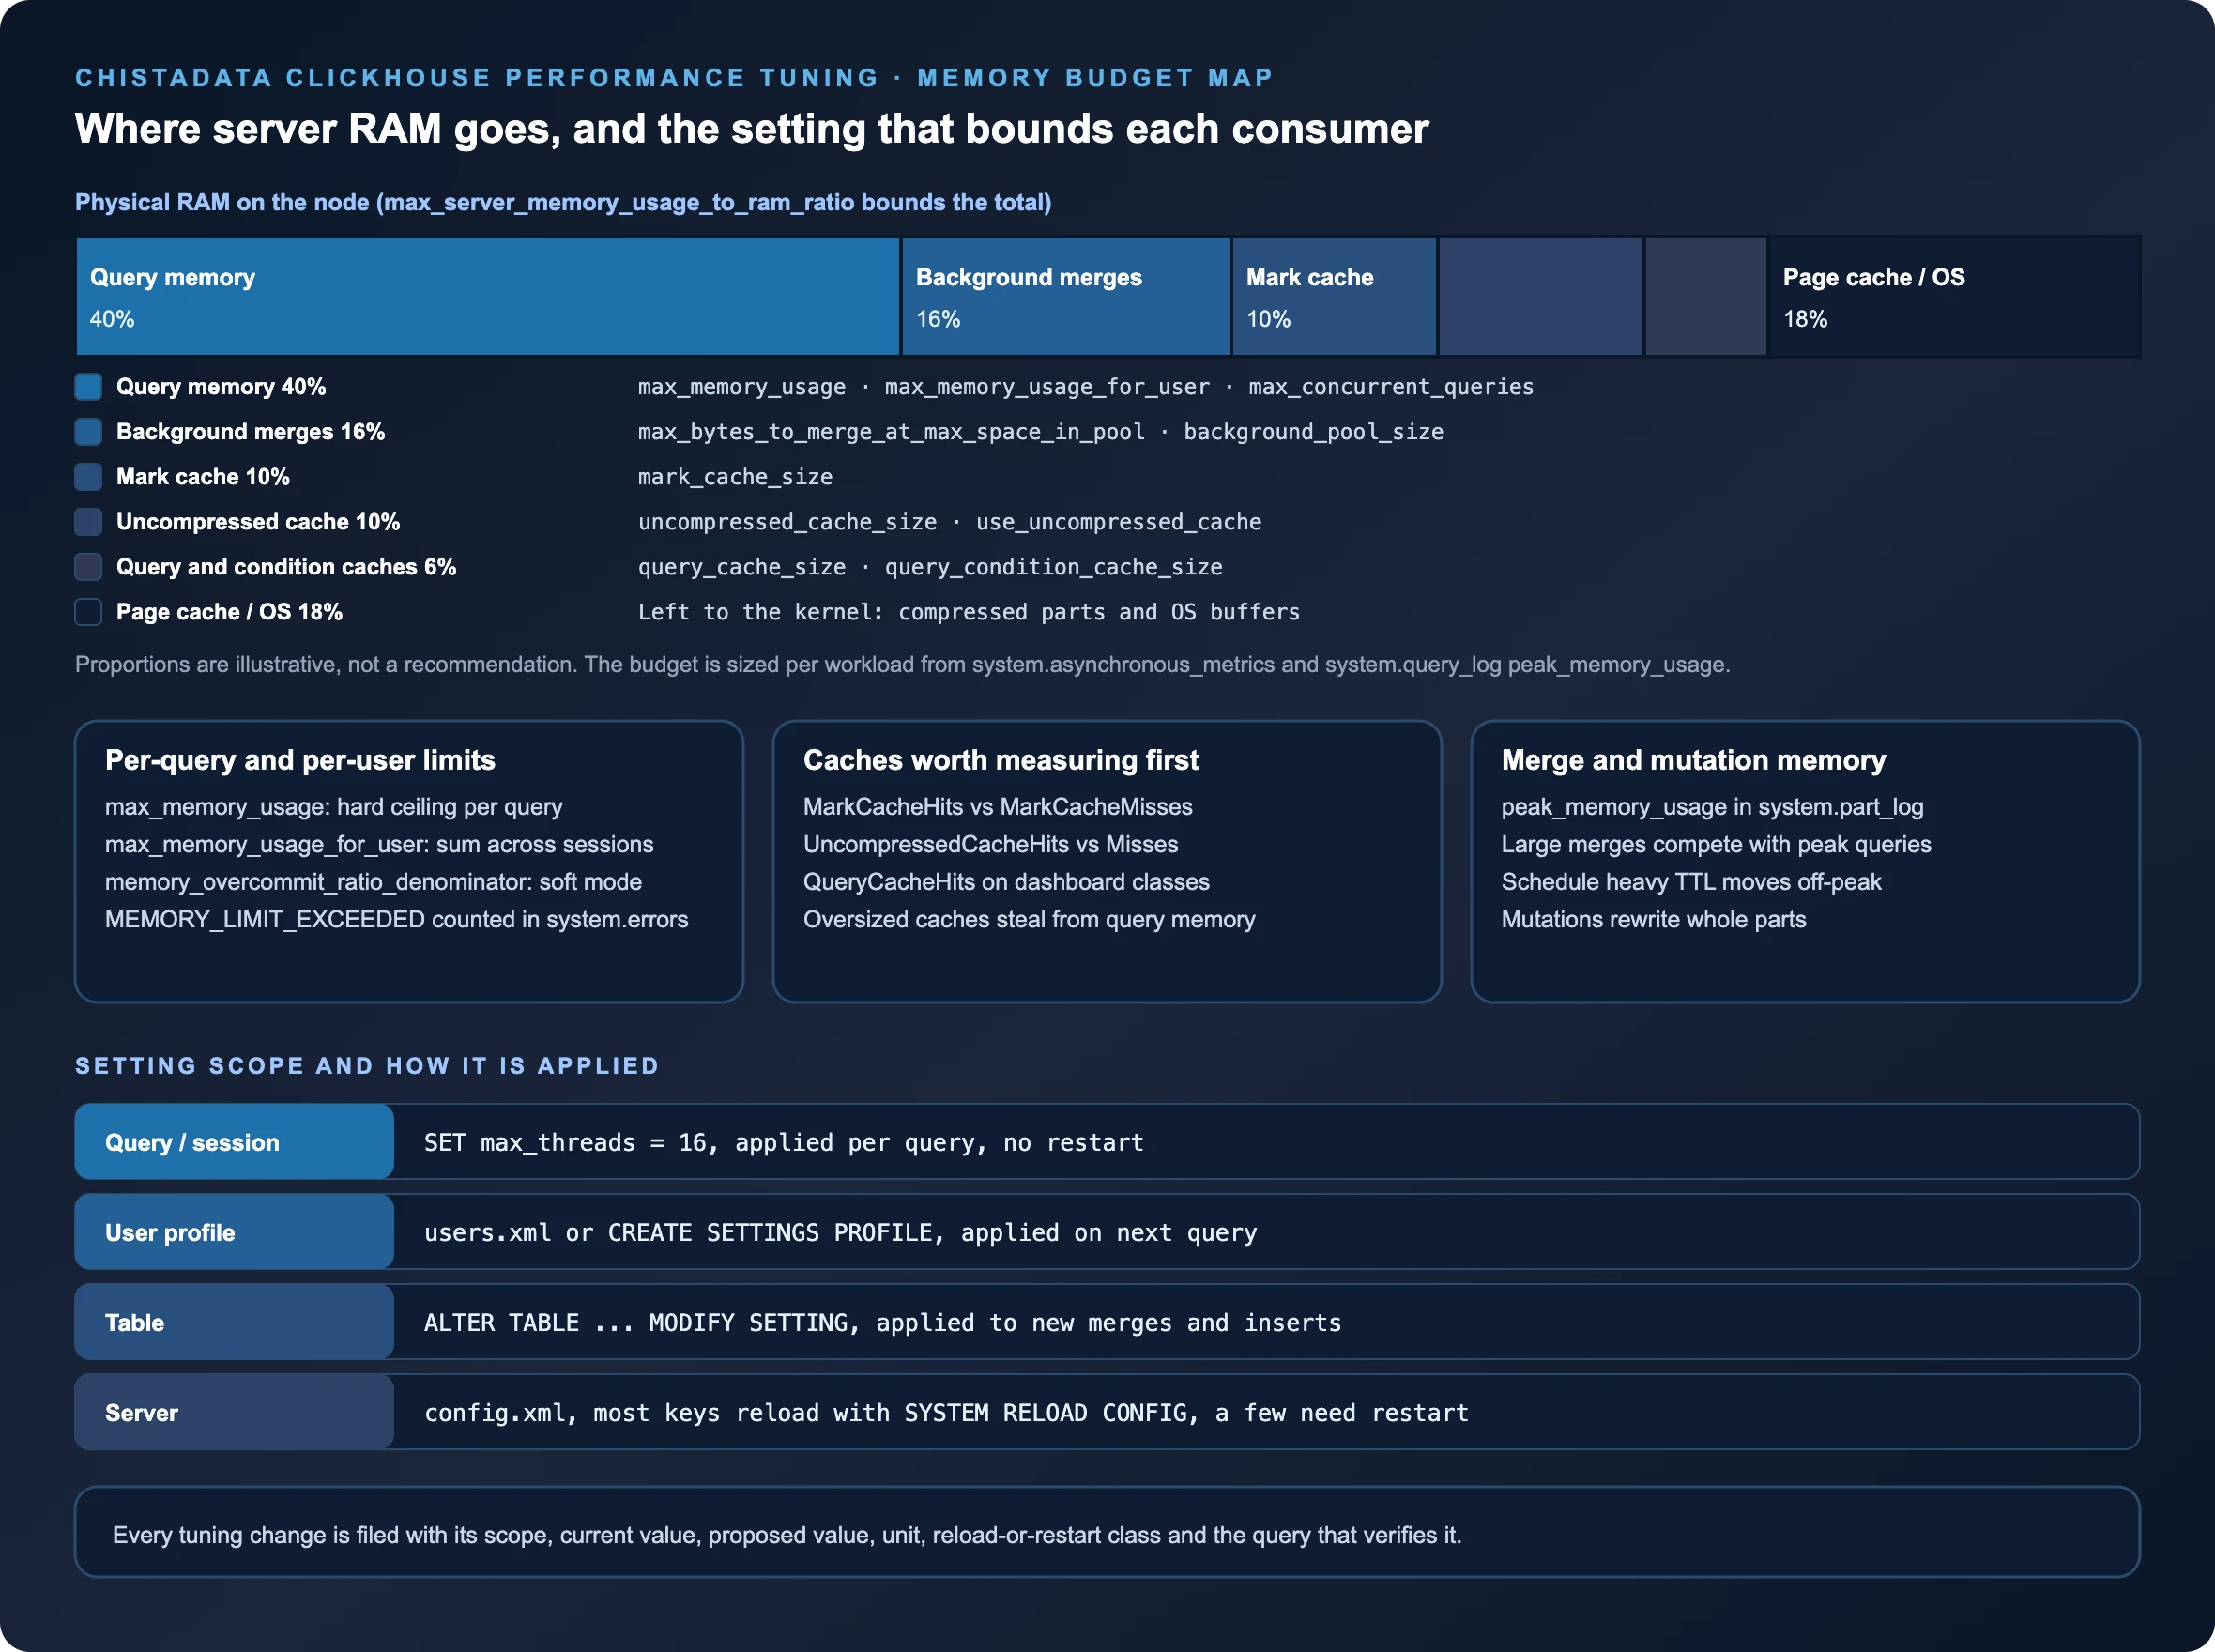
Server-level ClickHouse performance tuning starts from a memory budget. Query memory, background merges, the mark cache, the uncompressed cache and the query caches all draw from the same RAM, and the kernel page cache needs what is left to keep compressed parts hot.
Memory limits
Memory limits are the first server-level ClickHouse performance tuning setting we file. max_server_memory_usage_to_ram_ratio bounds the server; max_memory_usage bounds a query; max_memory_usage_for_user bounds a user across sessions. We size them so that the peak concurrency observed in system.query_log multiplied by the p99 peak_memory_usage of the heaviest class fits under the server bound with merge memory left over. Memory overcommit (memory_overcommit_ratio_denominator) is enabled for BI users so an occasional heavy query borrows rather than fails, and disabled for ingest.
Threads and concurrency
Thread settings are the most misused ClickHouse performance tuning knob. max_threads defaults to the physical core count and is right for one query at a time; dashboards running twenty concurrent queries on a 32-core node do better with a per-profile cap of 8 and max_concurrent_queries sized to keep the run queue bounded. EXPLAIN PIPELINE tells us how many processors each stage actually used, which is frequently fewer than the setting because the number of parts or granules capped it.
Caches
Cache sizing is ClickHouse performance tuning by measurement, not by rule of thumb. The mark cache is the one that must not miss: MarkCacheMisses rising with MarkCacheBytes pinned at its limit means mark_cache_size is too small for the working set of parts. The uncompressed cache helps only short repeated reads of the same granules and hurts wide scans; we enable it per profile with use_uncompressed_cache = 1 rather than globally. The query result cache (use_query_cache) is turned on for dashboard profiles with a TTL matched to the refresh interval, and the query condition cache is left on where the release provides it.
-- Dashboard profile: bounded threads, memory and a result cache matched to the refresh interval
CREATE SETTINGS PROFILE IF NOT EXISTS bi_dashboards
SETTINGS
 max_threads = 8,
 max_memory_usage = 10737418240,
 max_execution_time = 60,
 use_query_cache = 1,
 query_cache_ttl = 60,
 query_cache_min_query_runs = 2,
 use_uncompressed_cache = 1,
 max_bytes_before_external_group_by = 4294967296
TO ${CH_BI_ROLE};  -- Cache and memory pressure snapshot (run before and after the change)
SELECT metric, value
FROM system.asynchronous_metrics
WHERE metric IN ('MarkCacheBytes', 'MarkCacheFiles', 'UncompressedCacheBytes',
 'MemoryResident', 'OSMemoryAvailable', 'MaxPartCountForPartition')
ORDER BY metric;  SELECT event, value
FROM system.events
WHERE event IN ('MarkCacheHits', 'MarkCacheMisses', 'QueryCacheHits', 'QueryCacheMisses',
 'ExternalAggregationWritePart', 'OSIOWaitMicroseconds')
ORDER BY event;
Server-side ClickHouse performance tuning changes in config.xml are made one at a time, reloaded with SYSTEM RELOAD CONFIG where the key supports it, and the small set that needs a restart (listen hosts, some cache sizes on older releases, thread pool sizes) is batched into a single maintenance window with a rollback copy of the previous file.
Lever 5 · Hardware and OS
ClickHouse performance tuning lever 5: hardware and OS, the ceiling the other four can reach
Hardware is last because it is the most expensive lever and the one most often pulled too early. When the first four levers have been worked and the cluster is still bound, the profile tells us which resource to buy.
STORAGE
NVMe for hot parts, object storage for cold
Merges and wide scans are sequential; point lookups and mark reads are random. Local NVMe serves both; a tiered storage policy moves partitions older than the working set to S3-compatible storage with a local cache sized to the recent partitions dashboards actually touch. We verify with system.parts.disk_name that hot data is on the hot volume.
KERNEL
Transparent huge pages, scheduler, swap
THP set to madvise or never, vm.swappiness low with swap present as a safety net, mq-deadline or none for NVMe, CPU governor on performance, and a file-descriptor limit far above the part count. These are checked against the ClickHouse recommendations for the release in use.
TOPOLOGY
NUMA, network and Keeper placement
Two-socket nodes need memory allocation and thread pinning that respect NUMA boundaries, or cross-socket traffic caps throughput. Replication fetches and Distributed queries want 10 GbE or better between nodes. ClickHouse Keeper belongs on dedicated hosts with fast fsync storage; a Keeper co-located with a data node bounds every replicated insert on that node’s disk.
SIZING
Buy the resource the profile names
OSCPUWaitMicroseconds high with OSIOWaitMicroseconds low is a CPU purchase; the reverse is a storage purchase; MEMORY_LIMIT_EXCEEDED with caches already trimmed is a RAM purchase. Adding shards is justified only when a single replica set is bound on CPU or storage after levers one to four.
Cross-cutting
Pre-aggregation: moving work from query time to insert time
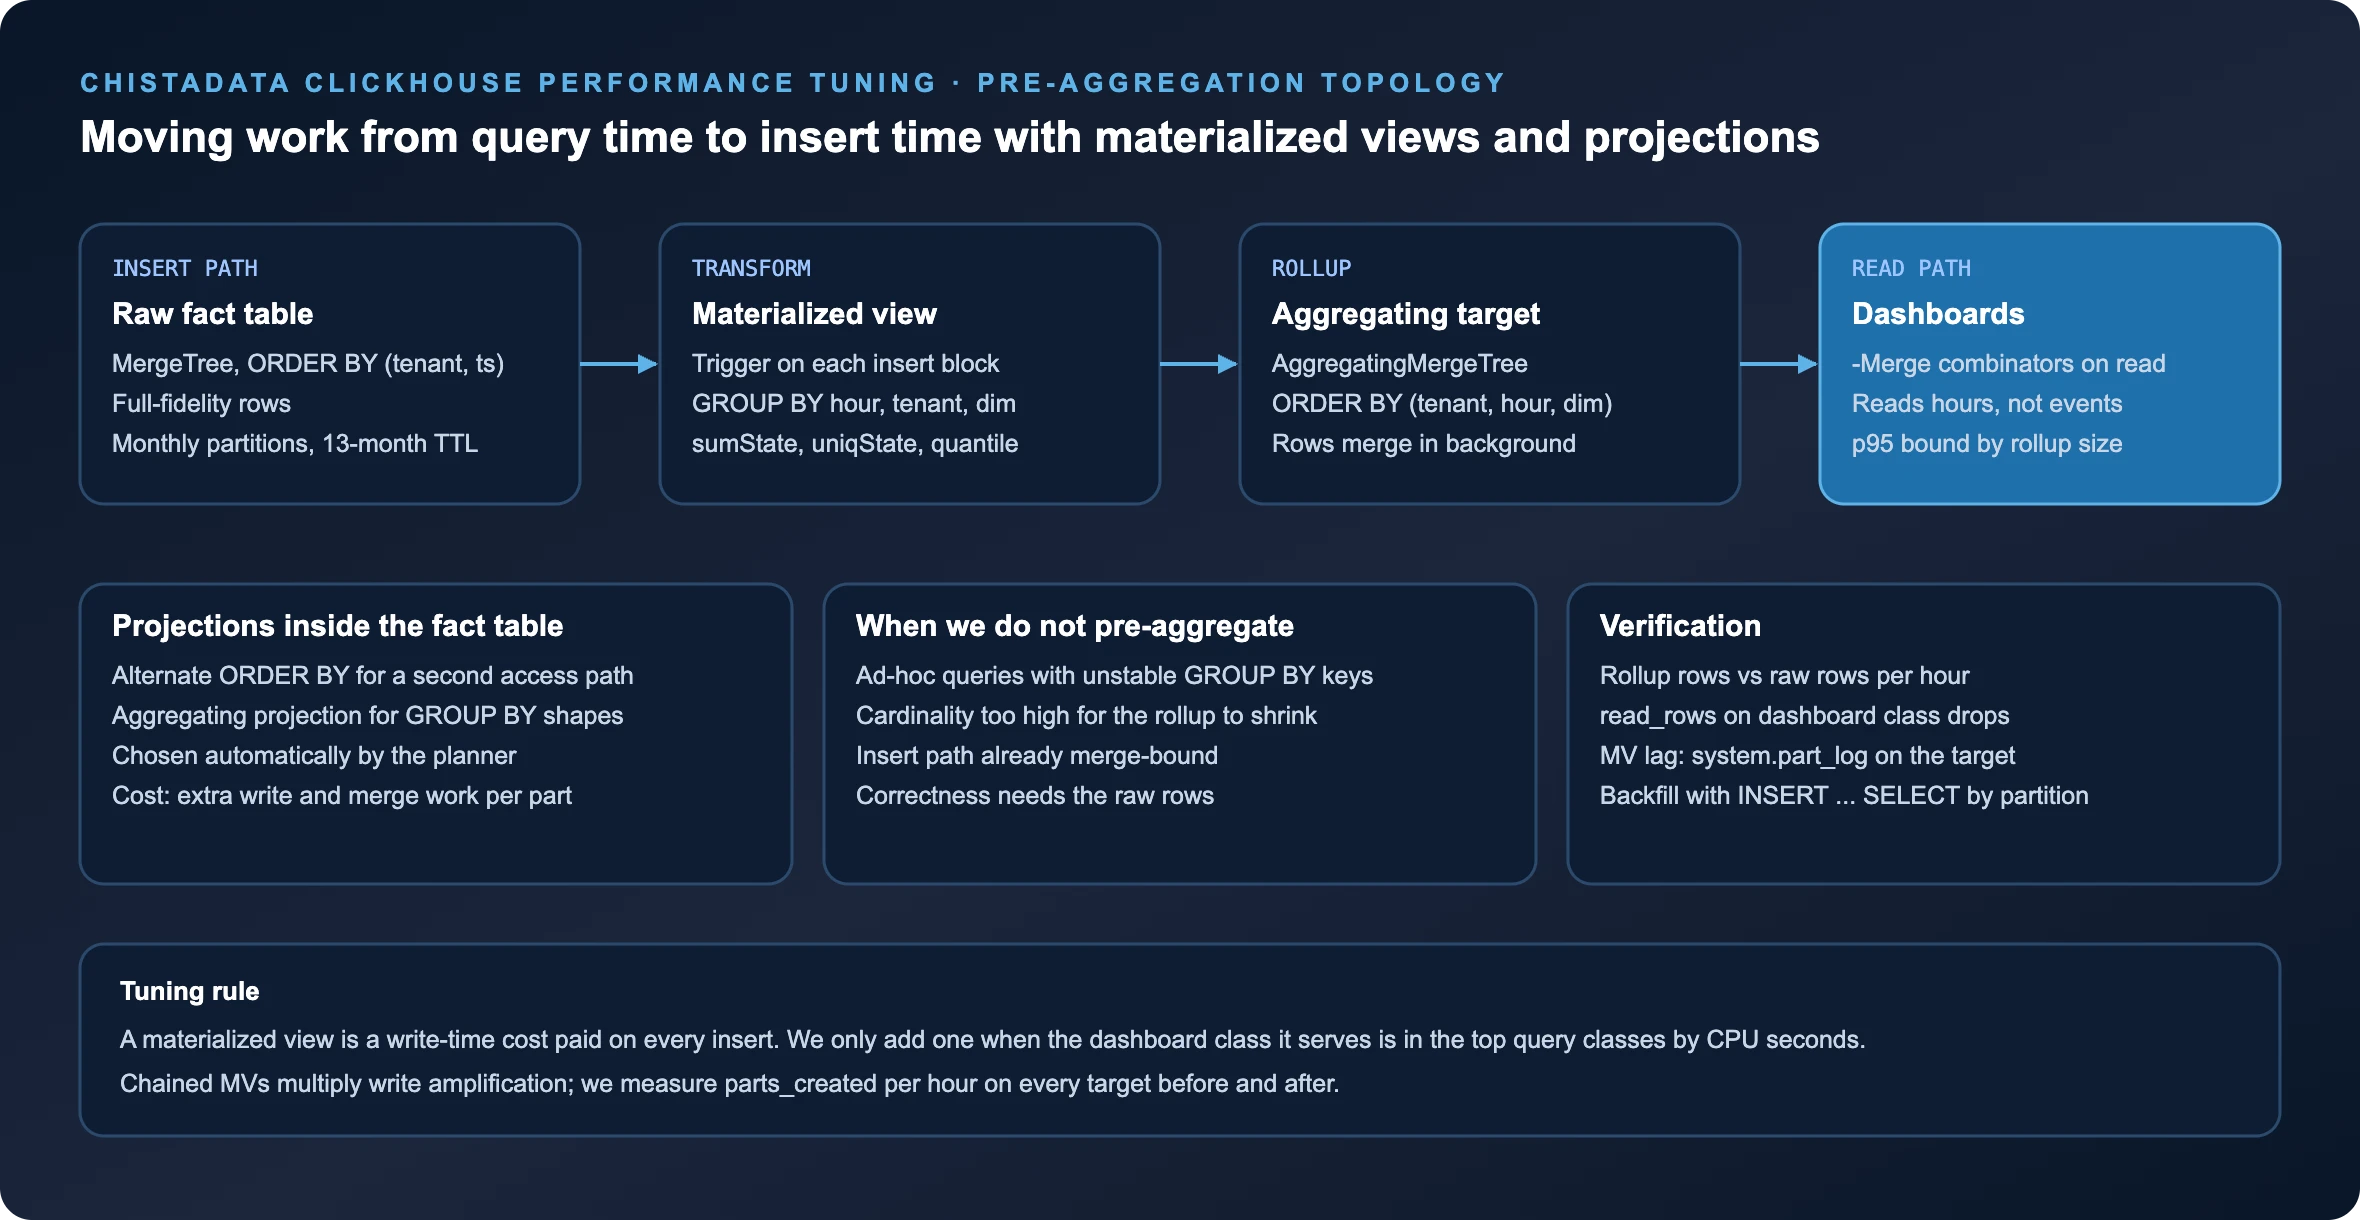
When a dashboard query class dominates CPU seconds and its GROUP BY keys are stable, the best ClickHouse performance tuning move is to stop running it against raw rows. A materialized view feeding an AggregatingMergeTree target computes the rollup once per insert block; the dashboard then reads hours instead of events.
CREATE TABLE analytics.events_hourly
(
 tenant_id   UInt32,
 hour        DateTime,
 event_type  LowCardinality(String),
 events      AggregateFunction(sum, UInt64),
 users       AggregateFunction(uniqCombined64, UInt64),
 p95_latency AggregateFunction(quantileTDigest(0.95), UInt32)
)
ENGINE = ReplicatedAggregatingMergeTree('/clickhouse/tables/{shard}/analytics/events_hourly', '{replica}')
PARTITION BY toYYYYMM(hour)
ORDER BY (tenant_id, hour, event_type);  CREATE MATERIALIZED VIEW analytics.mv_events_hourly
TO analytics.events_hourly
AS SELECT
 tenant_id,
 toStartOfHour(event_time)                 AS hour,
 event_type,
 sumState(toUInt64(1))                     AS events,
 uniqCombined64State(user_id)              AS users,
 quantileTDigestState(0.95)(latency_ms)    AS p95_latency
FROM analytics.events_v2
GROUP BY tenant_id, hour, event_type;  -- Backfill one partition at a time, then verify against the raw table
INSERT INTO analytics.events_hourly
SELECT tenant_id, toStartOfHour(event_time), event_type,
 sumState(toUInt64(1)), uniqCombined64State(user_id), quantileTDigestState(0.95)(latency_ms)
FROM analytics.events_v2
WHERE toYYYYMM(event_time) = 202609
GROUP BY tenant_id, toStartOfHour(event_time), event_type;  SELECT tenant_id, event_type,
 sumMerge(events)                 AS events,
 uniqCombined64Merge(users)       AS users,
 quantileTDigestMerge(0.95)(p95_latency) AS p95_ms
FROM analytics.events_hourly
WHERE tenant_id = 4711 AND hour >= now() - INTERVAL 24 HOUR
GROUP BY tenant_id, event_type;
Pre-aggregation is the ClickHouse performance tuning change with the largest payoff and the largest hidden cost. The write-time cost is real: every insert into the fact table now also inserts into the rollup, and chained views multiply parts. We add a view only when the class it serves is in the top query classes by CPU seconds, we measure parts_created per hour on the target before and after, and we prefer an aggregating projection inside the fact table when the rollup key is a strict subset of the sort key.
Measurement
How every ClickHouse performance tuning change is proven
A ClickHouse performance tuning change that cannot be measured is not made. Each lever ends with the same protocol: baseline the affected query classes, apply one change, re-measure the same classes over a comparable window, and keep or revert.
-- Baseline and re-measurement on the same query classes
-- Run before the change, then again after, with the same 24 h window boundaries
SELECT
 normalized_query_hash,
 count()                                                    AS executions,
 quantile(0.50)(query_duration_ms)                          AS p50_ms,
 quantile(0.95)(query_duration_ms)                          AS p95_ms,
 quantile(0.99)(query_duration_ms)                          AS p99_ms,
 sum(read_rows)                                             AS read_rows,
 sum(read_bytes)                                            AS read_bytes,
 max(memory_usage)                                          AS peak_memory,
 sum(ProfileEvents['OSCPUVirtualTimeMicroseconds']) / 1e6   AS cpu_seconds,
 sum(ProfileEvents['SelectedMarks'])                        AS selected_marks
FROM system.query_log
WHERE type = 'QueryFinish'
 AND event_time BETWEEN toDateTime('${WINDOW_START}') AND toDateTime('${WINDOW_END}')
 AND normalized_query_hash IN (${TARGET_CLASSES})
GROUP BY normalized_query_hash
ORDER BY cpu_seconds DESC;  -- Controlled comparison of one query on staging
clickhouse-benchmark --host ${CH_STAGING_HOST} --user ${CH_USER} --password ${CH_PASSWORD} \
--iterations 200 --concurrency 4 --query "$(cat top_query_class.sql)"| Lever | Metric that must move | Where it is read |
|---|---|---|
| Schema | SelectedMarks and read_rows per result row down; compressed bytes per column down | system.query_log, system.parts_columns |
| Query shape | ReadCompressedBytes, peak_memory_usage and p95 down on the same class | system.query_log, EXPLAIN PIPELINE |
| MergeTree | Active parts per partition stable at peak; merge rate at or above insert rate | system.parts, system.part_log |
| Server and profile | Cache hit ratios up; MEMORY_LIMIT_EXCEEDED count flat; p99 under concurrency down | system.events, system.errors |
| Hardware and OS | OSIOWaitMicroseconds or OSCPUWaitMicroseconds down for the same workload | system.events, node exporter |
ClickHouse performance tuning results are reported the same way. We never publish or promise a percentage improvement before it has been measured on your workload. The report states the metric, the direction and the query; the numbers come from your cluster.
Delivery
How ClickHouse performance tuning is delivered by ChistaDATA
OPTION A
ClickHouse performance tuning sprint
A bounded engagement on one cluster: baseline, levers one to four applied in staged waves with a verification gate after each, and a versioned change log under a CD-TUN-YYYY-MM-TAG document ID. Usually preceded by a ClickHouse performance audit that ranks what to touch first.
OPTION B
Continuous tuning under managed services
The same method run as an operating cadence: weekly review of the top query classes, scheduled schema and pre-aggregation work, merge and memory budgets adjusted as the workload grows, all inside ClickHouse managed services with 24×7 coverage and S1 15-minute response.
OPTION C
Engineer-to-engineer consulting
Your team applies the levers; ours reviews the sort keys, rewrites and settings before they ship, on a ClickHouse consulting retainer. Best when an in-house team wants the method and the second opinion rather than the hands.
ALWAYS
Change safety
Reversible, staged changes; rollback path written before the change; verification query before and after; no destructive operation without an explicit confirmation gate in the runbook. Support continues through 24×7 ClickHouse support if a change needs reverting under pressure.
Release coverage for tuning engagements follows the current LTS calendar:
Release coverage: ChistaDATA delivers consulting, 24×7 support, managed services and remote DBA on ClickHouse 26.9 (latest stable release, September 2026), 26.8 LTS (current long-term-support release, August 2026, supported to August 2027) and 26.3 LTS (supported to March 2027), plus every supported stable release in between, with upgrade engineering for 24.x and 25.x estates, including 25.8 LTS, which reached end of support in August 2026. Last verified October 2026.
FAQ
ClickHouse performance tuning questions we are asked most
Which single ClickHouse performance tuning change usually helps most?
A sort key that leads with the columns the dominant query classes filter on. It reduces the granules every query must read, which reduces every downstream cost. Settings changes cannot recover what a wrong sort key throws away.
Is raising max_threads a safe first ClickHouse performance tuning step?
Rarely. On a busy cluster it increases contention without increasing throughput, and it hides read amplification. We set max_threads per profile after the schema and query levers, and we confirm with EXPLAIN PIPELINE that the extra threads are actually used.
Can ClickHouse performance tuning be done without a table rebuild?
Much of it can: codec changes, skip indexes, projections, MergeTree settings, profiles, caches and query rewrites are all in place. A sort key or partition change needs a shadow table, a backfill and a cut-over, and we scope that as its own staged change with a rollback.
Do you do ClickHouse performance tuning on ClickHouse Cloud?
Yes. Schema, query shape and pre-aggregation apply unchanged. SharedMergeTree and the managed control plane remove most server and hardware levers, so the tuning plan there is weighted to levers one and two plus service sizing.
How long does a ClickHouse performance tuning sprint take?
Levers two to four on a single cluster typically fit in two to three weeks including verification gates. Schema rebuilds and pre-aggregation backfills add time proportional to data volume and are scheduled around your release calendar.
What do you need from us to start ClickHouse performance tuning?
Seven days of system.query_log and system.part_log covering a business peak, the exact server and Keeper versions, the cluster and storage-policy definitions, and the query classes or pipelines your users care about. A read-only user is enough for the baseline; changes are applied by your team or under a change gate we agree in advance.
Next step
Start ClickHouse performance tuning with a baseline, not a guess
Send us the query classes that are slow and the release you run, and ClickHouse performance tuning starts from evidence. We will baseline them, tell you which lever they need, and put the plan in writing with the metric each change must move.
Reference: the official ClickHouse documentation on query-level settings and MergeTree table settings is the authority for defaults and reload behaviour on your release.