ChistaDATA · ClickHouse Performance Audit · Measurement-driven, read-only, versioned
ClickHouse Performance Audit: Query Latency, Ingestion Throughput and Cluster Scalability Reviewed From the System Tables Up
A ClickHouse performance audit from ChistaDATA is a read-only engineering review of a production ClickHouse estate. We capture telemetry from system.query_log, system.parts, system.merges, system.replication_queue and the rest of the system.* surface, classify the workload, and rank every finding by measured impact. The deliverable is a versioned report in which each recommendation names the metric that justifies it, the setting or DDL that implements it, whether it needs a reload or a restart, and how it is rolled back.
Nothing is changed during the audit. No settings are altered, no mutations are issued and no parts are touched. The ClickHouse performance audit exists to give your engineers a ranked, evidence-backed change plan they can execute in staged, reversible steps.
What this page covers
A ClickHouse performance audit, explained the way we run it
This page describes the scope, method, telemetry, findings model and deliverable of a ChistaDATA ClickHouse performance audit in enough technical detail that your own team can judge whether the review is worth commissioning, and what to prepare if it is.
Scope
What a ClickHouse performance audit examines
ClickHouse is fast by construction, which is exactly why a slow ClickHouse cluster is almost always a layout, workload or topology problem rather than an engine problem. The ClickHouse performance audit is organised around the nine places where those problems live.
01
Workload profile
Query classes by normalized_query_hash, p50/p95/p99 latency per class, read amplification, insert-to-read ratio, peak windows and concurrency from system.query_log.
02
Schema and MergeTree layout
ORDER BY selectivity, partition granularity, index_granularity, column types, LowCardinality and Nullable use, codecs and TTL, from system.tables, system.columns and system.parts_columns.
03
Query plane
Partition pruning, primary key and skip index effectiveness, projection substitution, PREWHERE, JOIN algorithm and memory, spill events, from EXPLAIN indexes = 1, EXPLAIN PIPELINE and ProfileEvents.
04
Ingestion and merges
Insert batch shape, async inserts, parts per partition, merge throughput versus insert throughput, mutation backlog and materialized-view write amplification, from system.part_log, system.merges and system.mutations.
05
Cluster and replication
Shard and replica topology, Distributed table routing, replication queue depth and postpone reasons, fetch versus merge balance, from system.clusters, system.replicas and system.replication_queue.
06
ClickHouse Keeper
Ensemble size and placement, fsync and snapshot latency, session churn, znode growth, outstanding request depth, from system.zookeeper, system.zookeeper_connection and Keeper’s 4-letter-word metrics.
07
Storage and memory
Disk and volume policy, tiered S3 or object storage behaviour, mark and uncompressed cache hit ratios, memory limits per query, user and server, from system.disks, system.storage_policies and system.asynchronous_metrics.
08
OS and configuration
Kernel, filesystem, mount options, transparent huge pages, CPU governor, NUMA, ulimits, config.xml and users.xml deltas from defaults, and the server-version feature surface actually in use.
09
Security and observability posture
RBAC, quotas, row and column policies, audit logging, TLS, and whether query_log, part_log, trace_log and the Prometheus endpoint are retained long enough to support the next review.
Method
ClickHouse performance audit workflow, stage by stage
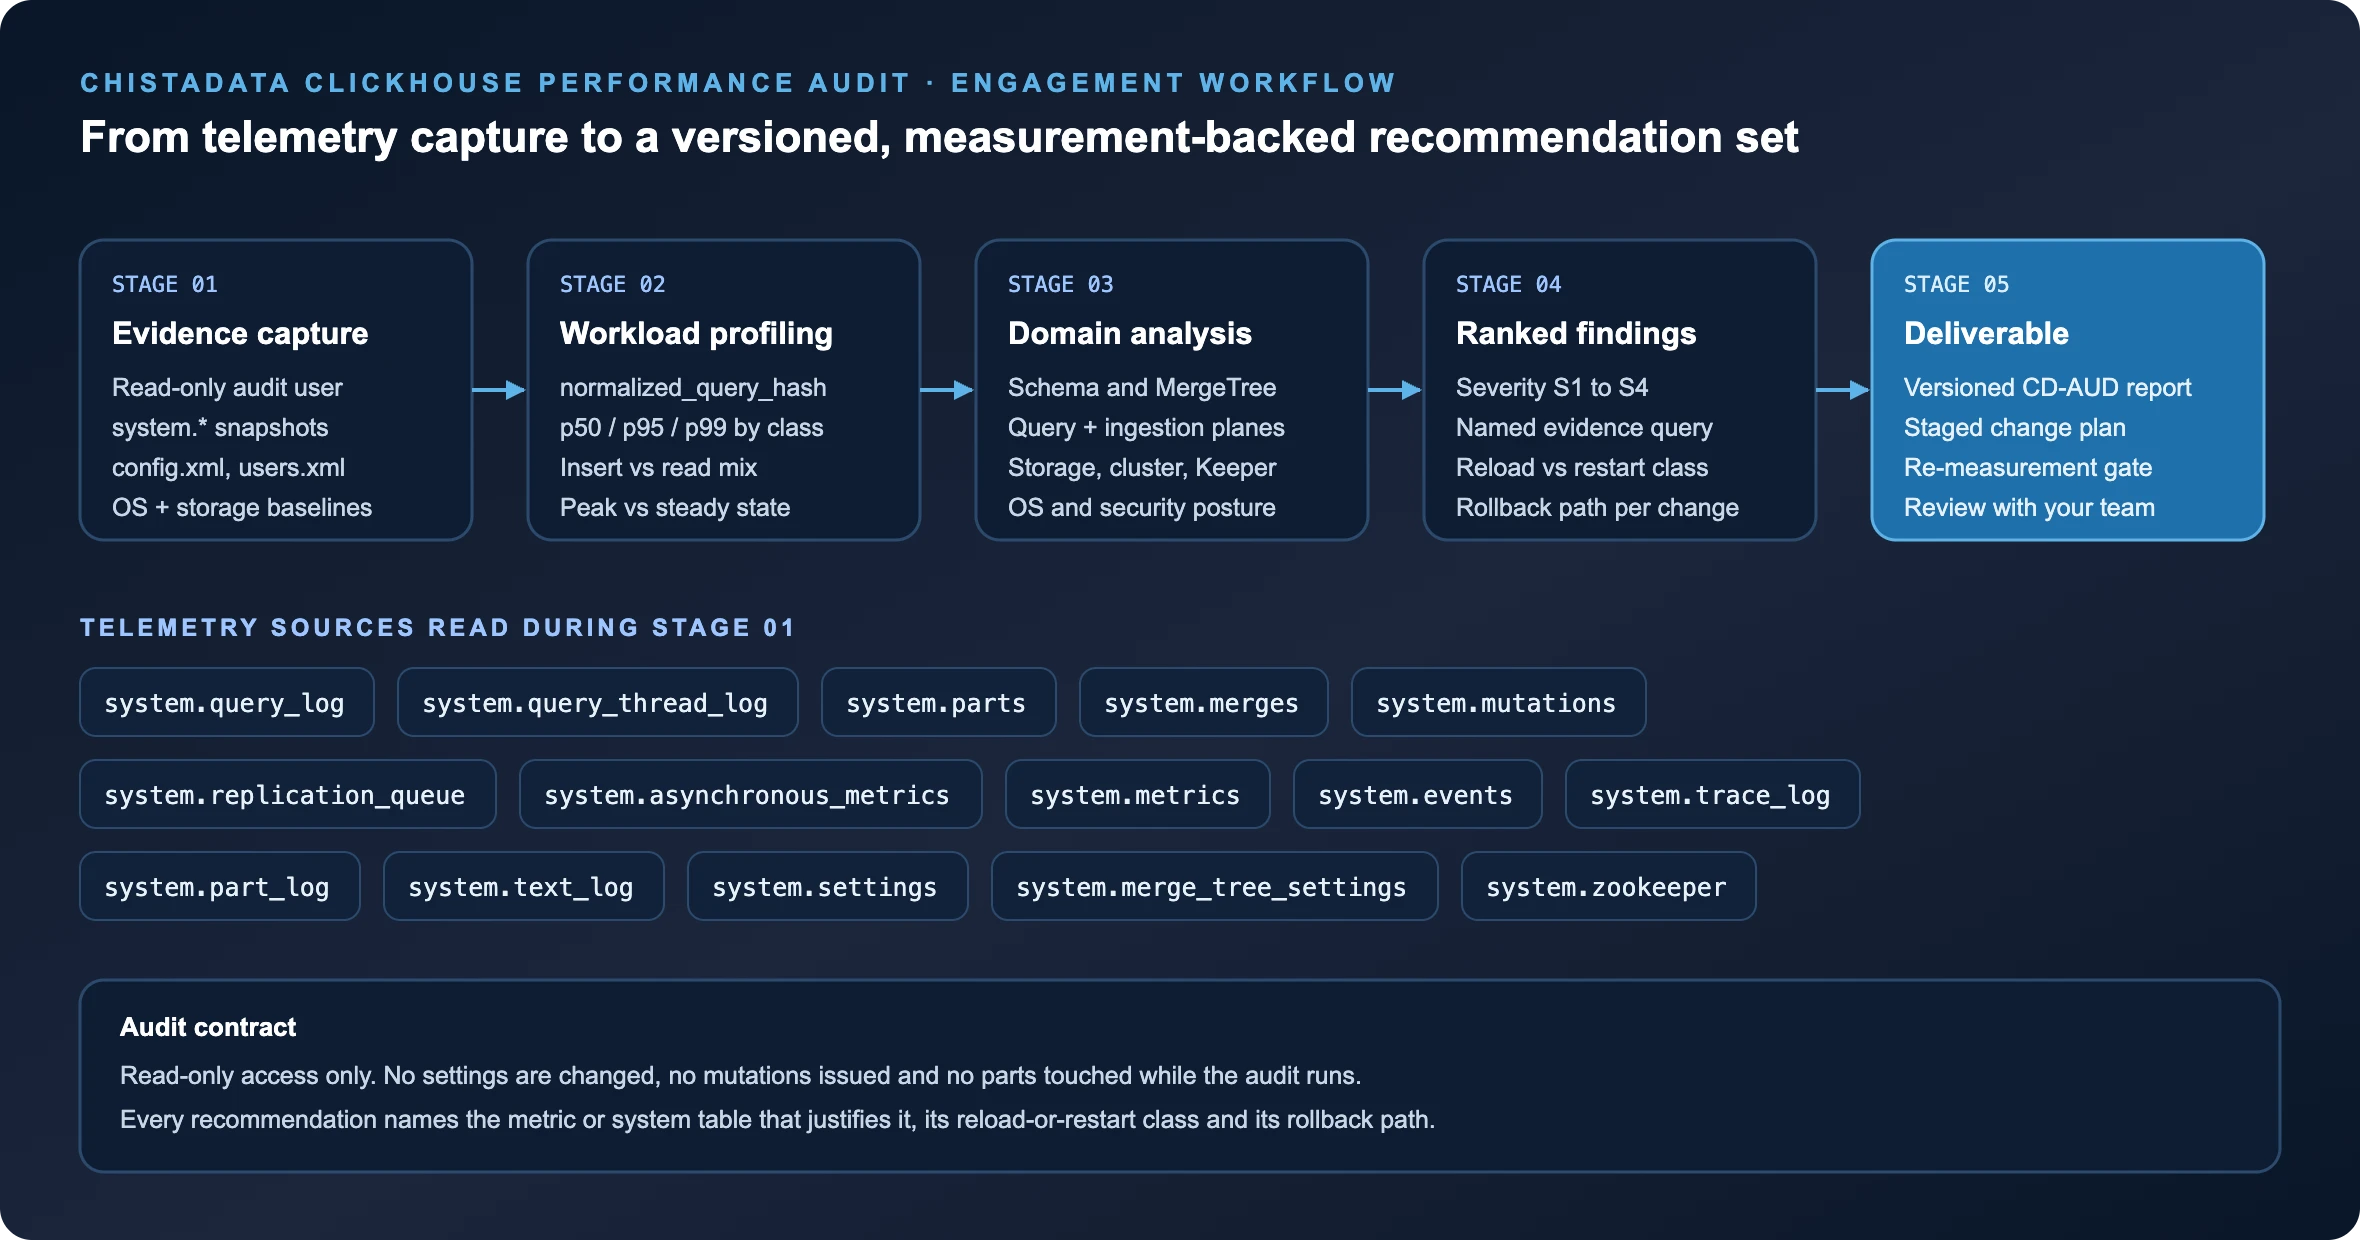
The audit runs in five stages. The first two are about evidence and classification; the third is the analysis itself; the last two turn analysis into a change plan your team can execute without us in the room.
Stage 1: evidence capture
Every ClickHouse performance audit starts with a read-only audit user and a scripted collection pass over the system.* tables on every node, plus the effective config.xml, users.xml and storage-policy definitions. The capture is repeatable, so a second pass after remediation measures the same things the same way. We also collect OS-level baselines: block device latency, filesystem and mount options, memory pressure and CPU steal where the estate is virtualised.
Stage 2: workload profiling
Queries are grouped by normalized_query_hash so that a dashboard fired 40,000 times a day is judged as one class, not 40,000 events. For each class we compute latency percentiles, rows and bytes read against rows returned, peak memory, thread count and the share of total CPU time the class consumes. This is where the ClickHouse performance audit finds the handful of query shapes that dominate the cluster and deserve engineering attention first.
-- Query classes ranked by total CPU seconds over the last 7 days
SELECT
 normalized_query_hash,
 any(query)                                             AS sample_query,
 count()                                                AS executions,
 quantile(0.95)(query_duration_ms)                      AS p95_ms,
 quantile(0.99)(query_duration_ms)                      AS p99_ms,
 sum(read_rows)                                         AS read_rows_total,
 sum(result_rows)                                       AS result_rows_total,
 round(sum(read_rows) / greatest(sum(result_rows), 1))  AS read_amplification,
 sum(ProfileEvents['OSCPUVirtualTimeMicroseconds']) / 1e6 AS cpu_seconds,
 max(memory_usage)                                      AS peak_memory_bytes
FROM system.query_log
WHERE type = 'QueryFinish'
 AND event_time >= now() - INTERVAL 7 DAY
 AND query_kind = 'Select'
GROUP BY normalized_query_hash
ORDER BY cpu_seconds DESC
LIMIT 25;
Stage 3: nine-domain analysis
Each domain of the ClickHouse performance audit in the scope table above is worked independently by an engineer who owns that plane, then reconciled so that a schema recommendation and an ingestion recommendation do not contradict each other. Every observation is tied to the query or system table that produced it.
Stage 4: ranked findings
ClickHouse performance audit findings are ranked by measured impact on the workload classes from stage 2, not by how interesting they are. A missing skip index on a table nobody queries is noted and de-prioritised; a sort key that forces full-part scans on the top query class is an S1.
Stage 5: deliverable and re-measurement gate
The ClickHouse performance audit report is issued under a CD-AUD document ID, walked through with your team, and followed by a re-measurement of the stage 2 baseline once the agreed changes are applied. The audit is not finished until the numbers move.
Query plane
Where a SELECT spends its time in the MergeTree read path
Most ClickHouse performance audit findings on the query plane reduce to one question: how many granules did the engine read to produce the rows it returned? The read path below shows where that number is decided, and where we measure it.
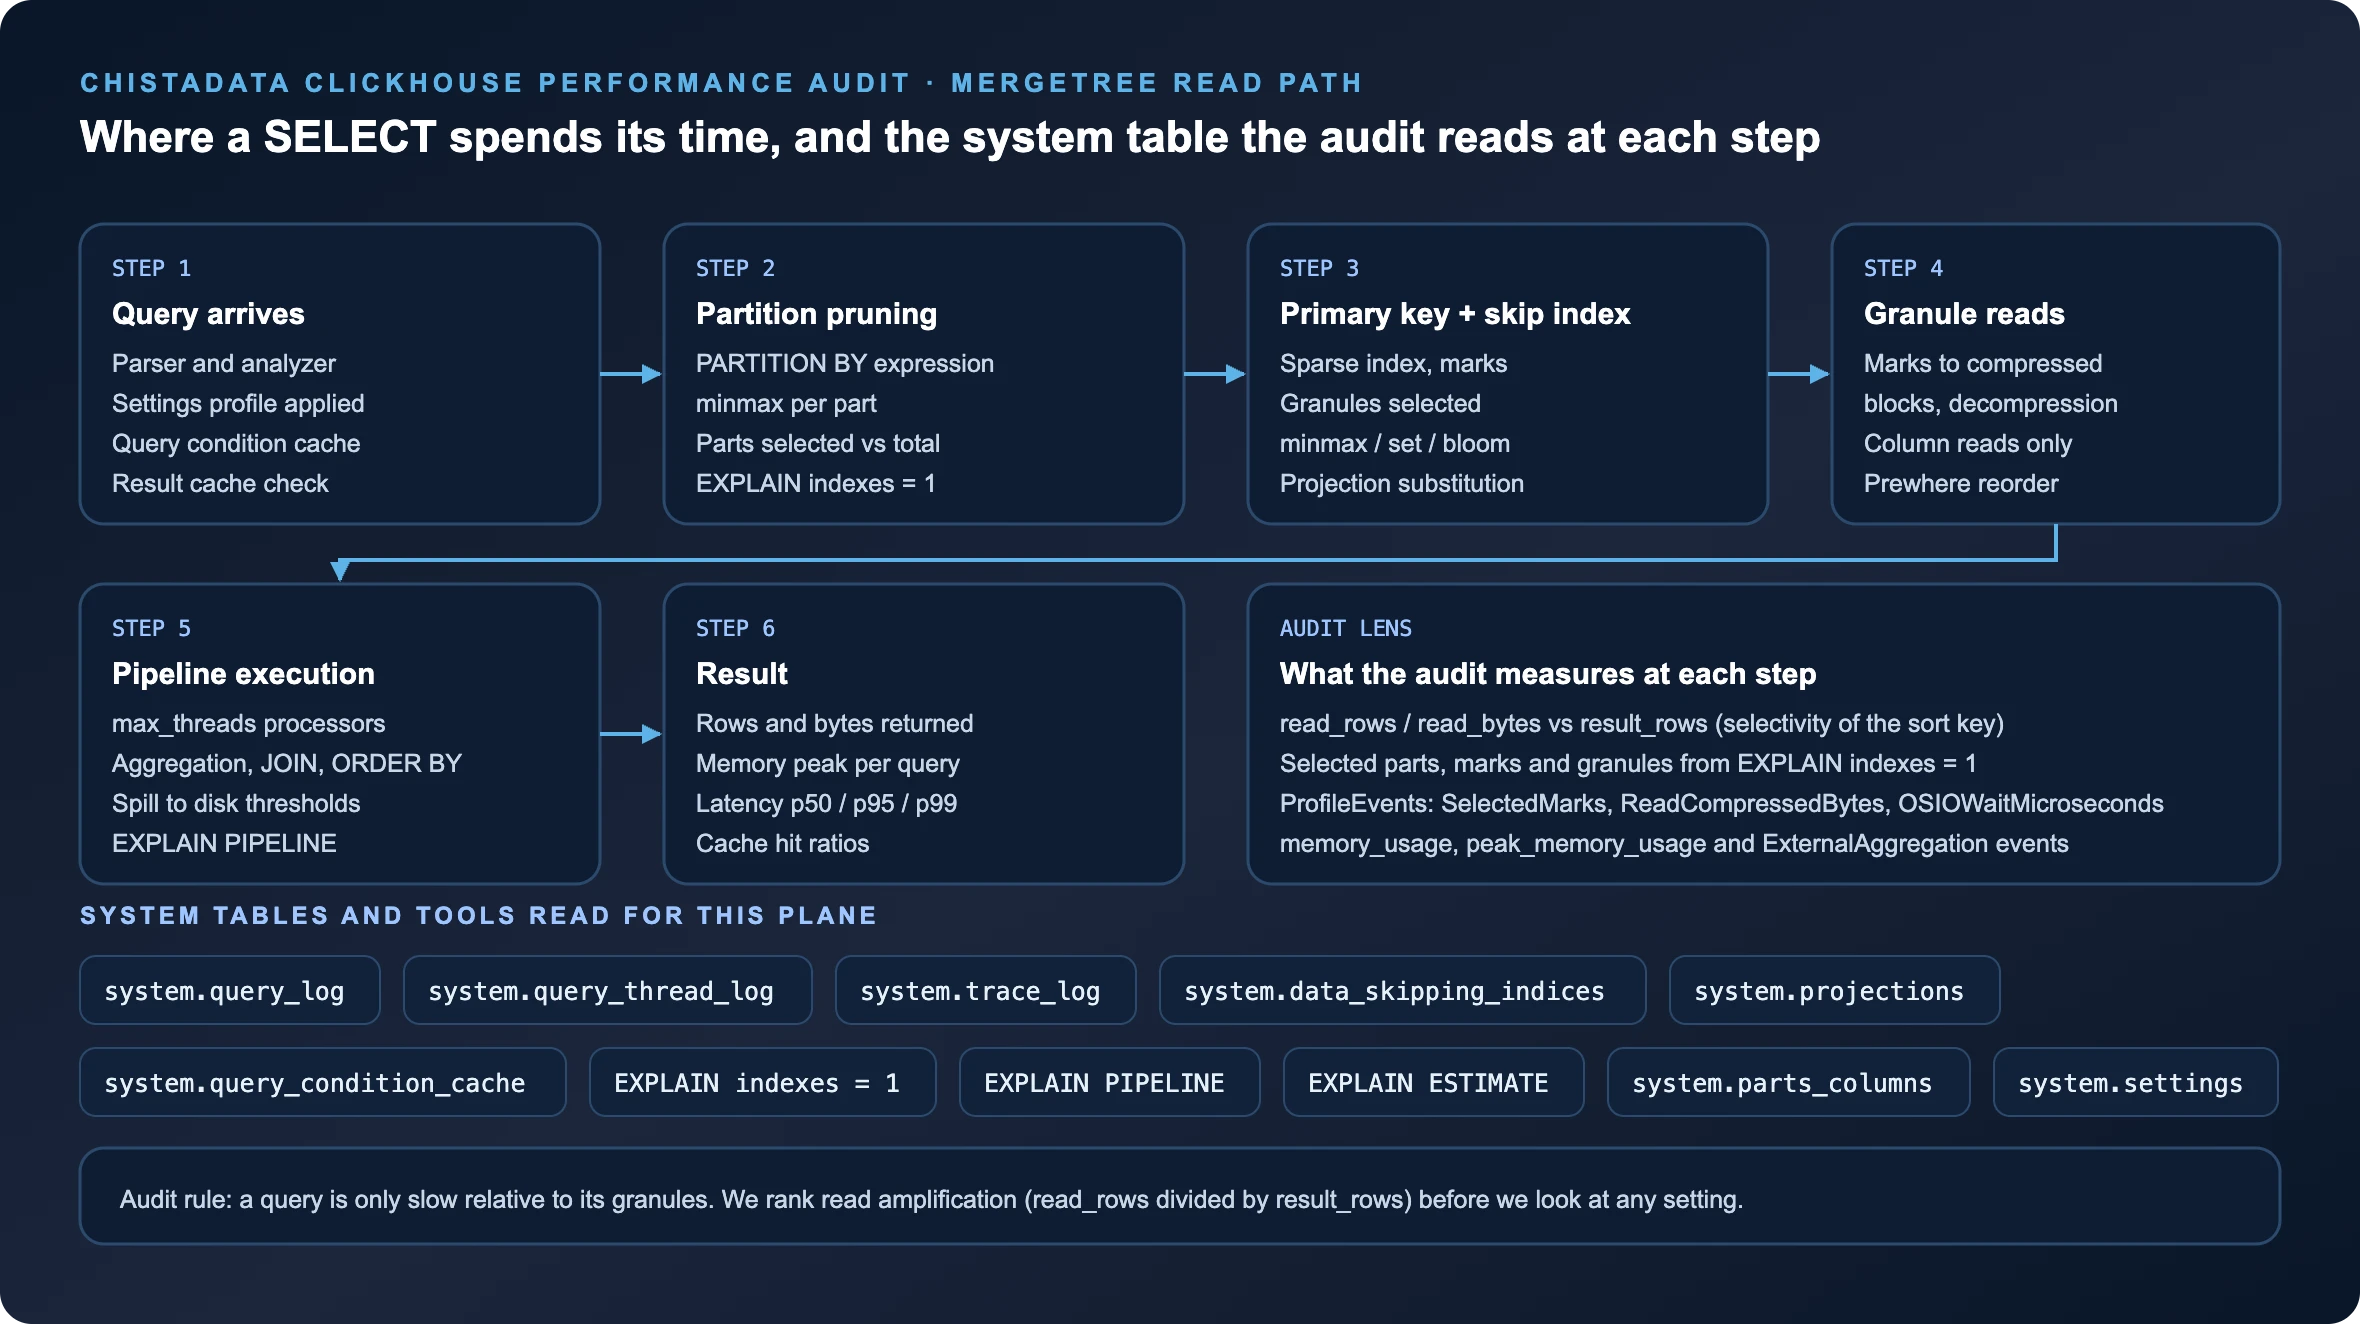
Partition pruning is the coarsest filter, and the first thing the ClickHouse performance audit checks on the query plane. If the PARTITION BY expression does not match the predicate shape of the dominant query classes, every query touches every part. Primary key selection comes next: the sparse index is only useful when the leading ORDER BY columns are the ones the workload filters on, at low-to-high cardinality. Data-skipping indexes (minmax, set, bloom_filter, tokenbf_v1, ngrambf_v1) are evaluated after the primary key and only help when the indexed column is correlated with the sort order at granule scale. Projections can substitute an entirely different sort order for a query class; the audit checks whether they are actually chosen.
We verify all of this with EXPLAIN indexes = 1 on the top query classes, which reports parts and granules before and after each index stage, and we cross-check with the ProfileEvents recorded in system.query_log for the same queries in production.
-- Does the primary key prune? Compare selected granules to total granules.
EXPLAIN indexes = 1
SELECT count()
FROM events_local
WHERE event_date >= today() - 7
 AND tenant_id = 4711
 AND event_type = 'purchase';  -- Read amplification per query class in production, last 24 h
SELECT
 normalized_query_hash,
 sum(ProfileEvents['SelectedParts'])     AS selected_parts,
 sum(ProfileEvents['SelectedMarks'])     AS selected_marks,
 sum(ProfileEvents['SelectedRows'])      AS selected_rows,
 sum(result_rows)                        AS result_rows,
 round(selected_rows / greatest(result_rows, 1)) AS amplification
FROM system.query_log
WHERE type = 'QueryFinish'
 AND event_time >= now() - INTERVAL 1 DAY
GROUP BY normalized_query_hash
ORDER BY selected_marks DESC
LIMIT 20;
Beyond index selection, the query plane of the ClickHouse performance audit covers PREWHERE placement, JOIN algorithm choice and right-table size against max_bytes_in_join, aggregation memory and whether max_bytes_before_external_group_by is spilling silently, max_threads against available cores, and the effect of the query condition cache and query result cache on repeated dashboard traffic. EXPLAIN PIPELINE tells us how many processors each stage actually ran with, which is frequently fewer than the setting implies.
Schema and MergeTree layout
Sort keys, partitions, types and codecs under the ClickHouse performance audit
A schema decision made at table creation determines the ceiling on every query that will ever touch the table. This part of the ClickHouse performance audit reads the physical layout as ClickHouse actually stores it, not as the DDL implies.
ORDER BY and PRIMARY KEY
Column order against the filter predicates of the top query classes; cardinality progression; whether a separate PRIMARY KEY prefix would shrink the index; whether ReplacingMergeTree or AggregatingMergeTree semantics depend on a key that does not match the deduplication intent.
PARTITION BY
Partition count and part count per partition from system.parts; whether partitions are too fine for merges to consolidate (parts never merge across partitions) or too coarse for TTL and DROP PARTITION to be useful; alignment with retention policy.
Column types and encodings
Nullable columns that add a null-map read on every access; String columns that should be LowCardinality(String) or an Enum; oversized integer and float widths; DateTime64 precision that the workload never uses; codec choice (Delta, DoubleDelta, Gorilla, T64, ZSTD levels) measured by compression ratio in system.parts_columns.
Granularity, projections and TTL
index_granularity and adaptive granularity against row width; projections that are defined but never selected; materialized views whose target table has a sort key inconsistent with the queries they were built to serve; TTL expressions that trigger rewrite-heavy merges at the wrong time of day.
-- Compression ratio and on-disk size per column: finds the columns worth re-encoding
SELECT
 database,
 table,
 column,
 type,
 formatReadableSize(sum(column_data_compressed_bytes))   AS compressed,
 formatReadableSize(sum(column_data_uncompressed_bytes)) AS uncompressed,
 round(sum(column_data_uncompressed_bytes)
 / greatest(sum(column_data_compressed_bytes), 1), 2) AS ratio,
 any(compression_codec)                                  AS codec
FROM system.parts_columns
WHERE active
 AND database NOT IN ('system', 'INFORMATION_SCHEMA', 'information_schema')
GROUP BY database, table, column, type
ORDER BY sum(column_data_compressed_bytes) DESC
LIMIT 40;
Schema findings from a ClickHouse performance audit are the most valuable and the most expensive to act on, because changing a sort key means rebuilding the table. The report therefore separates changes that can be made in place (codec changes via ALTER TABLE ... MODIFY COLUMN, new skip indexes, new projections) from changes that need a shadow table, a backfill and a cut-over, and gives each its own rollback path. Our MergeTree engineering page goes deeper on the engine family itself.
Ingestion and merges
ClickHouse performance audit of insert shape, part count and merge throughput
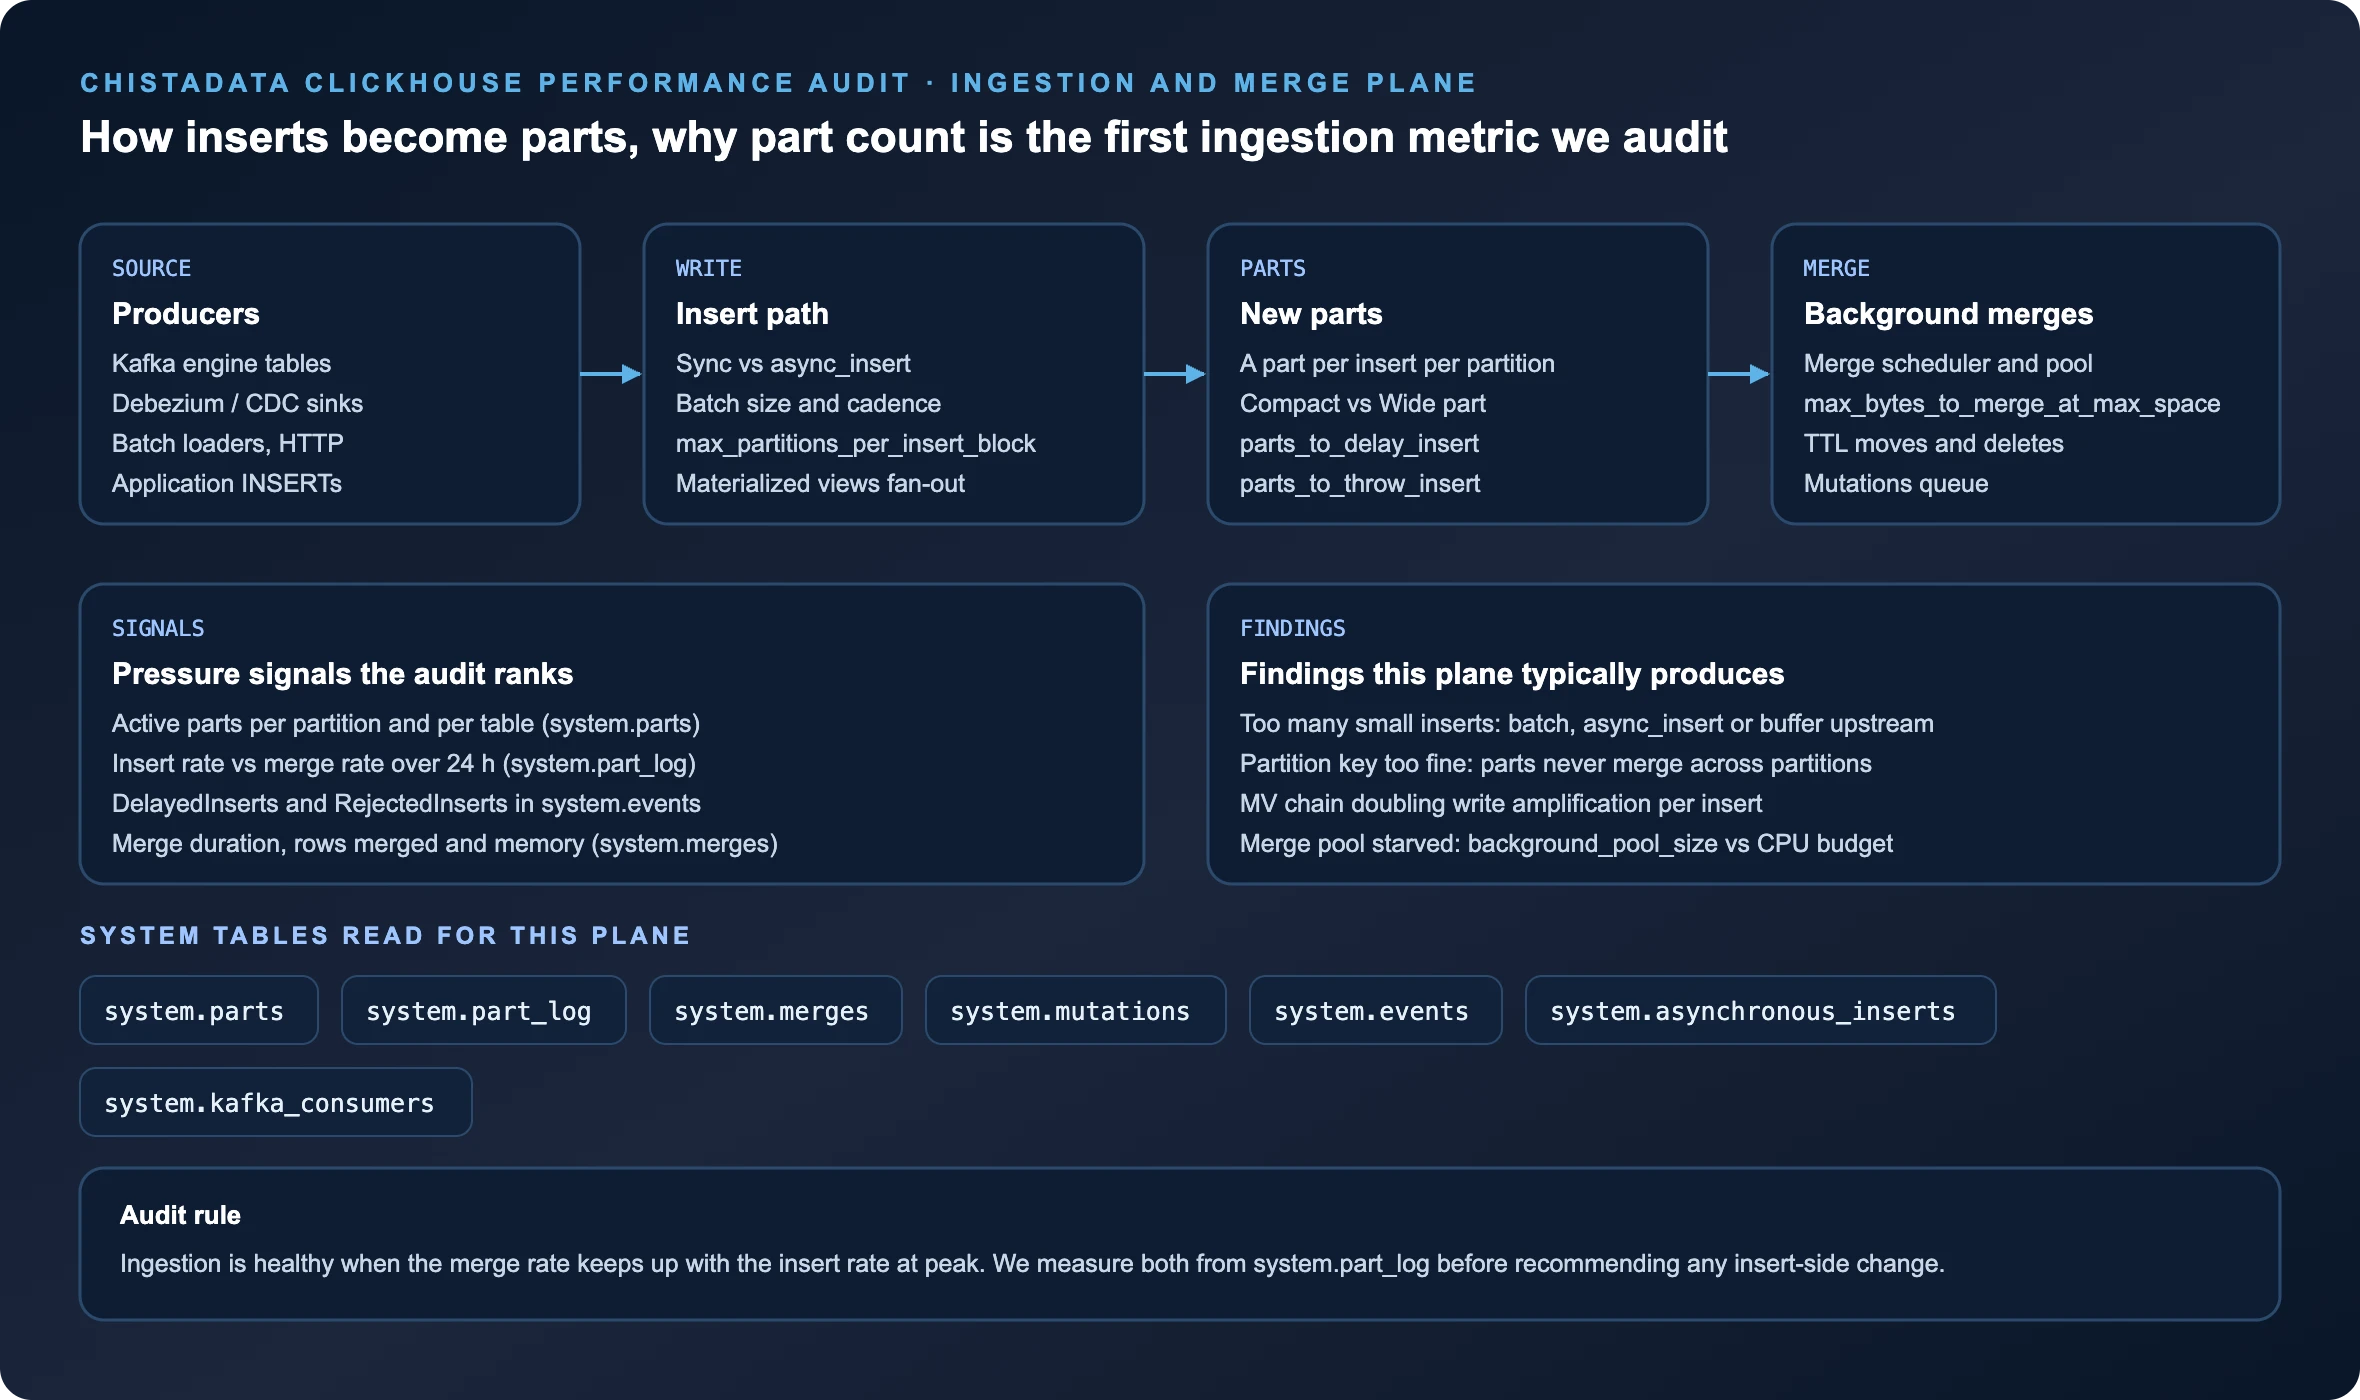
Every insert creates at least one part per partition it touches, and background merges are the only thing that consolidates them. The ingestion half of the ClickHouse performance audit measures whether merges keep up with inserts at peak, because when they do not, read latency, memory and eventually availability all degrade together.
-- Insert rate versus merge rate per table, hourly, last 24 h
SELECT
 toStartOfHour(event_time)                                   AS hour,
 database,
 table,
 countIf(event_type = 'NewPart')                             AS parts_created,
 countIf(event_type = 'MergeParts')                          AS merges_done,
 sumIf(rows, event_type = 'NewPart')                         AS rows_inserted,
 sumIf(rows, event_type = 'MergeParts')                      AS rows_merged,
 round(avgIf(duration_ms, event_type = 'MergeParts'))        AS avg_merge_ms,
 maxIf(peak_memory_usage, event_type = 'MergeParts')         AS peak_merge_memory
FROM system.part_log
WHERE event_time >= now() - INTERVAL 1 DAY
GROUP BY hour, database, table
ORDER BY hour, parts_created DESC;  -- Active parts per partition: the direct predictor of parts_to_delay_insert pressure
SELECT
 database,
 table,
 partition,
 count()                                        AS active_parts,
 formatReadableSize(sum(bytes_on_disk))         AS on_disk,
 min(min_time)                                  AS oldest_row,
 max(modification_time)                         AS last_modified
FROM system.parts
WHERE active
GROUP BY database, table, partition
ORDER BY active_parts DESC
LIMIT 25;
From these two queries the ClickHouse performance audit derives the findings that matter on this plane: producers inserting small batches at high frequency (fix upstream, via async_insert with wait_for_async_insert, or with a Buffer table where appropriate); a partition key so fine that merges have nothing to consolidate; a materialized-view chain that multiplies write amplification on every insert; a merge pool starved by background_pool_size or by merges that exceed max_bytes_to_merge_at_max_space_in_pool; and mutation backlogs in system.mutations that block merges on the same parts. Kafka-engine and CDC pipelines are reviewed through system.kafka_consumers and the consumer-group lag on the broker side, since the two disagree more often than teams expect.
ClickHouse performance audit ingestion recommendations are always staged: batch size first, then async-insert settings, then merge settings, each with a re-measurement of the hourly query above before the next step.
Cluster, replication and Keeper
Topology checks that decide whether the cluster scales or only gets bigger
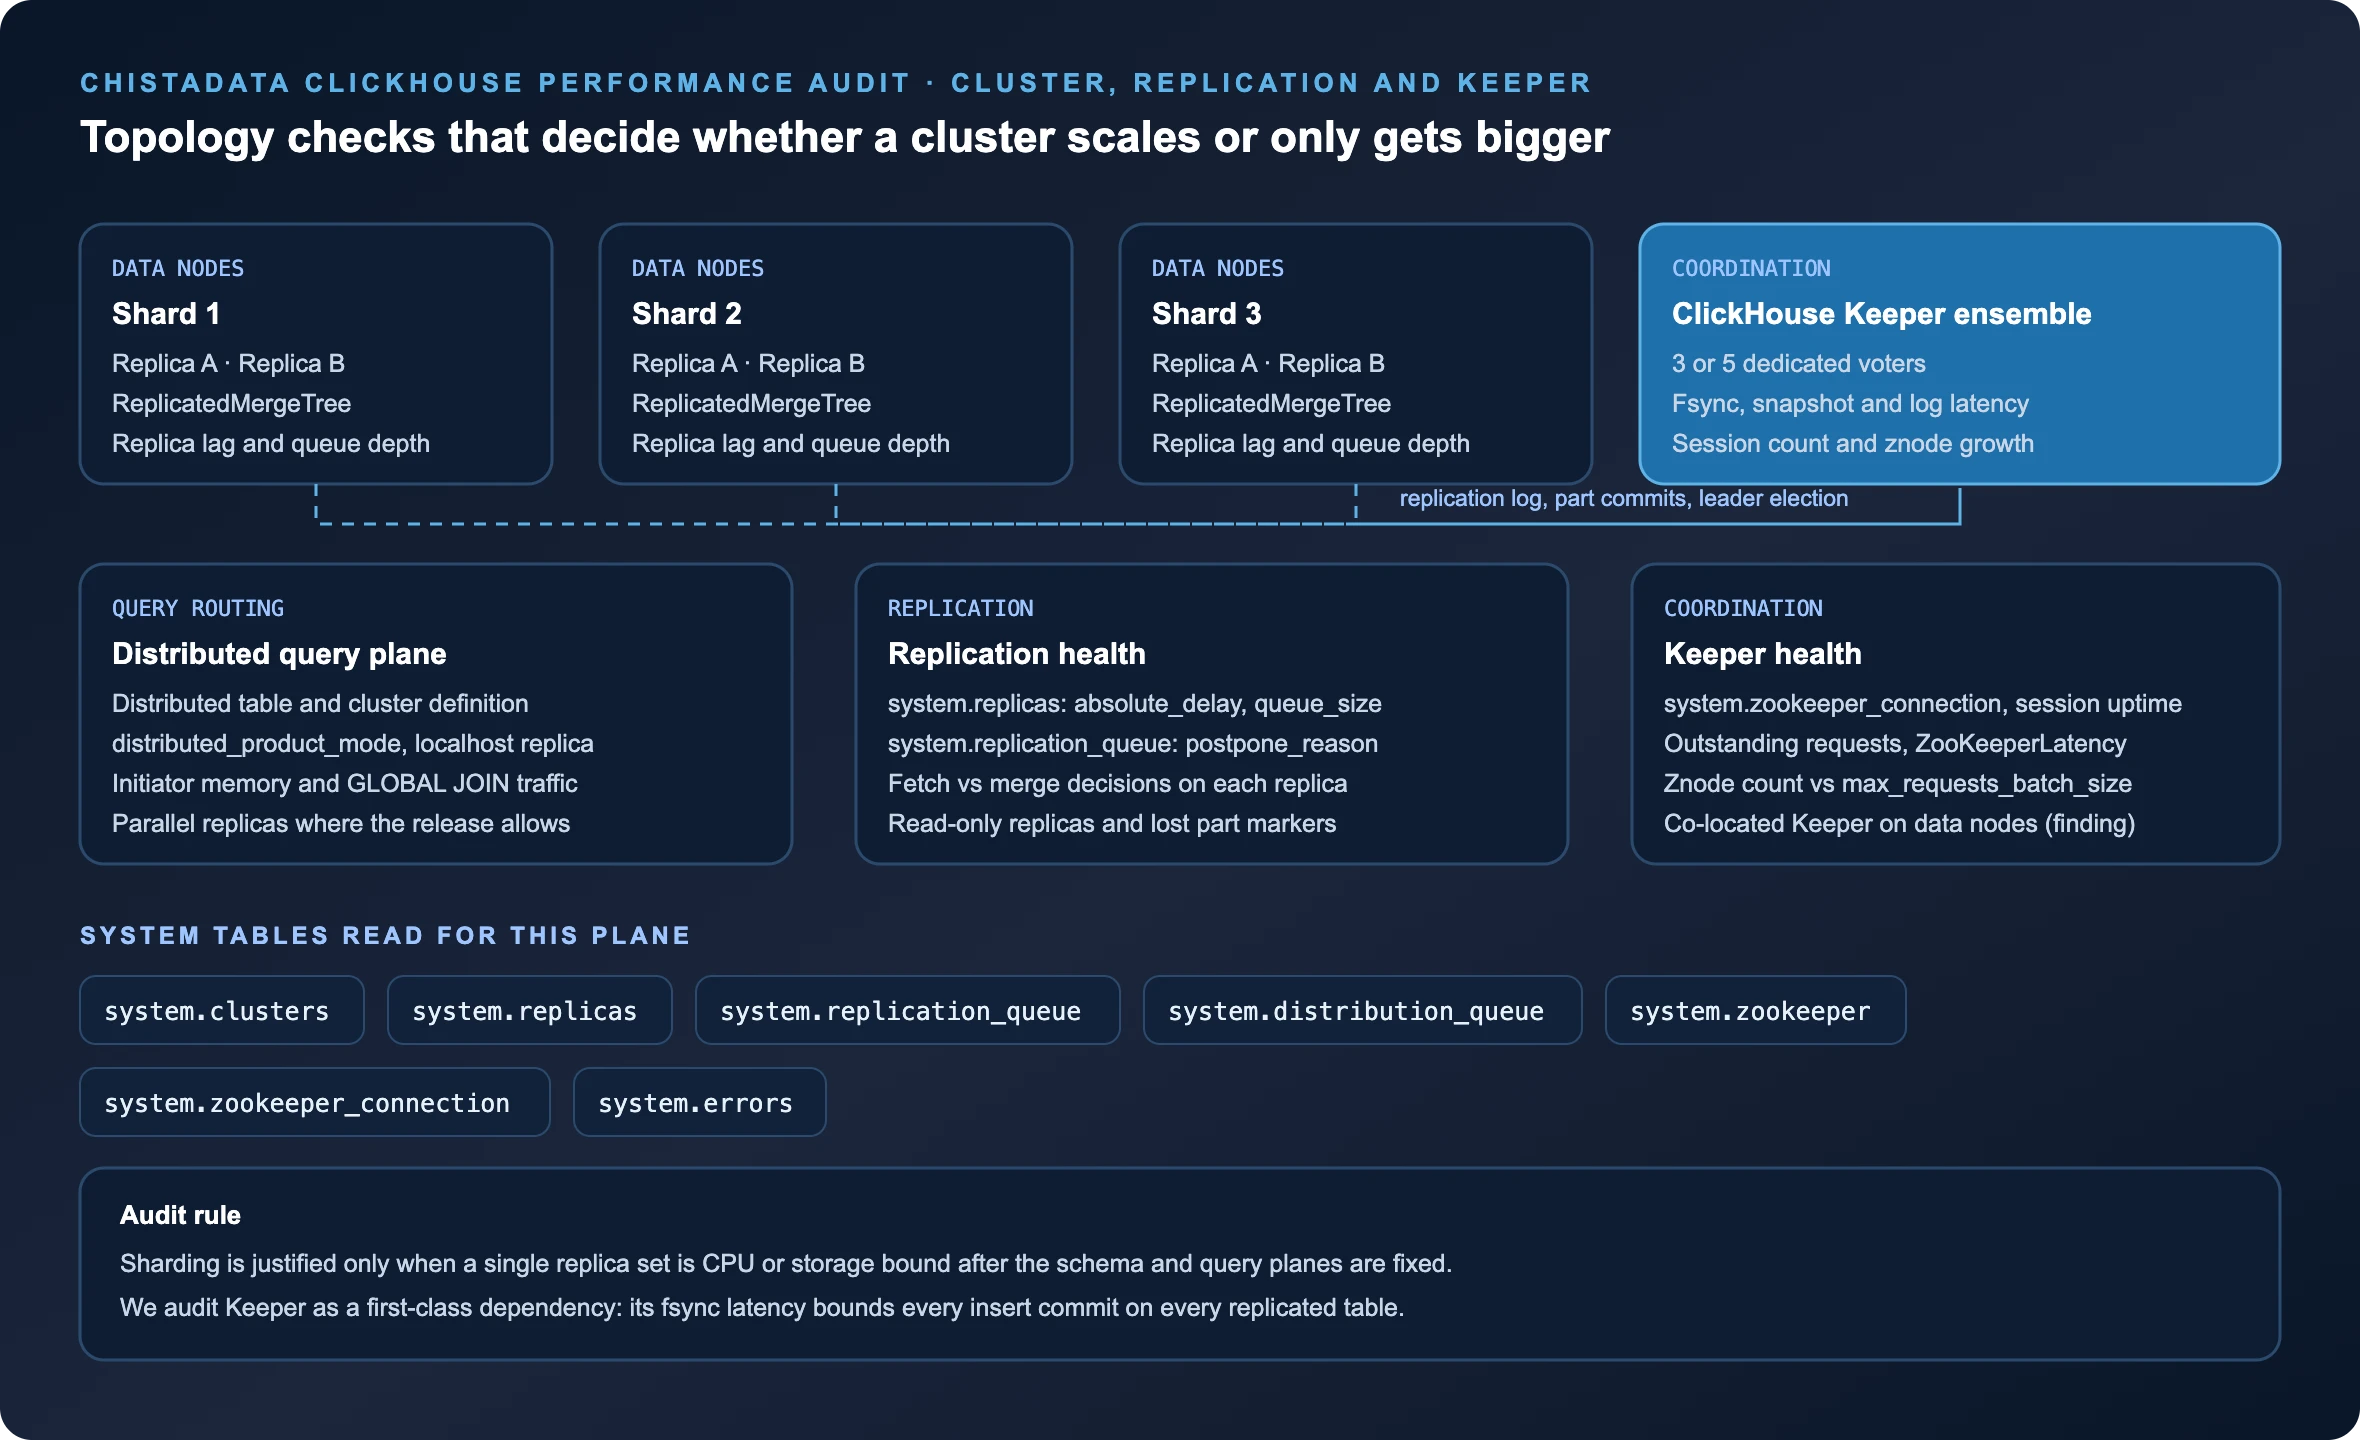
Adding shards to a cluster whose schema and query planes are wrong adds cost without adding throughput. The ClickHouse performance audit treats sharding, replication and ClickHouse Keeper as a single plane, because a slow Keeper fsync bounds every insert commit on every replicated table in the estate.
-- Replication health across the estate (run ON CLUSTER or per node)
SELECT
 database,
 table,
 replica_name,
 is_leader,
 is_readonly,
 absolute_delay,
 queue_size,
 inserts_in_queue,
 merges_in_queue,
 log_max_index - log_pointer          AS log_lag,
 total_replicas,
 active_replicas
FROM system.replicas
WHERE absolute_delay > 30
 OR queue_size > 100
 OR is_readonly
ORDER BY absolute_delay DESC;  -- Why replication tasks are being postponed
SELECT
 database,
 table,
 type,
 num_postponed,
 postpone_reason,
 last_exception
FROM system.replication_queue
WHERE num_postponed > 0
ORDER BY num_postponed DESC
LIMIT 20;
On the distributed query side the ClickHouse performance audit examines how Distributed tables route reads (prefer_localhost_replica, load_balancing), what distributed_product_mode does to JOINs across shards, how much data GLOBAL JOIN and GLOBAL IN pull to the initiator, and whether the release in use supports parallel replicas well enough to run read-scale-out without adding shards. On the Keeper side we check that the ensemble is on dedicated hosts with fast fsync storage, that its snapshot and log latency stay flat under insert peaks, and that session count and znode growth are bounded. A Keeper co-located with data nodes is a finding in every ClickHouse performance audit where it is present.
Where the estate is already sharded, the ClickHouse performance audit also verifies that the sharding key produces even part distribution and that resharding, if recommended, is scoped as a migration project with its own runbook rather than a line item in the audit.
Storage, memory, OS and configuration
ClickHouse performance audit of the layer underneath the engine
ClickHouse is sensitive to the machine it runs on in ways that only show up under load. The last three domains of the ClickHouse performance audit read the storage, memory and kernel configuration and compare them with what the workload profile demands.
move_factor, TTL moves to cold tiers, S3 or object-storage cache sizing and hit ratio, and whether hot data is actually on the hot volume, from system.disks, system.storage_policies and system.parts.disk_name.system.asynchronous_metrics and system.events; whether the cache budget matches the working set of the top query classes.max_memory_usage, max_memory_usage_for_user, max_server_memory_usage_to_ram_ratio, max_concurrent_queries; how often queries hit MEMORY_LIMIT_EXCEEDED in system.query_log and system.errors.ulimit for open files and processes, all compared against ClickHouse’s own recommendations for the release in use.config.xml, users.xml and profile setting that differs from the default, with the reason if known and the effect measured; settings inherited from an earlier release that no longer do what they once did.default user is still reachable from the network.-- Cache effectiveness and memory pressure snapshot
SELECT metric, value
FROM system.asynchronous_metrics
WHERE metric IN (
'MarkCacheBytes', 'MarkCacheFiles',
'UncompressedCacheBytes', 'UncompressedCacheCells',
'MemoryResident', 'OSMemoryAvailable', 'OSMemoryTotal',
'ReplicasMaxAbsoluteDelay', 'ReplicasSumQueueSize',
'MaxPartCountForPartition'
)
ORDER BY metric; SELECT event, value
FROM system.events
WHERE event IN ('MarkCacheHits', 'MarkCacheMisses',
'UncompressedCacheHits', 'UncompressedCacheMisses',
'QueryCacheHits', 'QueryCacheMisses',
'DelayedInserts', 'RejectedInserts',
'OSIOWaitMicroseconds', 'OSCPUWaitMicroseconds')
ORDER BY event;Findings model
How ClickHouse performance audit findings are ranked and written
A finding is only useful if an engineer who was not in the room can act on it safely. Every finding in the report carries the same seven fields.
| Field | What it contains |
|---|---|
| Severity | S1 to S4 on the same scale as our support SLAs: S1 is degrading the top workload class or threatening availability now; S4 is hygiene. |
| Evidence | The exact query against the named system table, and the output captured during the audit, so the finding can be re-verified on demand. |
| Affected workload | Which query classes from the stage 2 profile are affected, and the share of cluster CPU, memory or I/O they represent. |
| Recommendation | The precise setting, DDL or topology change, with current value, proposed value and unit. |
| Change class | Whether the change applies at runtime, needs a config reload, needs a restart, or needs a table rebuild and cut-over; blast radius stated explicitly. |
| Rollback | The reverse operation and the verification query that confirms the estate is back to its pre-change state. |
| Expected effect | The metric that should move, in which direction, and the re-measurement query that proves it. We never quote a percentage improvement we have not measured on your workload. |
Deliverable
What a ClickHouse performance audit delivers, and what happens after the report
Versioned ClickHouse performance audit report
Issued under a CD-AUD-YYYY-MM-TAG document ID with a revision history, an executive summary for engineering leadership, and the full ranked findings with evidence, recommendation, change class, rollback and expected effect.
Staged change plan
Findings grouped into execution waves, ordered so that low-risk runtime changes land first and table rebuilds last, with a verification query after every wave and a stop condition if a metric moves the wrong way.
Evidence pack
The raw ClickHouse performance audit evidence: system.* snapshots, the workload profile tables, the EXPLAIN outputs and the scripts used to collect them, so your team can re-run the same measurement after every change and at the next review.
Review session
A working session with your engineers to walk through the top findings, argue about the ones you disagree with, and confirm the execution order against your release calendar.
Re-measurement gate
After the agreed changes are applied, we re-run the stage 2 profile and report the before-and-after numbers against the same query classes. The audit closes on measured movement, not on delivery of a document.
Optional execution
If you would rather we apply the plan, the same engineers who wrote the findings execute them under a ClickHouse consulting engagement, or as part of ClickHouse managed services with 24×7 coverage.
Standing caveat on every ClickHouse performance audit recommendation we issue: test on a staging cluster with a representative workload before applying to production, and keep a verified backup and a rehearsed restore path in place throughout. Our 24×7 ClickHouse support team is available at S1 15-minute response if a change in the plan needs to be reverted under pressure.
Prerequisites
Access and preparation for a ClickHouse performance audit
The audit needs less than most teams expect: read-only access, a week of retained logs, and a short conversation about what “slow” means to your users.
A read-only audit user
SELECT on the system database and on the application databases, plus SHOW privileges. No ALTER, no INSERT, no KILL. We supply the exact CREATE USER and GRANT statements and the network source we will connect from.
CREATE USER IF NOT EXISTS ${CH_AUDIT_USER}
 IDENTIFIED WITH sha256_password BY '${CH_AUDIT_PASSWORD}'
 HOST IP '${CHISTADATA_SOURCE_CIDR}'
 SETTINGS readonly = 2, max_execution_time = 120;  GRANT SELECT ON system.* TO ${CH_AUDIT_USER};
GRANT SELECT, SHOW ON ${APP_DATABASE}.* TO ${CH_AUDIT_USER};
Log retention
A ClickHouse performance audit needs system.query_log, system.part_log and system.query_thread_log enabled with at least seven days of retention that includes a business peak. If they are not enabled, we help you switch them on (a config change, no restart) and schedule the audit after a full week of capture.
Topology and release facts
The exact ClickHouse server version on every node, the Keeper version and placement, the cluster definition, the storage policy, and whether the estate is self-managed, on Kubernetes, or on ClickHouse Cloud, since several system tables and settings differ between them.
A definition of slow
The three to five query classes or pipelines your users complain about, the latency or throughput they need, and the business window in which it matters. The audit ranks findings against this, so the more concrete it is, the more useful the report.
Release coverage for audit, consulting and support engagements is maintained in one place and shown below.
Release coverage: ChistaDATA delivers consulting, 24×7 support, managed services and remote DBA on ClickHouse 26.9 (latest stable release, September 2026), 26.8 LTS (current long-term-support release, August 2026, supported to August 2027) and 26.3 LTS (supported to March 2027), plus every supported stable release in between, with upgrade engineering for 24.x and 25.x estates, including 25.8 LTS, which reached end of support in August 2026. Last verified October 2026.
FAQ
ClickHouse performance audit: frequently asked questions
How long does a ClickHouse performance audit take?
Evidence capture and workload profiling take two to three working days once access is in place. Analysis, ranking and report writing typically take a further five to seven working days for a single cluster, longer for multi-cluster estates. The re-measurement gate runs after your team has applied the agreed changes, on your schedule.
Does a ClickHouse performance audit change anything on our cluster?
No. The ClickHouse performance audit user has SELECT-only grants and readonly = 2. No settings are changed, no mutations are issued and no parts are touched. If a finding is urgent enough to need immediate action, we tell you, and any change is executed by your team or under a separate support or consulting engagement with its own change gate.
Which ClickHouse versions and deployments does the ClickHouse performance audit cover?
Self-managed ClickHouse on bare metal, virtual machines and Kubernetes, and ClickHouse Cloud, across all supported LTS and stable releases shown in the release coverage line above. Findings are version-pinned where behaviour differs between releases, and upgrade recommendations are given their own change class and runbook.
Can you audit a ClickHouse Cloud deployment?
Yes, with the caveat that SharedMergeTree, the absence of Keeper as a user-visible component, and the restricted config.xml surface change which domains apply. The query, schema and ingestion planes are audited exactly as for self-managed clusters; the cluster and OS planes are replaced by a review of service sizing, scaling policy and cost against measured utilisation.
Will the ClickHouse performance audit report quote a percentage improvement?
Only after re-measurement on your workload. The report states the metric each finding should move and the query that proves it. We do not publish projected percentages, because they are not evidence.
How does a ClickHouse performance audit relate to consulting and support?
The ClickHouse performance audit is a bounded, read-only review. Executing the change plan can be done by your team from the report alone, under a consulting engagement, or as part of managed services. Many teams run the audit first to decide which of those they need.
What do we need to prepare before the ClickHouse performance audit starts?
A read-only audit user, at least seven days of system.query_log and system.part_log retention including a business peak, the cluster and release facts listed in the prerequisites section, and a short written description of the query classes or pipelines that matter most to your users.
Next step
Commission a ClickHouse performance audit
Tell us which query classes or pipelines are slow, how the cluster is deployed and which release it runs, and we will scope the ClickHouse performance audit around it. We send the access statements and schedule evidence capture around your next business peak.
Reference: the official ClickHouse documentation for system.query_log and system.parts describes every column the audit queries rely on.