Columnar databases · Row-based databases · Lab-measured at one billion rows
Columnar databases answered a one-billion-row aggregate by reading 1.03 GB. A row store would have read 80 GB.
Columnar databases store each column in its own contiguous file, so a query pays only for the columns it names. Row-based databases store whole records together, so every scan pays for every column. We measured what that single design decision means at scale: one billion rows in ClickHouse 26.7, fifty million rows in PostgreSQL 16 on the same host, and a twenty-million-row head-to-head on identical data.
Rows aggregated
3.34 s on 2 vCPUs, about 300 million rows per second
Bytes read
985 MiB of a 14.06 GiB table
Primary index
29.9 KiB in memory for the whole table
Architecture
What columnar databases and row-based databases actually put on disk
Every performance difference between columnar databases and row-based databases traces back to the physical layout. The engines are not faster or slower in general; they are organised around different units of I/O.
A row store keeps each record whole. In PostgreSQL the unit is the 8 KB heap page: a page header, an array of line pointers, and tuples packed from the end of the page backwards. Each tuple carries a 23-byte header (xmin, xmax, infomask, null bitmap) followed by every column value in declaration order. In our 50-million-row lab table, eight modest columns cost 80.3 bytes per row once headers, alignment and page overhead are included, and the heap filled 489,887 pages.
Columnar databases break the same record apart. A ClickHouse MergeTree part holds one .bin file per column with that column’s values back to back, compressed in blocks with the default LZ4 codec. A marks file maps every 8,192-row granule to its byte offset, and primary.idx holds one sort-key value per granule. That sparse design is why the primary index for one billion rows measured just 29.9 KiB in memory, while the PostgreSQL B-tree on order_id measured 1.12 GB for fifty million rows, which projects to about 22.5 GB at one billion.

When a query needs two columns out of eight, or two out of two hundred, the row store still pulls whole pages through its buffer manager, because the page is the unit of I/O and the row is the unit of storage. Columnar databases open two files and leave the rest untouched. Everything measured below is a consequence of this picture.
Methodology
The lab: three tiers, two engines, one host
Comparisons of columnar databases and row-based databases usually skip the methodology, which is why their numbers cannot be checked. Every figure on this page comes from one 2-vCPU Intel Xeon host with 7 GB of RAM and a local NVMe-class virtual disk, running Ubuntu 24.04. Nothing was tuned for either engine beyond what is listed.
| Tier | Engine and version | Rows | Schema | Purpose |
|---|---|---|---|---|
| A · Billion | ClickHouse 26.7.2.1 (chDB 4.4.0), MergeTree | 1,000,000,000 | 8 columns, PARTITION BY toYYYYMM(sale_date), ORDER BY (sale_date, product_id, order_id) | Scale behaviour of columnar databases |
| B · Row store at scale | PostgreSQL 16.13 heap, B-tree PK, BRIN on sale_date | 50,000,000 | Same 8 columns and distributions | Per-row cost of row-based databases, projected linearly to one billion |
| C · Head-to-head | PostgreSQL 16.13 and ClickHouse 26.7 on identical data | 20,000,000 | 12 columns including three wide text columns | Like-for-like plans, compression codecs and the write path |
Table 1. Lab tiers. PostgreSQL ran with shared_buffers = 1536MB, work_mem = 64MB, track_io_timing = on; ClickHouse ran with max_threads = 2 and default settings. Warm cache, median of at least three timed runs.
Two honest caveats shape the numbers. First, the generators derive customer_id, product_id, quantity and unit_price from hash functions, so they are close to uniformly random. Real sales data has skew and repetition that compress far better, so our compression ratios are a floor for columnar databases. Second, the Tier B table was created UNLOGGED to fit the sandbox disk. That removes WAL writes but does not change the heap layout or the read path, and every read measurement comes from it; write measurements come from Tier C, which was fully logged.
Tier A results
Columnar databases at one billion rows: what we measured
One billion rows loaded in 296 seconds, about 3.4 million rows per second including data generation, then compacted to one part per month. These are the headline measurements.
| Measurement | ClickHouse 26.7, 1 B rows | PostgreSQL 16, 50 M rows measured | PostgreSQL projected to 1 B rows |
|---|---|---|---|
| Table size on disk | 14.06 GiB (27.01 GiB uncompressed) | 4.01 GB heap + 1.12 GB PK | ≈ 80.3 GB heap + ≈ 22.5 GB PK |
| Top-5 products by units (2 columns) | 3.34 s, 985 MiB read | 9.11 s serial · 5.21 s with 2 workers, 3.83 GB read | ≈ 104 s with 2 workers, ≈ 80 GB read |
| Revenue by region, all rows (3 columns) | 8.39 s | not run at this tier | not projected |
| Revenue by region, one month | 205 ms, 2,592 granules | 3.40 s seq scan · 561 ms with BRIN | ≈ 11 s with BRIN (21 M rows in range) |
Point lookup by order_id | 5 ms warm, 2,509 granules | 0.16 ms, 8 buffers | ≈ 0.2 ms (B-tree depth grows by one level at most) |
| Single-row update | 7.31 s mutation, 296 MiB part rewritten | see Tier C: 0.65 ms logged | unchanged: index lookup plus one tuple |
Table 2. Projections multiply the measured 50-million-row cost by 20 and assume the heap still fits in cache, which it would not on this host. Real one-billion-row scans on a row store would be slower still, bounded by storage bandwidth.
Read the table as two stories. For queries that read many rows and few columns, columnar databases turn a problem measured in tens of gigabytes into one measured in hundreds of megabytes. For queries that touch one row, the row store wins by an order of magnitude or more, and no amount of hardware changes that. The rest of this page explains each mechanism behind those numbers.
Mechanism 1
Columnar databases read only the columns a query names
The canonical analytical query, and the one columnar databases were built for: units sold per product, top five. It touches two columns, product_id (4 bytes) and quantity (1 to 2 bytes). PostgreSQL has to read every page of the heap to extract them.
SQL · PostgreSQL 16 · 50 M rows · EXPLAIN (ANALYZE, BUFFERS)
EXPLAIN (ANALYZE, BUFFERS, COSTS OFF)
SELECT product_id, SUM(quantity) AS units
FROM sales_50m
GROUP BY product_id
ORDER BY units DESC
LIMIT 5;

Limit (actual time=12769.799..12769.803 rows=5 loops=1)
  Buffers: shared hit=196197 read=293693
  -> Sort  (top-N heapsort, Memory: 25kB)
     -> HashAggregate (rows=5000, Memory Usage: 721kB)
        -> Seq Scan on sales_50m (actual time=0.050..4144.812 rows=50000000 loops=1)
              Buffers: shared hit=196194 read=293693
Execution Time: 12770.783 ms   -- median of 3 timed runs without EXPLAIN: 9.11 s serial, 5.21 s with 2 workers
SQL · ClickHouse 26.7 · 1 B rows · what the same query reads
EXPLAIN ESTIMATE
SELECT product_id, sum(quantity) FROM lab.sales_1b GROUP BY product_id;
-- parts: 48 | rows: 1,000,000,000 | marks: 122,088

SELECT column, formatReadableSize(sum(column_data_compressed_bytes)) AS on_disk
FROM system.parts_columns
WHERE database = 'lab' AND table = 'sales_1b' AND active
  AND column IN ('product_id', 'quantity')
GROUP BY column;
-- product_id  48.52 MiB
-- quantity   936.93 MiB          total read: 985 MiB for 1,000,000,000 rows

SELECT product_id, sum(quantity) AS units
FROM lab.sales_1b
GROUP BY product_id ORDER BY units DESC LIMIT 5
SETTINGS max_threads = 2;
-- median of 3 runs: 3.34 s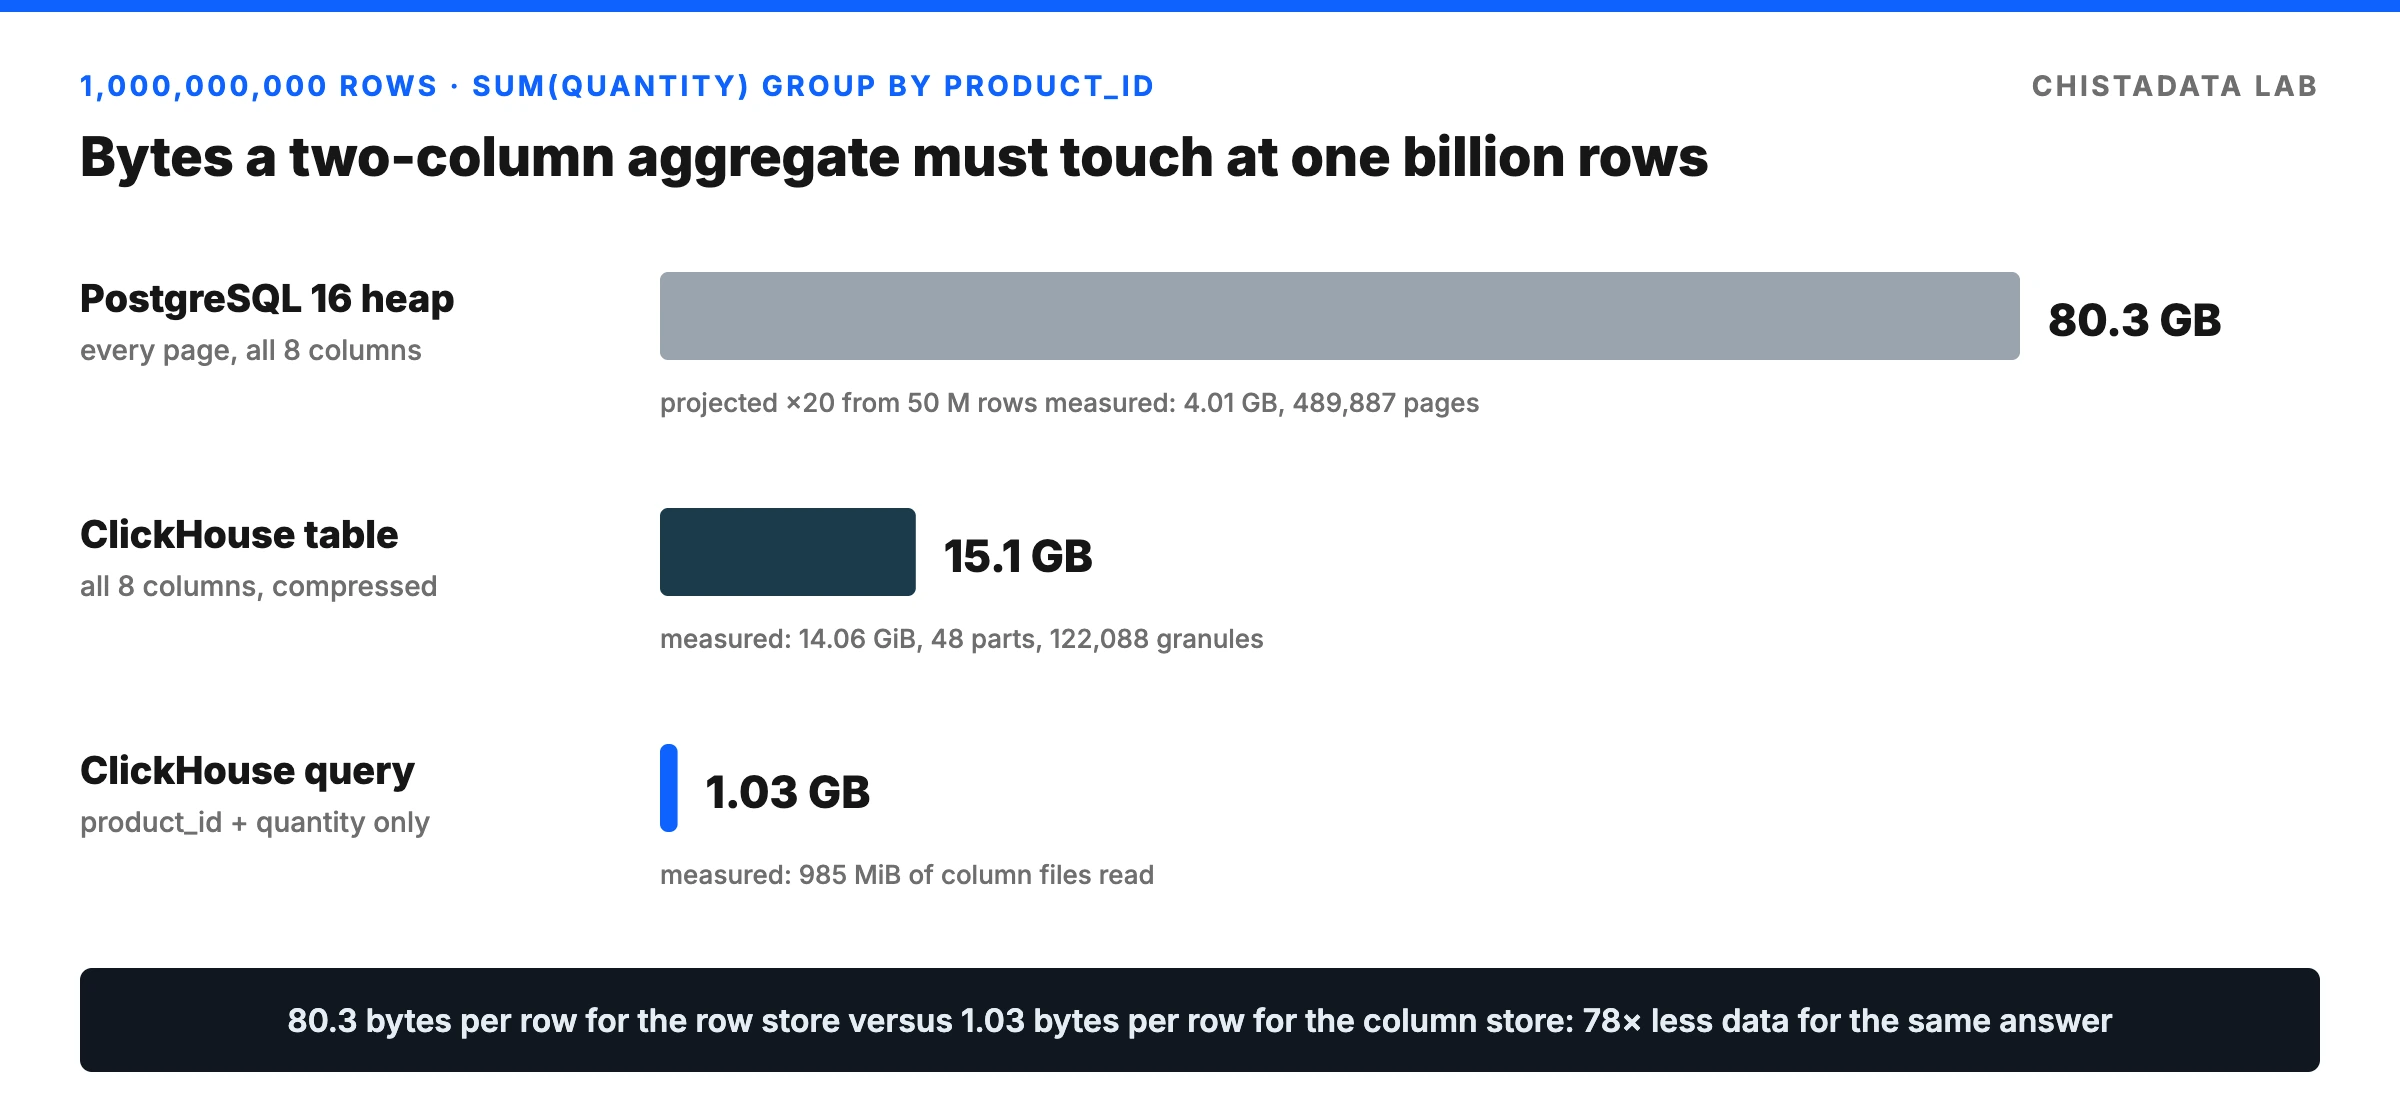
The 78× byte ratio is not tuning; it is the layout. It widens with every column added to the table that the query does not use. In the Tier C head-to-head, where the table carries three wide text columns, the same query read 3.85 GB from PostgreSQL and 45.5 MiB from ClickHouse, an 85× reduction.
Mechanism 2
Per-column compression in columnar databases, measured on one billion rows
Because every file in a column store holds one data type, the compressor sees homogeneous input and the engine can choose a codec per column. system.parts_columns reports the result column by column, something no row store can offer because it never stores a column on its own.
| Column | Type | Compressed | Uncompressed | Ratio | Why |
|---|---|---|---|---|---|
sale_date | Date | 8.53 MiB | 1.86 GiB | 223.5× | First sort-key column: long runs of identical values |
product_id | UInt32 | 48.52 MiB | 3.73 GiB | 78.6× | Second sort-key column: sorted within each day |
status | LowCardinality(String) | 527.88 MiB | 956.82 MiB | 1.8× | Dictionary-encoded, 4 distinct values |
unit_price | Decimal(10,2) | 3.83 GiB | 7.45 GiB | 1.9× | Random values, but bounded range |
order_id | UInt64 | 4.21 GiB | 7.45 GiB | 1.8× | Third sort key: near-sequential inside each product run |
region | LowCardinality(String) | 811.56 MiB | 956.82 MiB | 1.2× | 8 values, hash-random order |
quantity | UInt8 | 936.93 MiB | 953.67 MiB | 1.0× | Random 1 to 20, already one byte |
customer_id | UInt32 | 3.74 GiB | 3.73 GiB | 1.0× | Random, outside the sort key: incompressible |
Table 3. Per-column compression for 1,000,000,000 rows with the default LZ4 codec. Whole table: 27.01 GiB to 14.06 GiB.
The spread from 1.0× to 223× on the same table is the lesson. In columnar databases, sort order is a compression setting, not just an index. Columns early in the ORDER BY compress by two orders of magnitude; random columns outside it do not compress at all with a general-purpose codec.
Specialised codecs push further. In the Tier C head-to-head, switching from LZ4 to Delta, DoubleDelta and ZSTD(1) per column shrank the table from 1.92 GiB to 1.04 GiB and took sale_date from 215× to 804×. The same top-five query then ran at 219 ms instead of 178 ms, because ZSTD costs more CPU per byte. On a CPU-bound two-core box the smaller table lost; on storage-bound nodes reading from object storage it usually wins. Measure on your own hardware.
SQL · ClickHouse · codecs chosen per column
CREATE TABLE lab.sales_codec
(
    order_id    UInt64         CODEC(Delta(8), ZSTD(1)),
    sale_date   Date           CODEC(Delta(2), ZSTD(1)),
    customer_id UInt32         CODEC(ZSTD(1)),
    product_id  UInt32         CODEC(ZSTD(1)),
    region      LowCardinality(String),
    status      LowCardinality(String),
    quantity    UInt8          CODEC(ZSTD(1)),
    unit_price  Decimal(10, 2) CODEC(ZSTD(1))
)
ENGINE = MergeTree
PARTITION BY toYYYYMM(sale_date)
ORDER BY (sale_date, product_id, order_id)
SETTINGS index_granularity = 8192;
Row-based databases compress too, at a different grain. PostgreSQL compresses individual oversized values through TOAST (pglz, or lz4 since PostgreSQL 14) and leaves the tuple body alone; InnoDB page compression squeezes a mixed-type 16 KB page. Neither can give sale_date its own 800× codec, because neither ever holds sale_date on its own.
Mechanism 3
Data skipping: from one billion rows to 2.1%
A monthly revenue report is the range scan every pitch for columnar databases leads with, and the fairest test in the set, because PostgreSQL has a real block-skipping structure of its own: the BRIN index, which stores a min/max summary per range of heap pages and works well on time-ordered tables.
SQL · ClickHouse 26.7 · 1 B rows · EXPLAIN indexes = 1
EXPLAIN indexes = 1
SELECT region, sum(quantity * unit_price) AS revenue
FROM lab.sales_1b
WHERE sale_date BETWEEN toDate('2024-03-01') AND toDate('2024-03-31')
GROUP BY region;

ReadFromMergeTree (lab.sales_1b)
  Parts: 1 | Granules: 2592
  Prewhere filter column: sale_date <= '2024-03-31' AND sale_date >= '2024-03-01'
  Indexes:
    Min-Max     Keys: sale_date             Parts: 1/48    Granules: 2592/122088
    Partition   Keys: toYYYYMM(sale_date)   Parts: 1/1     Granules: 2592/2592
    PrimaryKey  Keys: sale_date             Parts: 1/1     Granules: 2592/2592
                Search Algorithm: binary search
-- median of 3 runs: 205 ms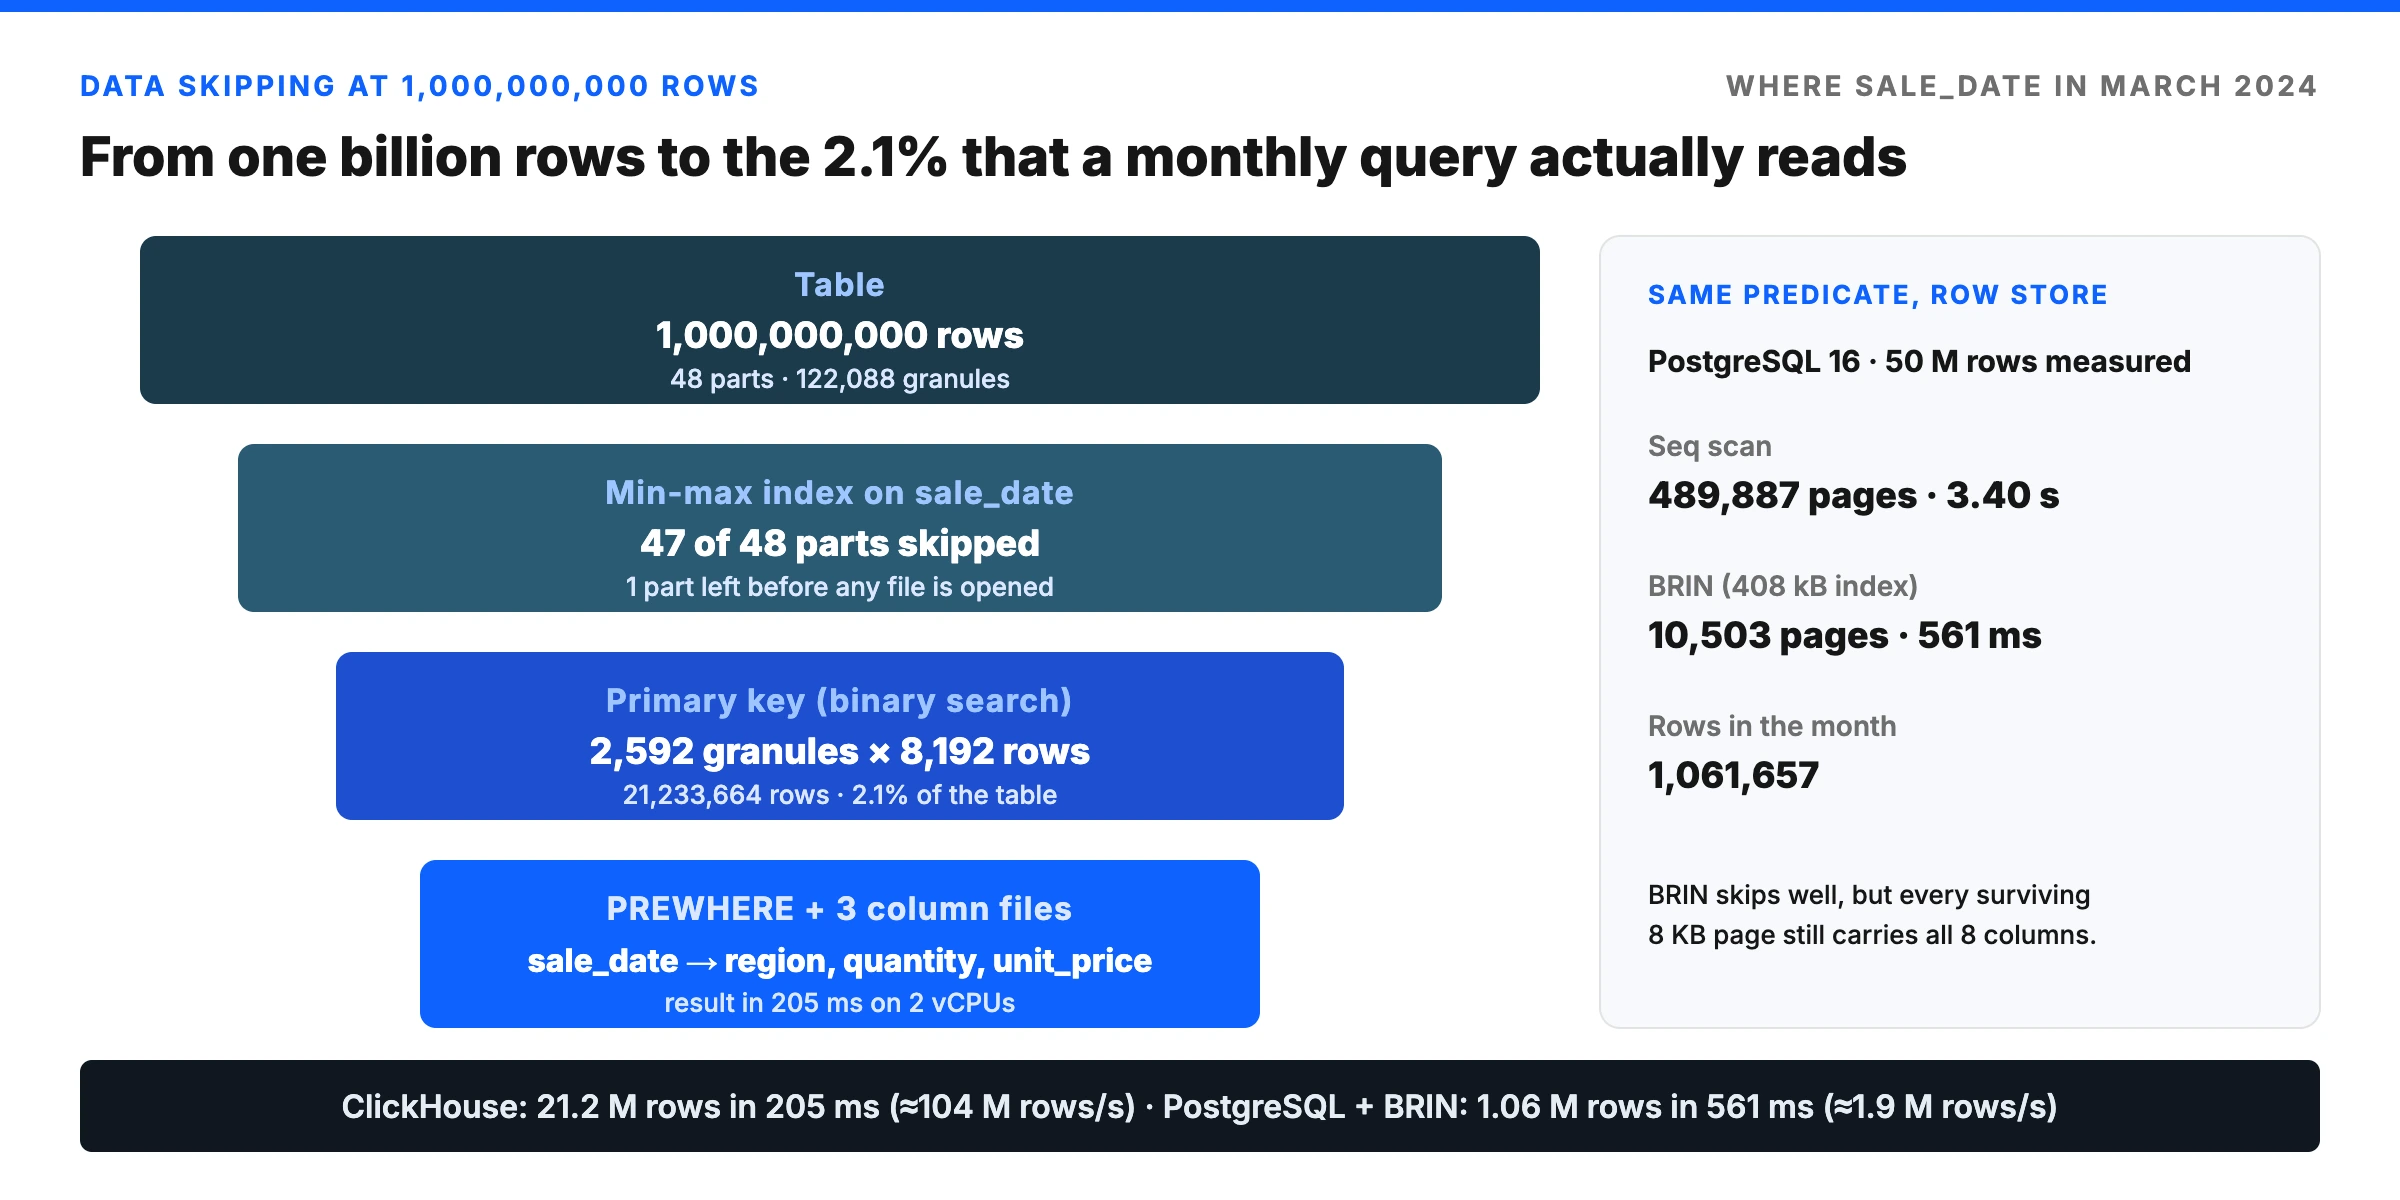
Three layers of pruning fire in order, and all are cheap because columnar databases keep per-part and per-granule metadata beside the data. The min/max index discards 47 of 48 parts before any file is opened. The partition key confirms the survivor. The primary key binary-searches the marks of that part. The engine then evaluates the date predicate in PREWHERE before decompressing region, quantity and unit_price, and processes 21.2 million rows in 205 ms.
PostgreSQL skipped well too. On 50 million rows, a 408 kB BRIN index cut the scan from 489,887 pages and 3.40 s to 10,503 pages and 561 ms. Many “we need a columnar database” conversations are really “nobody created a BRIN index” conversations. The gap that remains is Mechanism 1 again: every surviving heap page still carries all eight columns, so throughput is about 1.9 million rows per second in range, against about 104 million in ClickHouse. Skipping decides how many rows; layout decides how many bytes per row.
primary.idx. MergeTree skip indexes (minmax, set, bloom_filter, ngrambf_v1, tokenbf_v1) add per-granule summaries for those columns, and the 26.7 build also maintained automatic column statistics that pruned parts on order_id in the point-lookup test. Neither replaces choosing the right ORDER BY, the most consequential decision in a MergeTree schema.Mechanism 4
Vectorised execution over columnar blocks
Contiguous arrays of one type are what a CPU wants, and columnar databases hand the executor exactly that. ClickHouse moves data as blocks of up to 65,409 rows, one array per column, and each transform loops over an array with no per-row function calls and a loop body the compiler can vectorise with SIMD instructions. That is how two vCPUs sustained about 300 million rows per second on the billion-row aggregate. Our deep dive on ClickHouse vectorized query processing measures each part of this separately.
SQL · ClickHouse 26.7 · EXPLAIN PIPELINE
EXPLAIN PIPELINE
SELECT product_id, sum(quantity) AS units
FROM lab.sales
GROUP BY product_id ORDER BY units DESC LIMIT 5
SETTINGS max_threads = 2;

(Expression)  ExpressionTransform
(Limit)       Limit
(Sorting)     MergingSortedTransform 2 → 1
                MergeSortingTransform × 2
                  PartialSortingTransform × 2
(Aggregating) Resize 2 → 2
                AggregatingTransform × 2
(Expression)      ExpressionTransform × 2
(ReadFromMergeTree) MergeTreeSelect(pool: ReadPool, algorithm: Thread) × 2 0 → 1
Two independent lanes read granules, aggregate into two hash tables and merge once at the top; more cores add more lanes. PostgreSQL’s executor is tuple-at-a-time by design: each row is fetched, deformed from its on-page representation, passed up the plan tree and hashed. JIT compilation (since PostgreSQL 11) and parallel query reduce the overhead, but the per-tuple model stays. In the 50-million-row serial plan the scan took 4.1 s of the 12.8 s total; the rest was per-tuple aggregation.
Honest limits
Where row-based databases win, measured on the same data
A comparison of columnar databases and row-based databases that only shows the columnar side winning is advertising. Point lookups and single-row changes are the OLTP staples that columnar databases handle worst, and the gap does not shrink at scale.
SQL · Point lookup on both engines
-- PostgreSQL 16, 50 M rows
EXPLAIN (ANALYZE, BUFFERS, COSTS OFF)
SELECT * FROM sales_50m WHERE order_id = 31234567;
Index Scan using pk_sales_50m on sales_50m (actual time=0.068..0.068 rows=1 loops=1)
  Buffers: shared hit=4 read=4
Execution Time: 0.082 ms          -- median of 3 warm runs: 0.16 ms

-- ClickHouse 26.7, 1 B rows (order_id is third in the sort key)
EXPLAIN indexes = 1 SELECT * FROM lab.sales_1b WHERE order_id = 612345678;
  Statistics   Keys: order_id   Parts: 1/48   Granules: 2509/122088
  PrimaryKey   Keys: order_id   Granules: 2509/2509  (generic exclusion search)
-- 5 ms warm; about 20.5 M rows' worth of granules are candidates for one row
SQL · Single-row update on both engines
-- PostgreSQL 16, Tier C (logged table)
UPDATE sales SET status = 'returned' WHERE order_id = 12345678;
-- Execution Time: 0.654 ms · 19 buffers touched, 3 dirtied, one WAL record

-- ClickHouse 26.7, 1 B rows
ALTER TABLE lab.sales_1b UPDATE status = 'returned'
WHERE order_id = 612345678 SETTINGS mutations_sync = 2;
-- elapsed: 7.31 s
-- 202406_573_592_2       20,547,960 rows  295.95 MiB  active = 0  (old part)
-- 202406_573_592_2_948   20,547,960 rows  295.94 MiB  active = 1  (rewritten)
Changing one row in the billion-row table rewrote a 296 MiB part of 20.5 million rows. The PostgreSQL update touched 19 buffers and is a transaction: it can be rolled back, it takes a row lock, and concurrent readers see the old version until commit. Lightweight DELETE and the newer lightweight UPDATE in ClickHouse hide part of the latency by masking rows until the next merge, but the physical work is similar and multi-statement transactions are still absent.
Point reads and writes
B-tree to the row, row-level locks, HOT updates, WAL. Sub-millisecond work belongs to row stores; columnar databases decompress granules to return one row.
Transactions
Multi-statement ACID with MVCC, foreign keys and constraints enforced at write time. MergeTree offers none of this and does not pretend to.
High update rates
Every UPDATE or DELETE in a column store is a part rewrite or a masked row awaiting a merge. Past a few percent of rows per day, CDC into an append-only model is the right design.
Small, wide SELECT *
Fetching a handful of complete rows makes a column store open every column file. A row store reads a handful of pages.
Architecture decision
Choosing between columnar databases and row-based databases by workload
The question is never whether columnar databases are faster than row-based databases. It is which access pattern dominates, and what the write path looks like.
| Workload | Decisive mechanism | Row store (PostgreSQL, MySQL, SQL Server) | Columnar (ClickHouse and peers) |
|---|---|---|---|
| Aggregates over billions of rows, few columns | Column I/O and vectorisation | 80.3 bytes per row read; ≈104 s projected at 1 B rows with 2 workers | 1.03 bytes per row; 3.34 s at 1 B rows |
| Time-range analytics on ordered data | Data skipping | BRIN skips blocks; each page still carries full rows | 1 of 48 parts, 2.1% of granules, 205 ms |
| Wide tables, sparse column access | Layout | Cost grows with row width | Cost grows only with columns named |
| Storage per row at scale | Per-column codecs | 80.3 bytes per row on this schema, before indexes | 15.1 bytes per row on random data; far less on real data |
| Point lookup by key | B-tree | 0.16 ms, 8 buffers | 5 ms, thousands of granules as candidates |
| Frequent single-row UPDATE or DELETE | Write path | 0.65 ms, transactional | 7.3 s, part rewrite, no rollback |
| Multi-statement transactions and constraints | MVCC and locking | Complete | Absent by design in MergeTree |
| High-throughput inserts of new events | Append path | Tens of thousands of rows/s per table with index maintenance | Millions of rows/s in batches; 3.4 M rows/s on 2 vCPUs here |
Table 4. Decision matrix with measured values from this lab. The right architecture for most estates is both engines with a CDC or batch pipeline between them.
Keep the system of record on a row store, and move every query that reads millions of rows to produce a few hundred onto a columnar database fed from it. The mechanisms that make columnar databases fast are the same ones that make them poor at transactions, so a single engine that does both well at billion-row scale does not exist yet, whatever the HTAP slide says. Our ClickHouse migration practice designs exactly this split.
Beyond our lab
Public evidence of columnar databases at billion and trillion scale
Our lab runs on two vCPUs. Operators and researchers have published what the same architecture does on production hardware.
6 million requests per second
Cloudflare documented HTTP analytics averaging 6 M requests/s with 8 M peaks, 11 M rows/s inserted and 36 nodes with 3× replication, storing each request in 36.74 bytes.
Trillions of rows, hundreds of columns
The ClickHouse paper describes an engine designed for tables with trillions of rows and evaluates it on data sets such as 3.4 billion NYC taxi rides, with SSE 4.2 through AVX-512 kernels chosen at runtime.
32 TB per table
With the default 8 KB block size a PostgreSQL table can hold up to 32 TB. At 80.3 bytes per row that is roughly 400 billion rows of this schema, all of which a full aggregate would have to read.
Scope
What this test does not show
- Row-store runs at one billion rows. The PostgreSQL numbers at that scale are linear projections from 50 million measured rows. On this host an 80 GB heap would not fit in memory, so real scans would be slower than projected, not faster.
- Concurrency. Every number is a single query on an idle system, which favours columnar databases. A row store serving thousands of concurrent point reads is a contest the row store wins.
- Real data skew. Hash-generated columns are a worst case for compression. Expect materially higher ratios on production data, and re-measure with
system.parts_columns. - Other engines. Citus columnar, Parquet on object storage, SQL Server columnstore indexes and MySQL HeatWave implement the same mechanisms with different trade-offs. None changes the conclusion about the write path.
- Cold cache. Warm-cache figures flatter the row store. From disk, a 78× byte ratio becomes a 78× I/O ratio.
Reproduce it
Generate the billion-row table yourself
Every claim about columnar databases on this page can be checked. The ClickHouse generator below loads one billion rows in ten batches; the PostgreSQL generator builds the 50-million-row comparison table.
SQL · ClickHouse 26.7 · run for batch = 0 to 9
INSERT INTO lab.sales_1b
SELECT number + 1,
       toDate('2022-01-01') + intDiv(number, 684932),
       1 + cityHash64(number) % 500000,
       1 + cityHash64(number * 7) % 5000,
       ['us-east','us-west','eu-central','eu-west','ap-south','ap-southeast','sa-east','me-central'][1 + cityHash64(number * 11) % 8],
       ['delivered','delivered','delivered','shipped','returned','cancelled'][1 + cityHash64(number * 13) % 6],
       1 + cityHash64(number * 17) % 20,
       toDecimal64((cityHash64(number * 19) % 99000 + 100) / 100, 2)
FROM numbers(batch * 100000000, 100000000)
SETTINGS max_threads = 2, max_insert_threads = 2;

OPTIMIZE TABLE lab.sales_1b FINAL;   -- one part per month before measuring
SQL · PostgreSQL 16 · 50 M-row comparison table
INSERT INTO sales_50m
SELECT g,
       DATE '2022-01-01' + (g / 34247),
       1 + (abs(hashint8(g)) % 500000),
       1 + (abs(hashint8(g * 7)) % 5000),
       (ARRAY['us-east','us-west','eu-central','eu-west','ap-south','ap-southeast','sa-east','me-central'])[1 + abs(hashint8(g * 11)) % 8],
       (ARRAY['delivered','delivered','delivered','shipped','returned','cancelled'])[1 + abs(hashint8(g * 13)) % 6],
       1 + (abs(hashint8(g * 17)) % 20),
       ((abs(hashint8(g * 19)) % 99000) + 100) / 100.0
FROM generate_series(1, 50000000) AS g;
ALTER TABLE sales_50m ADD CONSTRAINT pk_sales_50m PRIMARY KEY (order_id);
VACUUM (ANALYZE) sales_50m;
Run every query at least three times, report the median, keep max_threads and max_parallel_workers_per_gather equal, and read bytes from the catalogs (EXPLAIN BUFFERS, pg_stat_io, system.parts_columns) rather than from wall-clock time alone. Test on a copy of your own data before drawing conclusions for production, and keep a tested restore path before changing any schema that serves it.
FAQ
Columnar databases vs row-based databases: frequently asked questions
Are columnar databases always faster than row-based databases?
No. Columnar databases are faster when a query reads many rows and few columns. Row-based databases are faster for point lookups, single-row updates and transactions. In our lab the row store answered a key lookup in 0.16 ms against 5 ms, and a one-row update in 0.65 ms against 7.3 s.
How much less data does a columnar database read?
It depends on how many columns the query names relative to the table width. For a two-column aggregate over our eight-column table, ClickHouse read 1.03 bytes per row against 80.3 bytes per row for the PostgreSQL heap, a 78× difference at one billion rows.
Can PostgreSQL skip data like a column store?
Partly. A BRIN index on a time-ordered column skips blocks well: it cut our monthly query from 3.40 s to 561 ms on 50 million rows. It cannot avoid reading the other columns stored in each surviving page.
Should we replace PostgreSQL with ClickHouse?
Usually not. Keep PostgreSQL as the system of record and move large analytical queries to ClickHouse through CDC or batch loads. That split uses each engine for what our measurements show it does best.
Next step
Running analytics on billions of rows, or deciding whether to?
ChistaDATA designs, migrates, tunes and operates ClickHouse, the columnar database we specialise in, for enterprises that have outgrown row stores for analytics. We measure before we recommend, and we will tell you when a BRIN index is all you needed.
Running ClickHouse in production? ChistaDATA provides ClickHouse consulting for architecture, performance and migrations, and 24×7 ClickHouse support with a 15-minute S1 response. For day-to-day operations see ClickHouse DBA services and ClickHouse managed services.
