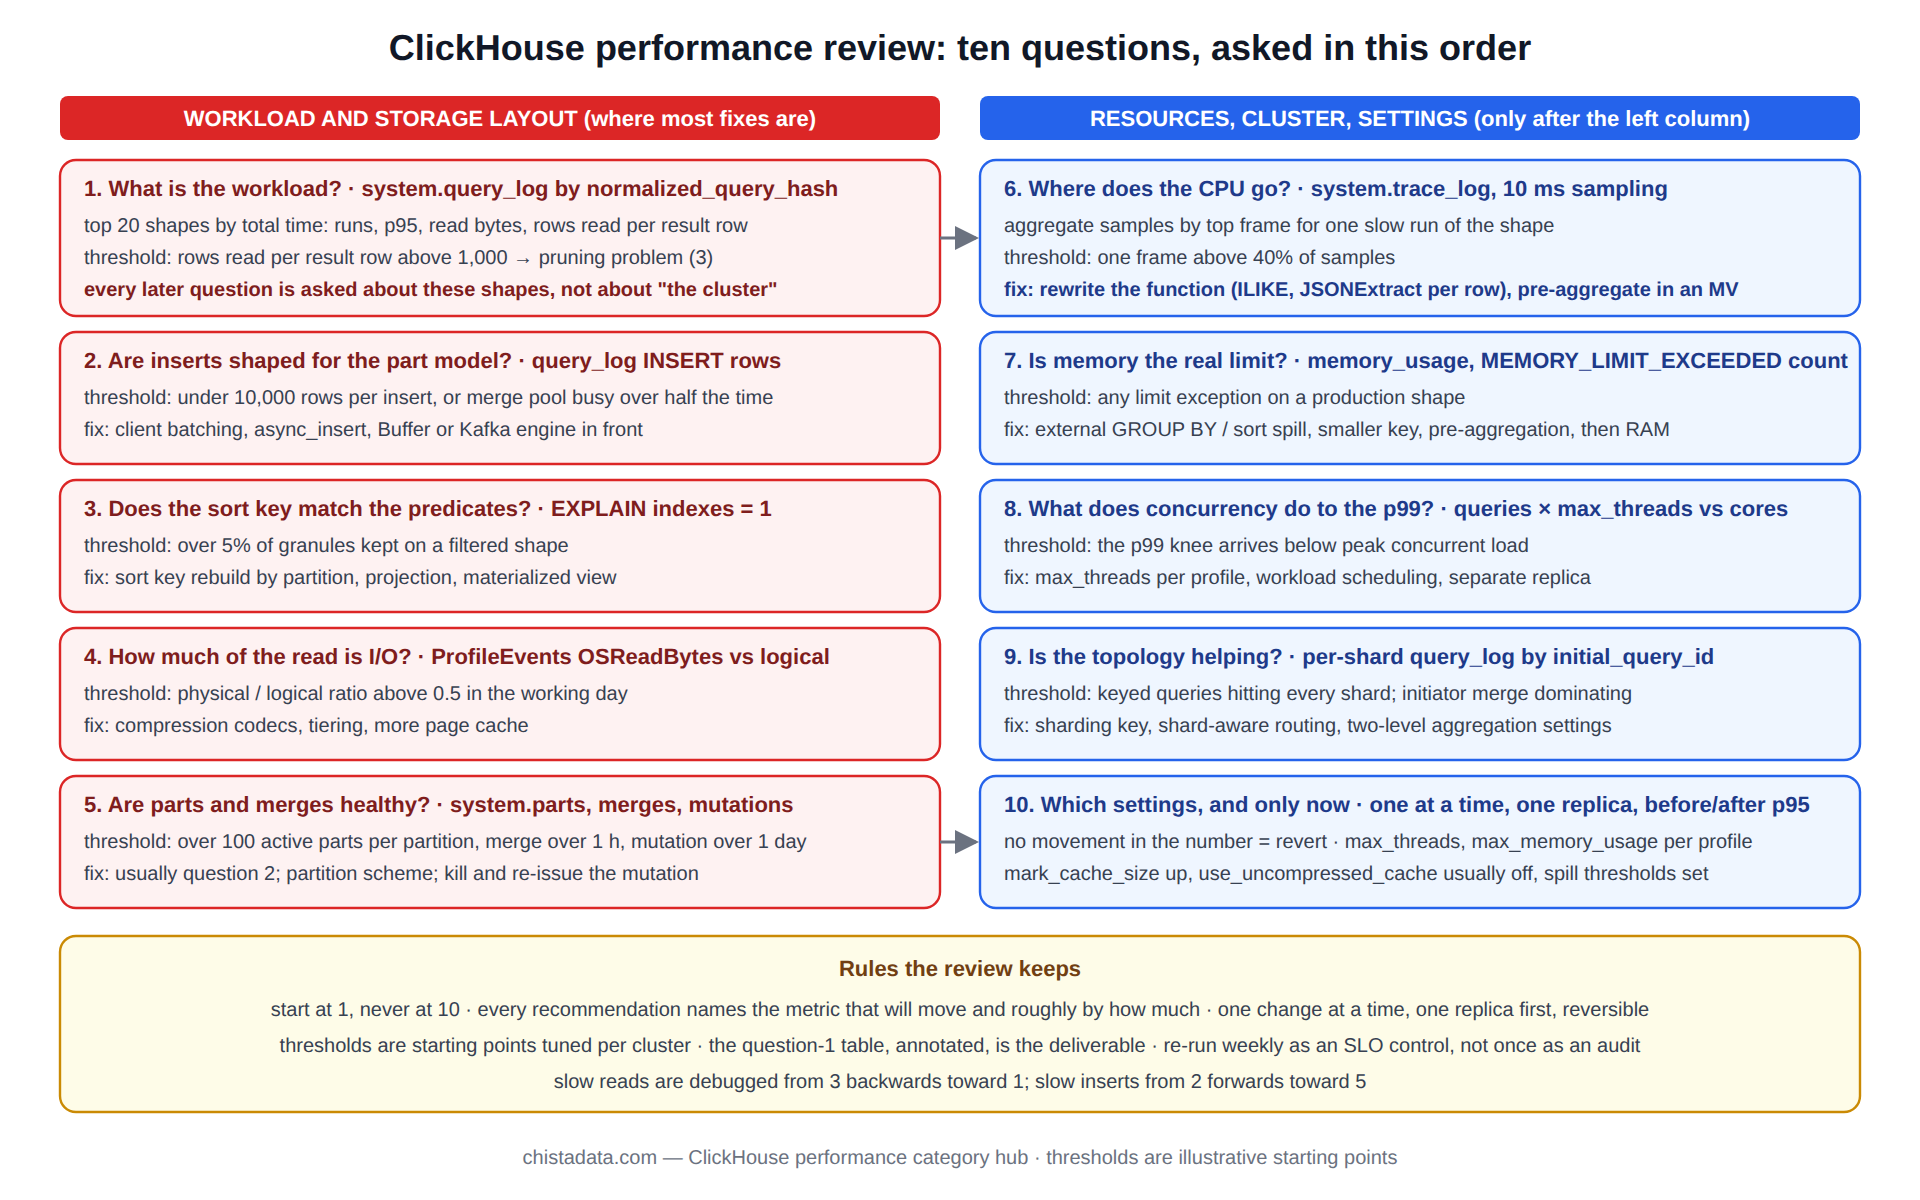
ClickHouse performance work, done properly, is a review with a fixed order of questions and a measurement behind every answer. It starts from the workload as system.query_log records it, moves to the storage layout that the workload runs against, then to the resources the node has to give it, and only at the end to settings.
Most performance problems on ClickHouse are found in the first two steps and fixed with a sort key, a partition scheme or a batching change; settings are last because they are the smallest lever and the easiest to over-turn. This page is that review, written as the ten questions asked in order during a ClickHouse performance audit, with the query or table that answers each and the threshold that decides whether to move on.
This is the largest category in the archive, with more than three hundred posts covering every one of the ten questions in depth. The review below is the spine; the linked posts are the muscle.
Question 1: what is the ClickHouse performance workload, in the words of system.query_log?
A ClickHouse performance review that starts from a slow query someone noticed is a review of one query. Starting from the log is a review of the system. system.query_log with normalized_query_hash groups every statement by shape, and the first table produced is the top twenty shapes by total time, with their count, p95 and read volume. That table decides where the rest of the review goes: a system whose time is dominated by three dashboard queries is tuned differently from one where ten thousand distinct ad-hoc queries share the load evenly.
SELECT
    normalized_query_hash                              AS shape,
    count()                                            AS runs,
    round(sum(query_duration_ms) / 1000)               AS total_s,
    quantile(0.95)(query_duration_ms)                  AS p95_ms,
    formatReadableSize(avg(read_bytes))                AS avg_read,
    round(avg(read_rows) / greatest(avg(result_rows), 1)) AS rows_read_per_result_row,
    any(substring(query, 1, 120))                      AS sample
FROM system.query_log
WHERE type = 'QueryFinish'
  AND query_kind = 'Select'
  AND event_time > now() - INTERVAL 7 DAY
GROUP BY shape
ORDER BY total_s DESC
LIMIT 20;
The column that matters most is rows_read_per_result_row. A shape that reads a million rows to return ten is a pruning problem (question 3); one that reads ten rows per result row and is still slow is a compute or concurrency problem (questions 6 and 8). The archive posts on mining query_log for performance and the performance audit guide go deeper on this first table.
Question 2: are inserts shaped for the part model?
The same log answers the write-side question. ClickHouse performance degrades faster from small inserts than from any query pattern, because every insert is a part and every part is a merge. Average rows per INSERT below ten thousand, or more than a few inserts per second per table, means the merge pool is working to undo the ingestion pattern. The threshold used in reviews is simple: if the merge pool is busy more than half the time (system.metrics.BackgroundMergesAndMutationsPoolTask against background_pool_size), the insert shape is the first fix regardless of what the queries look like.
SELECT
    tables[1]                        AS table,
    count()                          AS inserts,
    round(avg(written_rows))         AS avg_rows,
    round(count() / (7 * 86400), 2)  AS inserts_per_second
FROM system.query_log
WHERE type = 'QueryFinish'
  AND query_kind = 'Insert'
  AND event_time > now() - INTERVAL 7 DAY
GROUP BY table
ORDER BY inserts DESC
LIMIT 10;
The fix is batching at the client, async_insert on the server (stable since 22.x), or a Buffer or Kafka engine in front of the table; the ingestion performance post compares the three.
Question 3: does the sort key match the predicates? Most ClickHouse performance lives here
This is where most ClickHouse performance is won or lost, and the evidence is EXPLAIN indexes = 1 on the top shapes from question 1. The PrimaryKey line shows how many granules survive the sort key; a shape that keeps more than a few percent of granules on a filtered query has a sort key that does not lead with its predicate columns. The review records, for each top shape, the granules read against the granules in the table, and the ones above 5 percent go on the list for a sort-key change, a projection, or a materialized view.
EXPLAIN indexes = 1
SELECT count()
FROM events
WHERE event_date >= today() - 7
  AND tenant_id = 42;
-- PrimaryKey Keys: event_date  Parts: 7/120  Granules: 41000/61440
-- 67% of granules kept: tenant_id is not in the key
A sort-key change on a large table is a rebuild (create the new table, INSERT ... SELECT by partition, swap), so the review also checks whether a projection with the alternate order (ALTER TABLE ... ADD PROJECTION, stable since 22.x) serves the shape without touching the base table. The posts on partition versus primary-key pruning and MergeTree optimisation cover the decision.
Question 4: how much of the read is I/O, and from where?
Once pruning is right, the review measures what the surviving granules cost to read. ProfileEvents in system.query_log separates bytes read from the page cache, from local disk and from object storage, and the ratio of OSReadBytes (physical) to ReadCompressedBytes (logical) shows how much the page cache is helping. On a node where physical reads approach logical reads during the working day, the working set does not fit in RAM and ClickHouse performance is bounded by the storage tier, which moves the conversation to compression (smaller bytes), tiering (hot data on faster disks) or memory (a bigger page cache).
SELECT
    normalized_query_hash                                       AS shape,
    formatReadableSize(sum(ProfileEvents['ReadCompressedBytes'])) AS logical,
    formatReadableSize(sum(ProfileEvents['OSReadBytes']))         AS physical,
    round(sum(ProfileEvents['OSReadBytes'])
        / greatest(sum(ProfileEvents['ReadCompressedBytes']), 1), 2) AS physical_ratio,
    formatReadableSize(sum(ProfileEvents['ReadBufferFromS3Bytes'])) AS from_s3
FROM system.query_log
WHERE type = 'QueryFinish'
  AND event_time > now() - INTERVAL 1 DAY
GROUP BY shape
ORDER BY sum(ProfileEvents['OSReadBytes']) DESC
LIMIT 10;
The IOPS troubleshooting post and the performance and I/O hub take this question through disk selection and queue depth.
Question 5: are parts and merges healthy?
Parts per partition, merge duration and mutation backlog are the storage-layer health signals, and a ClickHouse performance review reads them before touching any query. More than a few hundred active parts in a partition means every query over that partition opens that many files per column; a merge that has run for an hour is either enormous or starved; a mutation older than a day is a stuck ALTER. The three queries are the ones the DBA script hub runs every five minutes, and the review takes their output as-is.
SELECT
    table,
    partition,
    count()                              AS parts,
    formatReadableSize(sum(bytes_on_disk)) AS on_disk,
    max(modification_time)               AS newest_part
FROM system.parts
WHERE active
GROUP BY table, partition
HAVING parts > 100
ORDER BY parts DESC;
The merge and mutation performance post is the detailed reference for what to do when the counts are wrong.
Question 6: where does the CPU go?
For shapes that read little and still run long, the profiler answers. system.trace_log with query_profiler_cpu_time_period_ns set (a sampling period of 10 ms is safe on production) records stack samples per query, and aggregating them by top frame shows whether the time is in decompression, hashing for GROUP BY, string functions, or waiting on a lock. This is the step that finds the ILIKE on a hot path, the JSONExtract called per row on a String column, and the aggregation over a high-cardinality key that should be pre-aggregated in a materialized view.
SET query_profiler_cpu_time_period_ns = 10000000;   -- 10 ms

SELECT
    arrayStringConcat(arrayMap(x -> demangle(addressToSymbol(x)), trace), '\n') AS stack,
    count()                                                                      AS samples
FROM system.trace_log
WHERE trace_type = 'CPU'
  AND query_id = '${QUERY_ID}'
GROUP BY trace
ORDER BY samples DESC
LIMIT 5
SETTINGS allow_introspection_functions = 1;
The eBPF performance analysis post extends the same method below the process boundary, and the CPU efficiency post covers the settings that follow from what the profile shows.
Question 7: is memory the real limit?
ClickHouse performance and ClickHouse memory are the same conversation once a query spills or fails.
The review looks at memory_usage per shape in system.query_log, the count of MEMORY_LIMIT_EXCEEDED exceptions, and whether max_bytes_before_external_group_by and max_bytes_before_external_sort are set, because a query that spills to disk is slow but finishes, while one that hits the limit fails and is retried by the client, which is worse for everyone else.
The memory hub has the seven-layer model; the review’s job is to record which shapes are memory-bound and whether the fix is a smaller hash table (pre-aggregation), a spill, or a bigger node.
Question 8: what does concurrency do to ClickHouse performance at the p99?
Every measurement so far was per query. Production is many at once, and ClickHouse performance under concurrency is governed by max_threads per query multiplied by concurrent queries against the core count. A 32-core node running 20 queries at max_threads = 32 is oversubscribed twenty times, and the p99 reflects the scheduler, not the queries.
The review plots concurrent query count (system.metrics.Query, sampled) against p99 from the log and looks for the knee; above the knee the fix is a lower max_threads for the dashboard user, workload scheduling (SETTINGS workload, since 23.x), or a separate replica for the analytical load.
SELECT
    toStartOfFiveMinutes(event_time)              AS t,
    count()                                       AS queries,
    quantile(0.99)(query_duration_ms)             AS p99_ms,
    max(ProfileEvents['ConcurrentQueries'])       AS peak_concurrent  -- illustrative; sample system.metrics for the real series
FROM system.query_log
WHERE type = 'QueryFinish'
  AND event_time > now() - INTERVAL 1 DAY
GROUP BY t
ORDER BY p99_ms DESC
LIMIT 12;
The posts on thread contention and designing for mixed workloads cover the two sides of this question.
Question 9: is the cluster topology helping or hurting?
On a sharded cluster, ClickHouse performance adds a network stage: the initiator fans the query out, each shard reads and partially aggregates, and the initiator merges. Two things go wrong. A query that should hit one shard (by sharding key) hits all of them, multiplying work; and the final merge on the initiator becomes the bottleneck for high-cardinality GROUP BY. EXPLAIN on the distributed table and system.query_log on each shard (the same initial_query_id) show both. The sharding troubleshooting and hot-spot detection posts are the references, and the sharding archive has the design side.
Question 10: ClickHouse performance settings, and only now
Settings come last because by this point the review knows which of the nine earlier questions the setting is meant to answer. The performance settings for 26.8 LTS post lists the current defaults; the review’s rule is to change one setting at a time, on one replica, with the p95 of the affected shapes recorded before and after, and to keep the change only if the number moved. Settings that are almost always worth reviewing: max_threads per profile, max_memory_usage per profile, max_bytes_before_external_group_by, use_uncompressed_cache (usually off), mark_cache_size (usually up), and background_pool_size (rarely up without more cores).
| Question | Evidence | Threshold that triggers action | Typical fix |
|---|---|---|---|
| 1. Workload | query_log by shape | rows read per result row > 1,000 | go to 3 |
| 2. Inserts | query_log INSERT | < 10,000 rows per insert | batch, async_insert |
| 3. Pruning | EXPLAIN indexes = 1 | > 5% granules kept on filtered shapes | sort key, projection, MV |
| 4. I/O | ProfileEvents OSReadBytes | physical ratio > 0.5 in the working day | compression, tiering, RAM |
| 5. Parts | system.parts, merges, mutations | > 100 parts per partition | fix 2, partition scheme |
| 6. CPU | trace_log samples | one frame > 40% of samples | rewrite function, MV |
| 7. Memory | memory_usage, exceptions | any MEMORY_LIMIT_EXCEEDED | spill settings, pre-aggregate |
| 8. Concurrency | p99 vs concurrent count | p99 knee below peak load | max_threads, workloads, replica |
| 9. Topology | per-shard query_log | all shards hit for keyed queries | sharding key, routing |
| 10. Settings | before/after p95 | no movement = revert | one at a time |
What a ClickHouse performance review delivers
The output is not a list of settings. It is the question-1 table with each top shape annotated by which question explained it, the change proposed for it, and the p95 expected after; the storage-layer numbers from questions 2 and 5 with their fixes; and a change plan in which every item is staged on one replica, measured, and reversible. The measurement discipline is what separates a review from an opinion: a recommendation that cannot name the metric that will move, and by roughly how much, does not go in the report.
Two mistakes recur across engagements. The first is starting at question 10 because a setting is the fastest thing to change, and finding three weeks later that the sort key was wrong all along. The second is changing several things at once so that the improvement cannot be attributed and the regression cannot be isolated. The performance mistakes and performance pitfalls posts list the rest.
Reading the ClickHouse performance numbers as an SLO
The review’s thresholds are inputs to a service objective, not the objective itself. What the business experiences is a latency percentile for a named set of query shapes (the dashboard shapes, the API shapes, the batch shapes) and an ingestion lag for each pipeline, and the ClickHouse performance review is the mechanism that keeps those within their targets.
Each shape group gets an SLI (p95 or p99 from system.query_log, filtered by the user or the comment tag that identifies the group), a target, and an error budget, and the ten questions are re-run whenever a budget is burning faster than planned.
Recording the ten thresholds beside the SLOs turns a one-time audit into a standing control: the same query that produced the review table runs weekly, and a row crossing its threshold is a ticket rather than a surprise.
Illustrative targets from engagements, to be replaced by the customer’s own: dashboard shapes p95 under 500 ms with a 99.5 percent monthly budget, API shapes p99 under 2 s, batch shapes finishing inside their window nine runs in ten, and ingestion lag under 60 s for streaming pipelines. The reliability hub covers the SLO framework in full.
Version notes
EXPLAIN indexes = 1 is 21.x and later. Projections are stable since 22.x. async_insert is stable since 22.x. Workload scheduling (SETTINGS workload) is 23.x and later. ProfileEvents as a map column in system.query_log is 21.x and later; earlier versions use paired array columns. The ConcurrentQueries profile event in the question-8 query is illustrative; the real series is sampled from system.metrics. The ClickHouse query_log documentation is the reference for every column used above; confirm on the running version.
Reading the archive
The archive is large enough that reading it in question order is the practical route: the audit and settings posts frame the whole review, the storage-layer posts answer questions 2 to 5, and the profiler, memory, concurrency and sharding posts answer 6 to 9.
The 26.8 LTS audit tips post is the current worked example of this review. Then follow the question that matches the symptom: ingestion and merge posts for 2 and 5, the pruning and MergeTree posts for 3, IOPS for 4, the profiler and eBPF posts for 6, thread contention and mixed workloads for 8, sharding for 9, and the settings post for 10.
ChistaDATA runs this review as the opening phase of every ClickHouse consulting engagement and repeats it quarterly under 24×7 support. Every change it proposes is tested on staging with a production-sized sample, applied to one replica first, and shipped with a rollback; a tested restore exists before any sort-key rebuild begins.