ChistaDATA Engineering · ClickHouse Cloud FinOps
ClickHouse Cloud FinOps engineering: cost telemetry, governance and right-sizing built into the platform
Most ClickHouse Cloud cost programmes stop at a dashboard of the invoice. ClickHouse Cloud FinOps engineering goes further: it builds the cost data, allocation logic and guardrails into the platform, so every dollar has an owner and an expensive query is stopped before it runs.
ChistaDATA designs and implements that platform on ClickHouse itself. It runs inside your organisation with no third-party agent and is versioned in your repository. Every component of this ClickHouse Cloud FinOps engineering practice was built and tested on our lab service, ClickHouse 26.9.17.8.
The engineering problem
Why ClickHouse Cloud cost monitoring needs engineering, not another report
A ClickHouse Cloud invoice answers one question well: how much each service cost on each meter. It cannot say which team, feature or query shape drove that cost, because that knowledge lives inside the service, in system.query_log. Finance sees totals; engineering sees queries. Neither can act on the other’s view.
ClickHouse Cloud cost monitoring that changes behaviour joins the two. It needs a durable store of billed cost, a store of the work behind it, and an allocation rule between them. It also needs controls that act at the right moment: before merge, at query start, per hour and per day. That is an engineering deliverable with a schema, tests and a release process, and we treat it as one.
What we build
Four layers of ClickHouse Cloud FinOps engineering
1. Cost telemetry warehouse
A finops database holding daily billed cost from the ClickHouse Cloud usage cost API, hourly query telemetry and versioned ownership.
2. Allocation engine
Two-level ClickHouse Cloud cost allocation: the bill per service, then each service’s compute split by the work each team ran.
3. Governance guardrails
ClickHouse Cloud cost governance in code: a CI cost gate, settings profiles and per-team quotas, each derived from measured telemetry.
4. Right-sizing model
ClickHouse Cloud right-sizing from p95 CPU and peak memory, with headroom, producing a reviewed change rather than a guess.
Repository and runbooks
DDL, loaders and limits in your repository, with a runbook for each scheduled job and a rollback for every limit.
Handover
Your engineers run it. Or our managed ClickHouse Cloud FinOps desk operates it day to day.
Layer 1 · Reference architecture
The ClickHouse cost telemetry platform
Exhibit 1 is the reference design. Three evidence sources feed two loaders. The loaders write a small finops database, which serves four outputs. Guardrails flow back into every service from the same repository, so a limit and the ClickHouse cost telemetry that justifies it are reviewed in the same pull request.
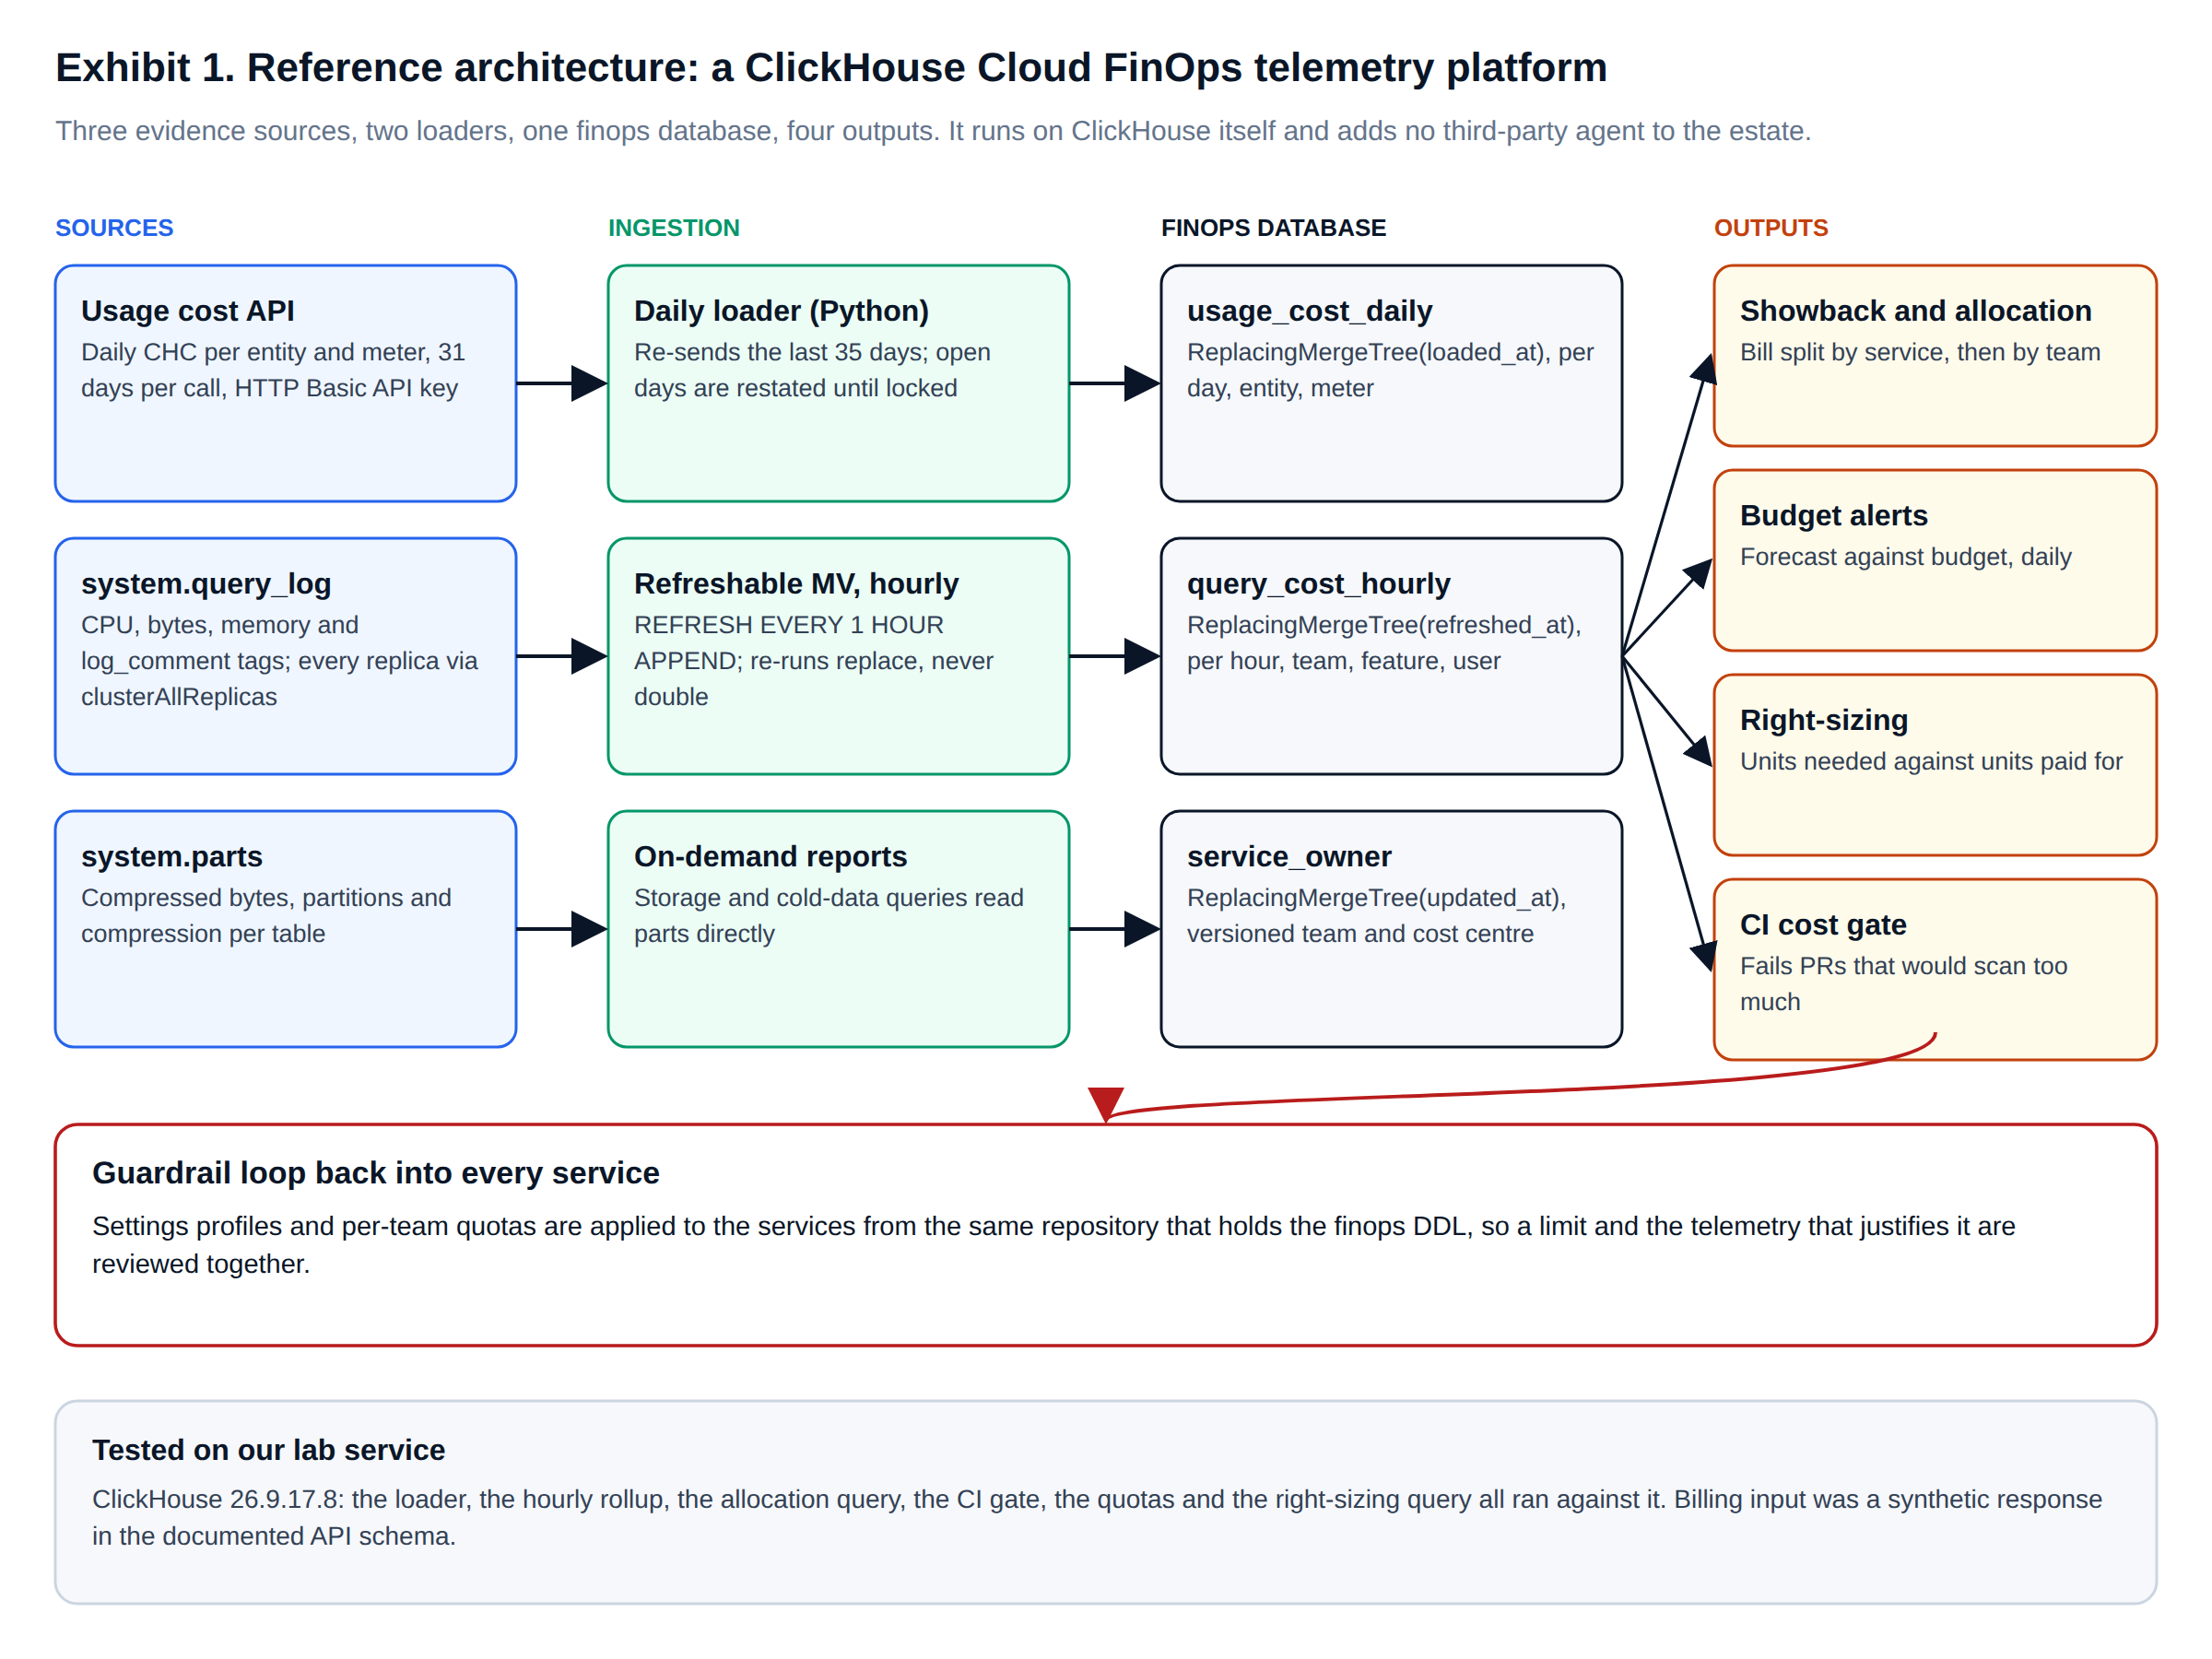
The schema is deliberately plain. Billed days remain open for restatement until the API marks them locked, so the cost table is a ReplacingMergeTree keyed on day, entity and meter, versioned by load time. Telemetry is hourly per team, feature and database user, with a 400-day TTL so year-on-year comparisons are possible. Ownership is versioned, so a reorganisation does not rewrite history.
-- ClickHouse Cloud FinOps engineering: a cost telemetry warehouse, kept in its own database
CREATE DATABASE IF NOT EXISTS finops;

-- 1. Daily billed cost, one row per organisation, day, entity and meter (from the usage cost API).
--    Days stay open for restatement until the API marks them locked, so the loader re-sends them;
--    ReplacingMergeTree keeps the latest load per key.
CREATE TABLE IF NOT EXISTS finops.usage_cost_daily
(
    usage_date       Date,
    organization_id  LowCardinality(String),
    entity_type      LowCardinality(String),          -- datawarehouse | service | clickpipe
    entity_id        String,
    entity_name      LowCardinality(String),
    service_id       String,
    meter            LowCardinality(String),          -- computeCHC, storageCHC, backupCHC, dataTransferCHC, ...
    chc              Decimal(18, 6),
    locked           Bool,
    loaded_at        DateTime64(3, 'UTC') DEFAULT now64(3)
)
ENGINE = ReplacingMergeTree(loaded_at)
PARTITION BY toYYYYMM(usage_date)
ORDER BY (organization_id, usage_date, entity_type, entity_id, meter)
SETTINGS index_granularity = 8192;

-- 2. Who owns each service. Versioned, so ownership changes do not rewrite history.
CREATE TABLE IF NOT EXISTS finops.service_owner
(
    service_id   String,
    team         LowCardinality(String),
    cost_center  LowCardinality(String),
    valid_from   Date,
    updated_at   DateTime64(3, 'UTC') DEFAULT now64(3)
)
ENGINE = ReplacingMergeTree(updated_at)
ORDER BY (service_id, valid_from)
SETTINGS index_granularity = 8192;

-- 3. Hourly query cost telemetry per service, team and feature (from system.query_log tags)
CREATE TABLE IF NOT EXISTS finops.query_cost_hourly
(
    hour             DateTime('UTC'),
    service_id       LowCardinality(String),
    team             LowCardinality(String),
    feature          LowCardinality(String),
    db_user          LowCardinality(String),
    queries          UInt64,
    cpu_seconds      Float64,
    read_rows        UInt64,
    read_bytes       UInt64,
    result_bytes     UInt64,
    peak_memory      UInt64,
    refreshed_at     DateTime('UTC') DEFAULT now()
)
ENGINE = ReplacingMergeTree(refreshed_at)                 -- a re-run of the same hour replaces, never doubles
PARTITION BY toYYYYMM(hour)
ORDER BY (service_id, hour, team, feature, db_user)
TTL hour + INTERVAL 400 DAY DELETE
SETTINGS index_granularity = 8192;
Layer 1 · Loaders
Loading the ClickHouse Cloud usage cost API, and query telemetry every hour
The ClickHouse Cloud usage cost API returns ClickHouse Credits (CHC) per entity, day and meter, for at most 31 days per call. Our loader re-sends the last 35 days on every run, so restated days are corrected automatically. It skips the transfer detail meters, which are a breakdown of dataTransferCHC; loading them as well double-counts transfer. The API reference documents every field.
#!/usr/bin/env python3
"""
ClickHouse Cloud FinOps engineering: load the ClickHouse Cloud usage cost API into finops.usage_cost_daily.

Run daily. It re-sends the last 35 days on every run, because days stay open for restatement
until the API marks them locked; ReplacingMergeTree(loaded_at) keeps the newest copy.
Secrets come from the environment only: CH_CLOUD_KEY_ID, CH_CLOUD_KEY_SECRET (API key),
CH_URL, CH_USER, CH_PASSWORD (the ClickHouse service that hosts the finops database).
"""
import base64, json, os, sys, urllib.parse, urllib.request
from datetime import date, timedelta

API = "https://api.clickhouse.cloud/v1/organizations/{org}/usageCost?from_date={f}&to_date={t}"
TRANSFER_DETAIL = {"publicDataTransferCHC", "interRegionTier1DataTransferCHC", "interRegionTier2DataTransferCHC",
                   "interRegionTier3DataTransferCHC", "interRegionTier4DataTransferCHC"}   # breakdown of dataTransferCHC

def basic(user: str, secret: str) -> str:
    return "Basic " + base64.b64encode(f"{user}:{secret}".encode()).decode()

def fetch(org_id: str, start: date, end: date) -> list[dict]:
    """Daily per-entity cost records, in windows of at most 31 days (the API limit)."""
    auth, out, cur = basic(os.environ["CH_CLOUD_KEY_ID"], os.environ["CH_CLOUD_KEY_SECRET"]), [], start
    while cur <= end:
        stop = min(cur + timedelta(days=30), end)
        req = urllib.request.Request(API.format(org=org_id, f=cur, t=stop), headers={"Authorization": auth})
        with urllib.request.urlopen(req, timeout=60) as r:
            out += json.load(r)["result"]["costs"]
        cur = stop + timedelta(days=1)
    return out

def to_rows(org_id: str, records: list[dict]):
    """One row per entity, day and meter; transfer detail meters are skipped to avoid double counting."""
    for rec in records:
        for meter, chc in (rec.get("metrics") or {}).items():
            if meter in TRANSFER_DETAIL or not chc:
                continue
            yield {"usage_date": rec["date"], "organization_id": org_id, "entity_type": rec["entityType"],
                   "entity_id": rec["entityId"], "entity_name": rec.get("entityName") or "",
                   "service_id": rec.get("serviceId") or "", "meter": meter, "chc": chc,
                   "locked": bool(rec.get("locked"))}

def insert(rows) -> int:
    body = "\n".join(json.dumps(r) for r in rows).encode()
    q = urllib.parse.quote("INSERT INTO finops.usage_cost_daily (usage_date, organization_id, entity_type, entity_id, "
                           "entity_name, service_id, meter, chc, locked) FORMAT JSONEachRow")
    req = urllib.request.Request(f"{os.environ['CH_URL']}/?query={q}", data=body, method="POST",
                                 headers={"Authorization": basic(os.environ["CH_USER"], os.environ.get("CH_PASSWORD", ""))})
    urllib.request.urlopen(req, timeout=120).read()
    return body.count(b"\n") + 1 if body else 0

if __name__ == "__main__":
    org = os.environ["CH_CLOUD_ORG_ID"]
    if len(sys.argv) > 2 and sys.argv[1] == "--sample":            # offline test with a saved API response
        records = json.load(open(sys.argv[2]))["result"]["costs"]
    else:
        end = date.today() - timedelta(days=1)
        records = fetch(org, end - timedelta(days=34), end)
    print(f"loaded {insert(to_rows(org, records))} meter-rows from {len(records)} records")

# Lab test: the same synthetic 30-day response loaded twice
# $ python3 e_loader.py --sample sample_usage.json   -> loaded 360 meter-rows from 90 records
# $ python3 e_loader.py --sample sample_usage.json   -> loaded 360 meter-rows from 90 records
# SELECT count() FROM finops.usage_cost_daily          -> 720   (until background merges run)
# SELECT count() FROM finops.usage_cost_daily FINAL    -> 360   (the re-load replaced, it did not double)
Query telemetry comes from a refreshable materialized view. Every hour it rolls the last two closed hours of system.query_log into finops.query_cost_hourly. Failed queries are included, because they consume CPU too. Hours are bucketed in UTC, the timezone in which the bill’s days are defined. Our first run bucketed in server-local time and produced half-hour offsets, which is exactly the class of error a test catches and a dashboard hides.
-- ClickHouse cost telemetry, refreshable materialized view: every hour, roll the last two closed hours of query_log into
-- finops.query_cost_hourly. Re-processing an hour is safe because the target replaces by key.
-- On ClickHouse Cloud, read every replica: FROM clusterAllReplicas('default', system.query_log)
CREATE MATERIALIZED VIEW IF NOT EXISTS finops.mv_query_cost_hourly
REFRESH EVERY 1 HOUR OFFSET 5 MINUTE APPEND
TO finops.query_cost_hourly
AS
SELECT
    toStartOfHour(toTimeZone(event_time, 'UTC'))                      AS hour,     -- bill days are UTC
    'svc-lab'                                                         AS service_id,   -- the service this view runs on
    ifNull(nullIf(extract(log_comment, 'team=([^;]+)'), ''), 'untagged')    AS team,
    ifNull(nullIf(extract(log_comment, 'feature=([^;]+)'), ''), 'untagged') AS feature,
    user                                                              AS db_user,
    count()                                                           AS queries,
    sum(ProfileEvents['OSCPUVirtualTimeMicroseconds']) / 1e6          AS cpu_seconds,
    sum(read_rows)                                                    AS read_rows,
    sum(read_bytes)                                                   AS read_bytes,
    sum(result_bytes)                                                 AS result_bytes,
    max(memory_usage)                                                 AS peak_memory,
    now()                                                             AS refreshed_at
FROM system.query_log
WHERE type IN ('QueryFinish', 'ExceptionWhileProcessing')            -- failed queries cost money too
  AND event_time >= toStartOfHour(now('UTC') - INTERVAL 2 HOUR)
  AND event_time <  toStartOfHour(now('UTC'))
GROUP BY hour, team, feature, db_user;

-- Lab test: SYSTEM REFRESH VIEW finops.mv_query_cost_hourly, then
-- SELECT hour, team, feature, db_user, queries, round(cpu_seconds, 2) AS cpu FROM finops.query_cost_hourly FINAL
-- hour                 team          feature          db_user         queries  cpu
-- 2026-10-16 01:00:00  risk          adhoc            analyst               6  13.55
-- 2026-10-16 01:00:00  risk          adhoc-unbounded  analyst               1   7.12
-- 2026-10-16 01:00:00  untagged      untagged         default              62   5.60
-- 2026-10-16 01:00:00  growth        hourly-traffic   bi_dashboard         91   0.56
-- 2026-10-16 01:00:00  platform      lb-probe         healthcheck         290   0.42
Layer 2 · Allocation engine
Two-level ClickHouse Cloud cost allocation
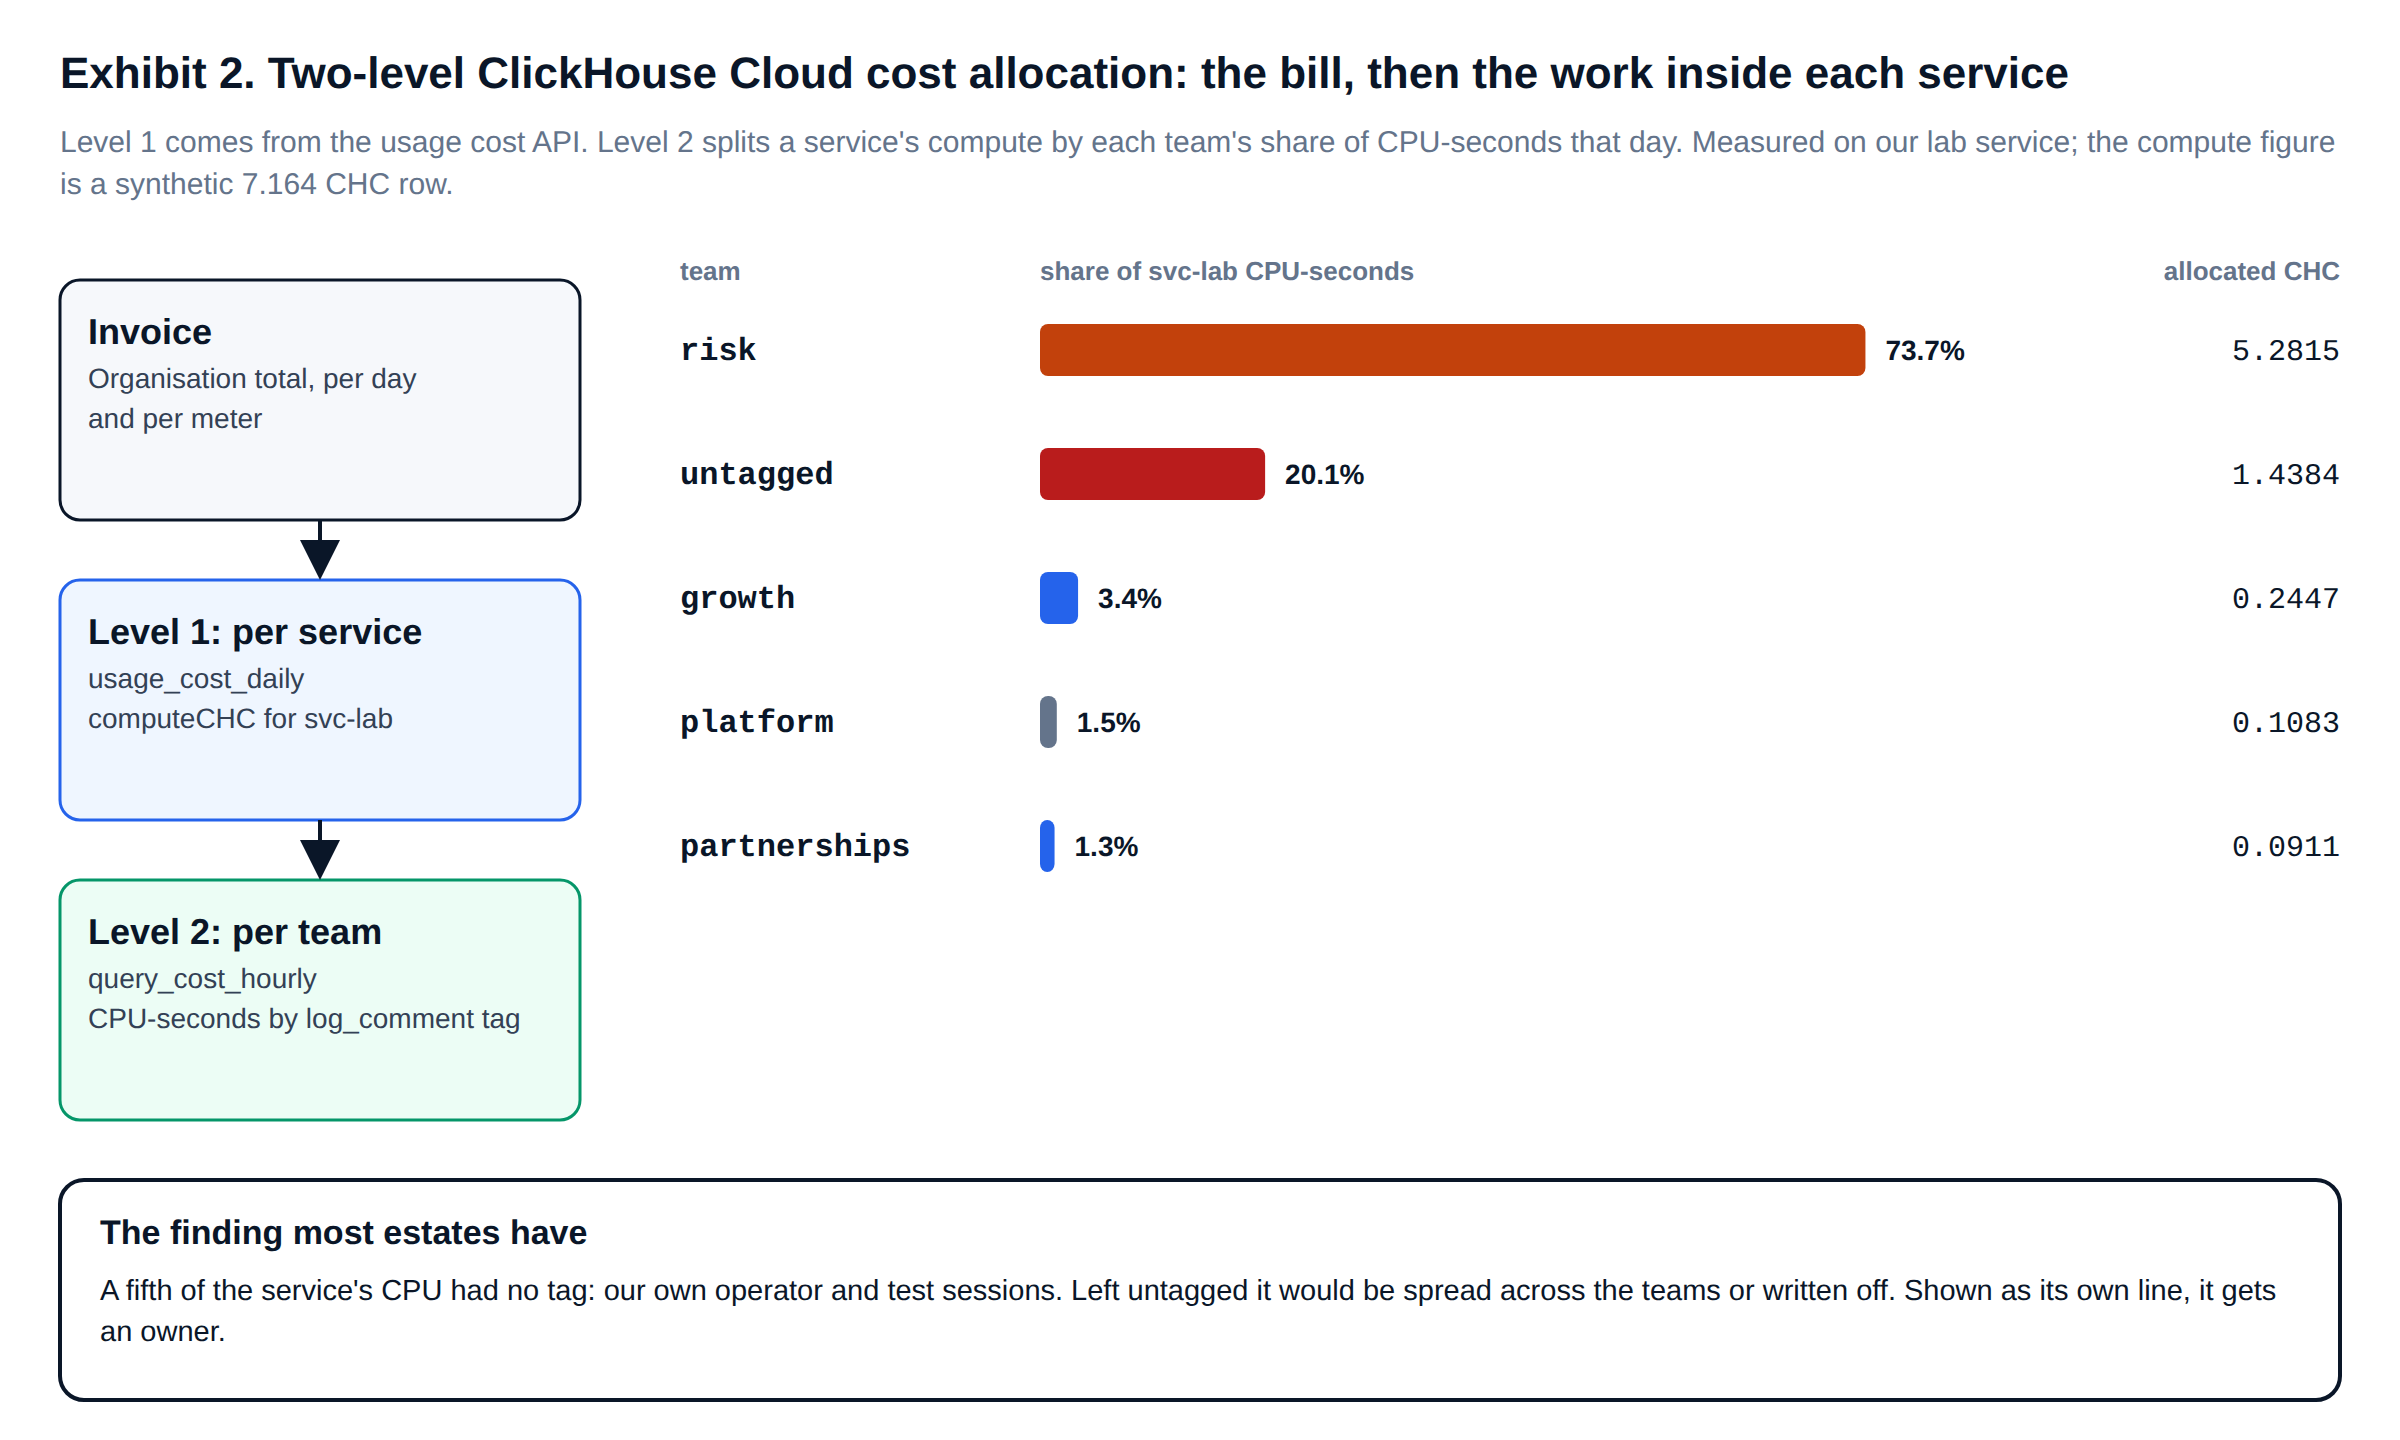
Allocation is where ClickHouse Cloud cost monitoring becomes accountability, and it runs in two levels. Level one comes straight from the bill: what each service cost each day. Level two splits a service’s compute between teams by their share of that day’s CPU-seconds. Untagged work is reported as its own line rather than spread across teams, because spreading it hides the very gap the programme exists to close.
-- ClickHouse Cloud cost monitoring: cost allocation in two levels:
--   level 1, between services: the bill says what each service cost per day and meter;
--   level 2, inside a service: each team's share of the service's CPU-seconds that day splits its compute.
-- Untagged work stays visible as 'untagged' instead of being spread silently across teams.
WITH
compute AS
(
    SELECT usage_date, service_id, sum(chc) AS compute_chc
    FROM finops.usage_cost_daily FINAL
    WHERE meter = 'computeCHC'
      AND usage_date BETWEEN {from:Date} AND {to:Date}
    GROUP BY usage_date, service_id
),
work AS
(
    SELECT toDate(hour) AS usage_date, service_id, team, sum(cpu_seconds) AS cpu_s
    FROM finops.query_cost_hourly FINAL
    WHERE toDate(hour) BETWEEN {from:Date} AND {to:Date}
    GROUP BY usage_date, service_id, team
)
SELECT
    w.service_id                                                               AS service_id,
    w.team                                                                     AS team,
    round(sum(w.cpu_s), 2)                                                     AS cpu_s,
    round(100 * sum(w.cpu_s) / sum(sum(w.cpu_s)) OVER (PARTITION BY w.service_id), 1) AS pct_of_service_cpu,
    round(sum(c.compute_chc * w.cpu_s / t.service_cpu_s), 4)                   AS allocated_compute_chc
FROM work AS w
INNER JOIN compute AS c USING (usage_date, service_id)
INNER JOIN
(
    SELECT usage_date, service_id, sum(cpu_s) AS service_cpu_s FROM work GROUP BY usage_date, service_id
) AS t USING (usage_date, service_id)
GROUP BY w.service_id, w.team
ORDER BY allocated_compute_chc DESC;

-- --param_from=2026-10-16 --param_to=2026-10-16
-- service_id  team          cpu_s  pct_of_service_cpu  allocated_compute_chc
-- svc-lab     risk          20.68                73.7                 5.2815
-- svc-lab     untagged       5.63                20.1                 1.4384
-- svc-lab     growth         0.96                 3.4                 0.2447
-- svc-lab     platform       0.42                 1.5                 0.1083
-- svc-lab     partnerships   0.36                 1.3                 0.0911
The untagged fifth was our own operator and test sessions. Every estate has an equivalent: migration jobs, ad-hoc fixes, monitoring. Once it is a named line, someone tags it or owns it. CPU-seconds are an allocation key, not a reconstruction of the bill: ClickHouse Cloud bills awake capacity, so idle minutes are shared in proportion to the work. Where a service has a large idle share, we report it separately as well.
Layer 3 · Governance guardrails
ClickHouse Cloud cost governance in four layers
Effective ClickHouse Cloud cost governance does not rely on one control. Each layer in Exhibit 3 acts at a different moment and catches what the previous layer missed: a pull request, a query start, an hour of team usage, a day of service spend.
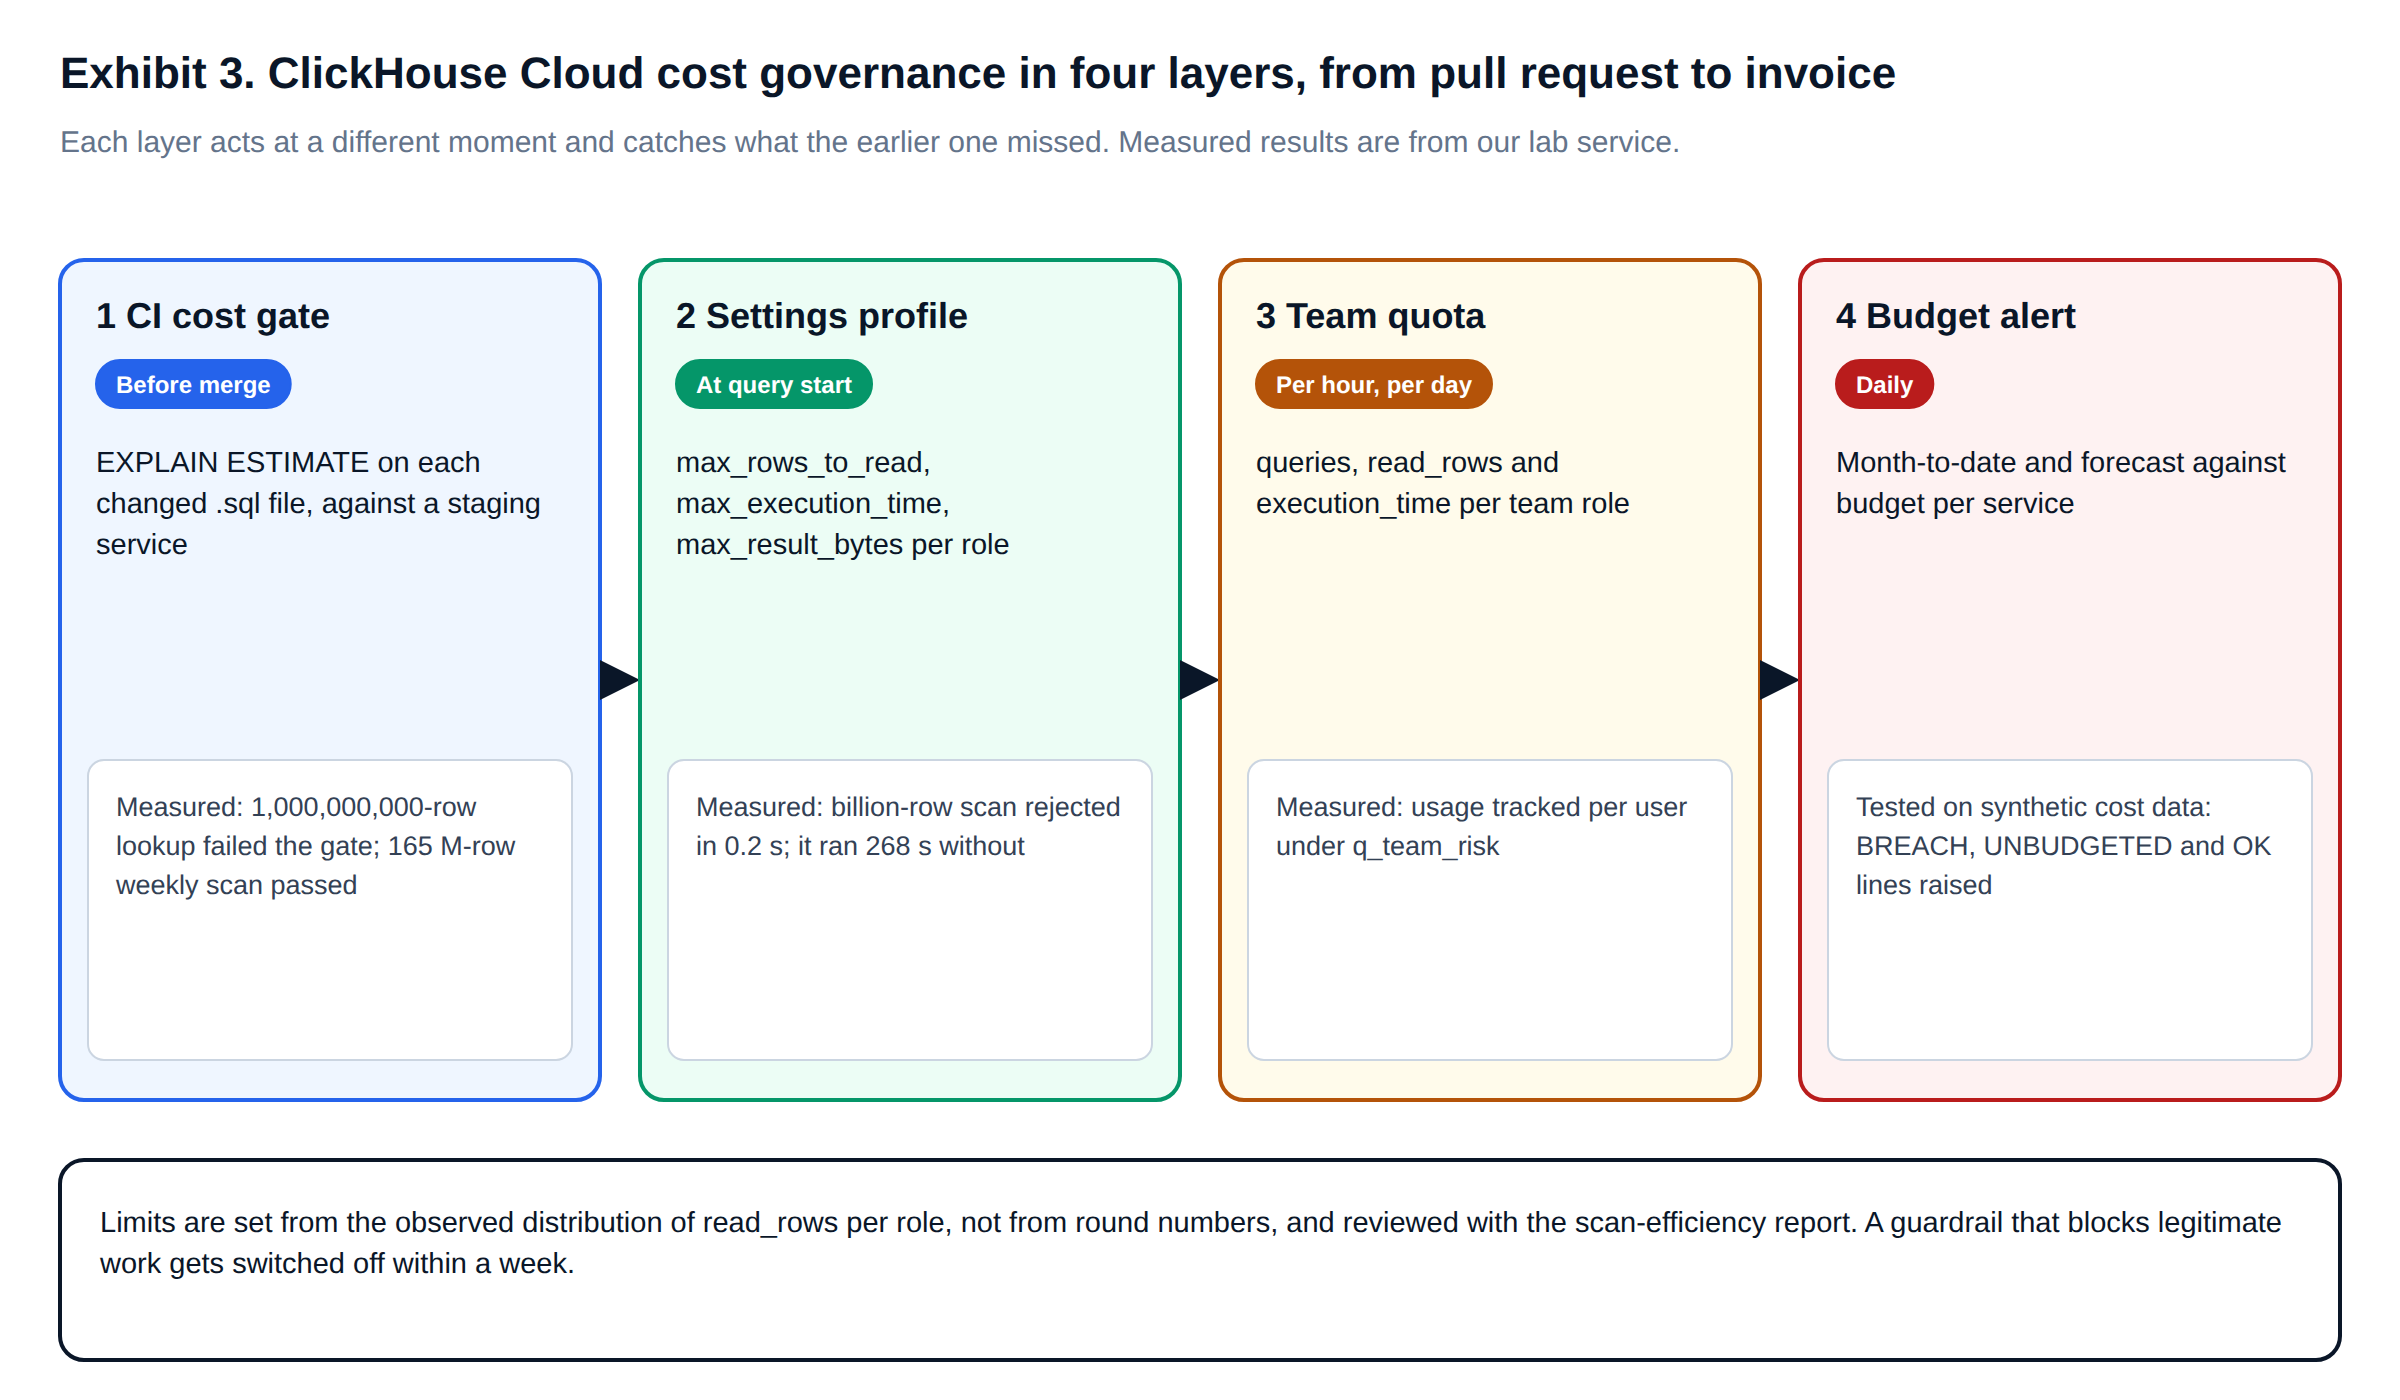
The CI cost gate is the cheapest control to run and the one teams most often lack. For each changed .sql file, it asks a staging service for EXPLAIN ESTIMATE: the rows and marks the primary index says the query would read, without running it. Anything above the budget fails the build.
#!/usr/bin/env python3
"""
ClickHouse Cloud cost governance in CI: fail a pull request whose SQL would scan too much.

For every .sql file changed in the PR, ask the server for EXPLAIN ESTIMATE (rows and marks the
query would read, from the primary index, without running it) and compare against a budget.
Runs against a staging service with production-shaped data. Credentials from the environment.
"""
import base64, os, sys, urllib.parse, urllib.request

MAX_ROWS = int(os.environ.get("COST_GATE_MAX_ROWS", 250_000_000))   # same ceiling as the ad-hoc guardrail

def estimate(sql: str) -> int:
    q = urllib.parse.quote("EXPLAIN ESTIMATE " + sql.strip().rstrip(";"))
    auth = base64.b64encode(f"{os.environ['CH_USER']}:{os.environ.get('CH_PASSWORD', '')}".encode()).decode()
    req = urllib.request.Request(f"{os.environ['CH_URL']}/?query={q}&default_format=TabSeparated",
                                 headers={"Authorization": f"Basic {auth}"})
    out = urllib.request.urlopen(req, timeout=60).read().decode()
    # columns: database, table, parts, rows, marks  (one line per table read)
    return sum(int(line.split("\t")[3]) for line in out.splitlines() if line)

failed = 0
for path in sys.argv[1:]:
    rows = estimate(open(path).read())
    verdict = "FAIL" if rows > MAX_ROWS else "ok"
    failed += verdict == "FAIL"
    print(f"{verdict:4}  {rows:>15,} rows  {path}")
sys.exit(1 if failed else 0)

# Lab test against lab.events (1,000,000,000 rows, ORDER BY (tenant_id, event_time)):
# ok             16,384 rows  ci/tenant_day.sql
# ok        165,030,400 rows  ci/weekly_country.sql
# FAIL    1,000,000,000 rows  ci/user_lookup.sql        -> exit code 1, the pull request is blocked
At runtime, a settings profile on each ad-hoc role rejects the same query in 0.2 seconds, as we measured in our ClickHouse Cloud FinOps metrics study. Above the profile sits a quota per team, so one team cannot spend another’s budget.
-- ClickHouse Cloud cost governance: one role and one quota per team, so no team can spend another's budget;
-- each limit is set from ClickHouse cost telemetry (observed read_rows per role), not from a round number
CREATE ROLE IF NOT EXISTS team_risk;
GRANT SELECT ON lab.events TO team_risk;

CREATE QUOTA IF NOT EXISTS q_team_risk
    KEYED BY user_name
    FOR INTERVAL 1 hour MAX queries = 600, read_rows = 5000000000, execution_time = 1800,
    FOR INTERVAL 1 day  MAX read_rows = 50000000000
    TO team_risk;

GRANT team_risk TO analyst;
SET DEFAULT ROLE team_risk TO analyst;

-- Verified: SELECT quota_name, quota_key, duration, queries, max_queries, read_rows, max_read_rows FROM system.quotas_usage
-- q_team_risk  analyst   3600   1  600    98305   5000000000
-- q_team_risk  analyst  86400   1  \N     98305  50000000000
Limits come from the observed distribution of read_rows per role, not from round numbers. Each is applied first to a non-production service, with its rollback written down: DROP QUOTA or DROP SETTINGS PROFILE restores the previous behaviour immediately.
Layer 4 · Right-sizing model
ClickHouse Cloud right-sizing from measured CPU and memory
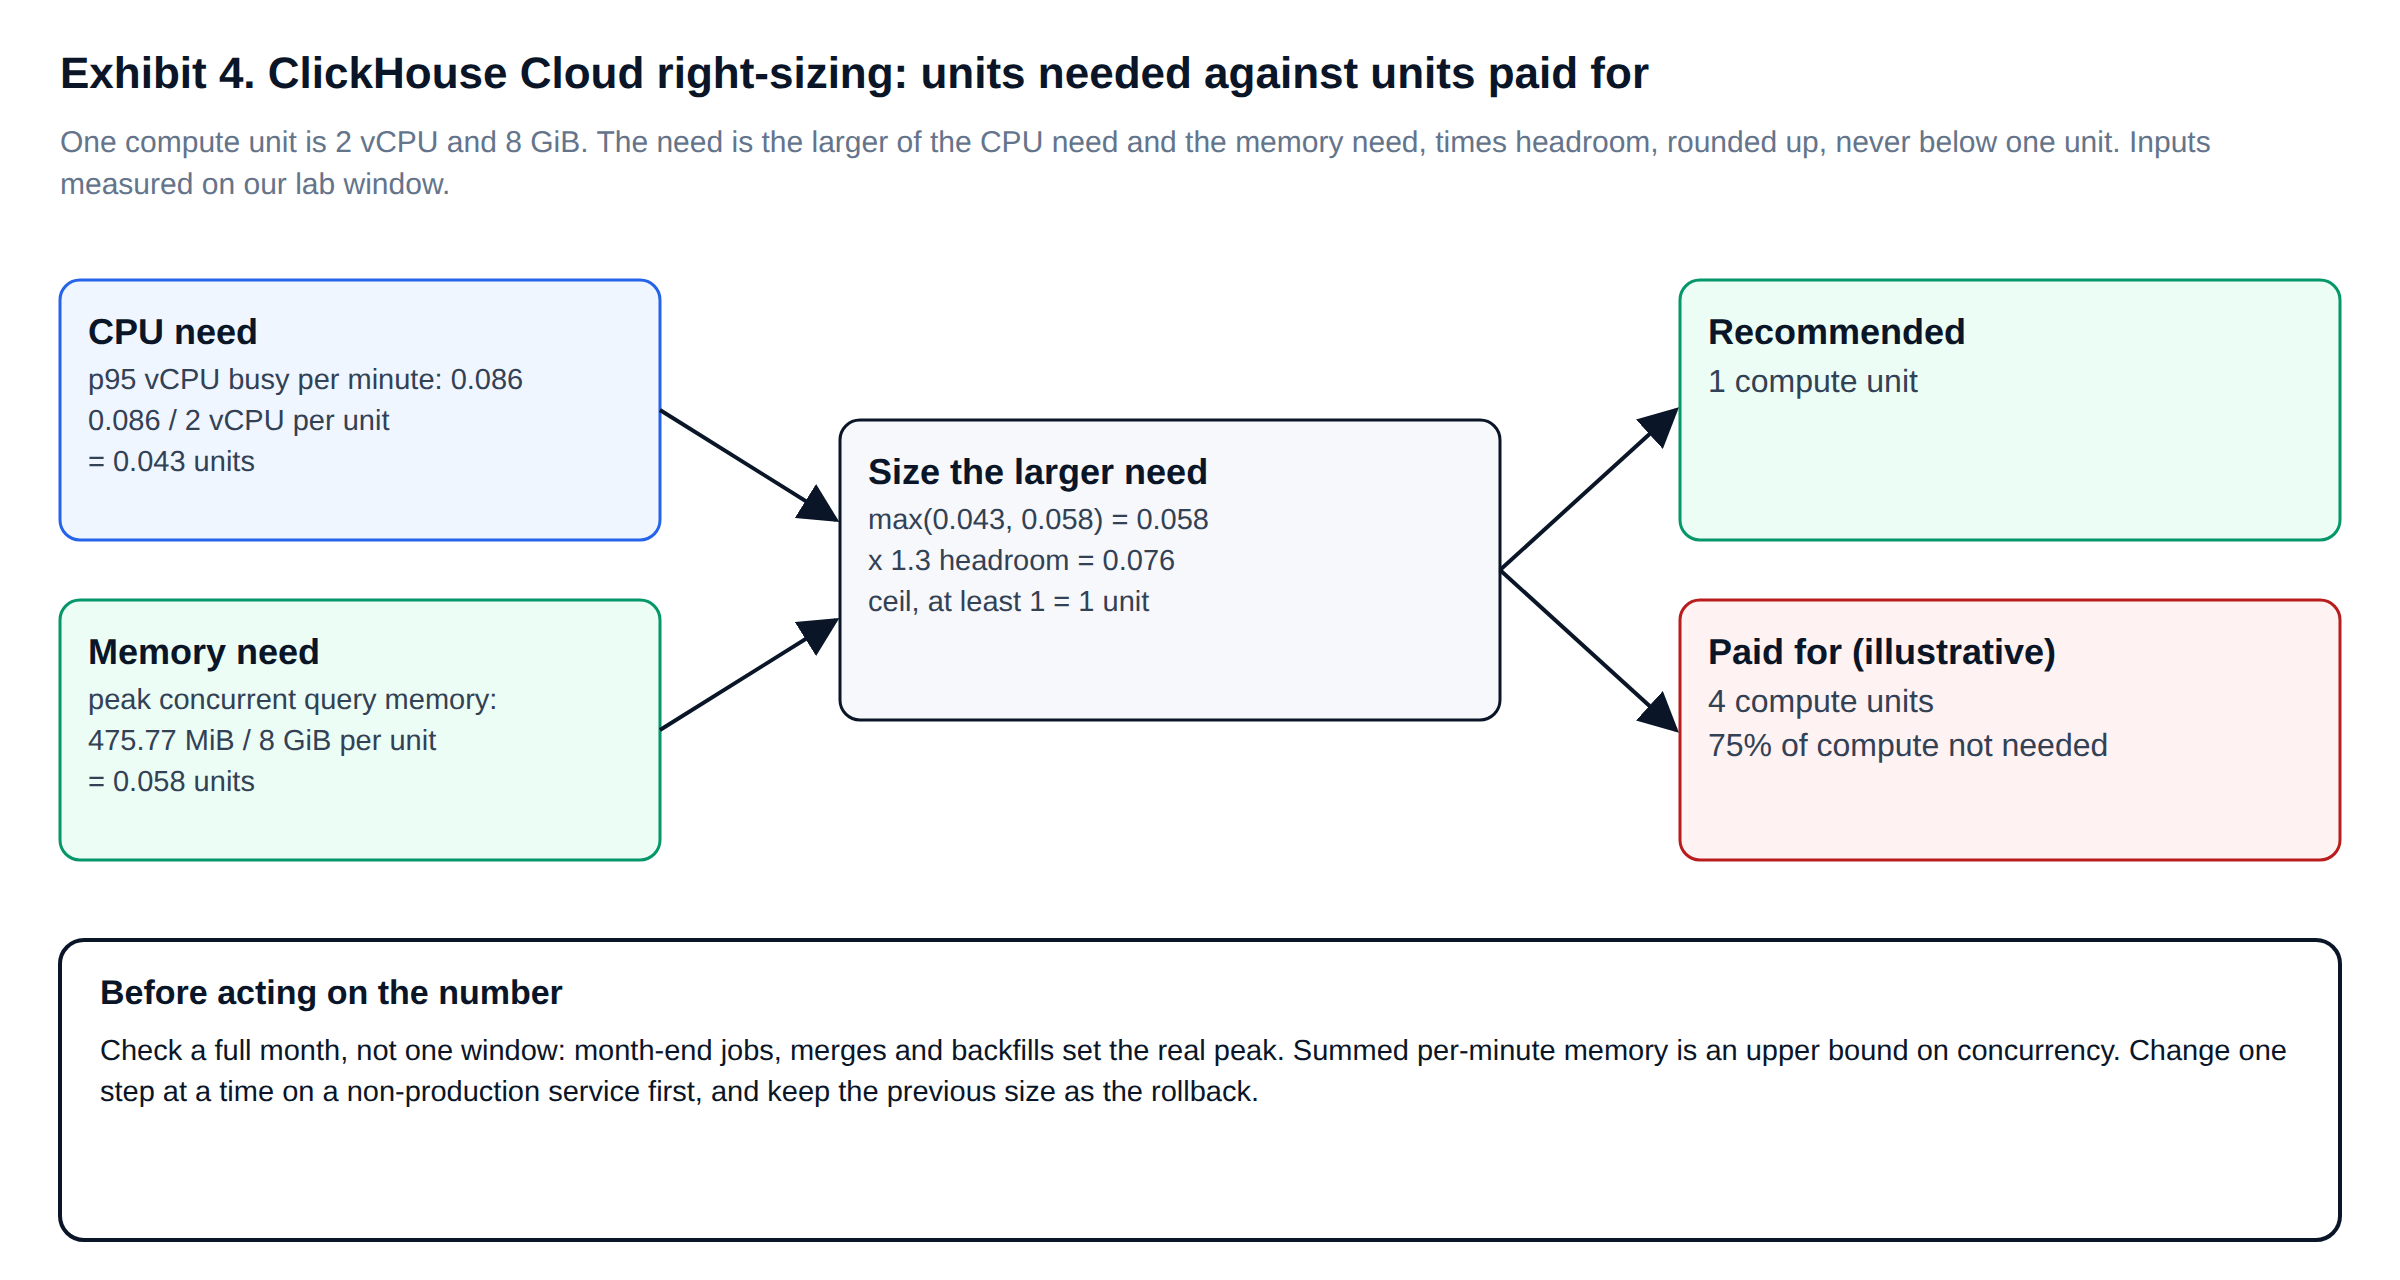
ClickHouse Cloud right-sizing fails in two ways: sizing on CPU and running out of memory, or sizing on memory and paying for idle CPU. Our model takes both. It computes the CPU need from the p95 of per-minute busy vCPUs and the memory need from peak concurrent query memory. It sizes for the larger, applies headroom and never recommends less than one unit.
-- ClickHouse Cloud right-sizing: how many compute units the measured work actually needs.
-- One unit = 2 vCPU and 8 GiB. Sizing takes the larger of the CPU need (p95 per-minute vCPU)
-- and the memory need (peak concurrent query memory), plus headroom, and never goes below one unit.
WITH
    {headroom:Float64}       AS headroom,          -- e.g. 1.3 = 30% spare
    {current_units:UInt32}   AS current_units,
per_query AS
(
    SELECT
        range(toUInt32(toStartOfMinute(query_start_time)), toUInt32(event_time) + 1, 60) AS minutes,
        ProfileEvents['OSCPUVirtualTimeMicroseconds'] / 1e6 / length(minutes)            AS cpu_per_minute,
        memory_usage
    FROM system.query_log
    WHERE type = 'QueryFinish'
      AND event_time BETWEEN {from:DateTime} AND {to:DateTime}
),
per_minute AS
(
    SELECT
        arrayJoin(minutes)       AS minute,
        sum(cpu_per_minute) / 60 AS vcpu_busy,         -- average vCPUs busy in that minute
        sum(memory_usage)        AS mem_bytes          -- upper bound: queries overlapping in that minute
    FROM per_query
    GROUP BY minute
)
SELECT
    round(quantile(0.95)(vcpu_busy), 3)                                        AS p95_vcpu_busy,
    formatReadableSize(max(mem_bytes))                                         AS peak_query_memory,
    greatest(1, toUInt32(ceil(greatest(quantile(0.95)(vcpu_busy) / 2,
                                       max(mem_bytes) / (8 * 1073741824)) * headroom)))  AS recommended_units,
    current_units,
    round(100 * (1 - recommended_units / current_units), 1)                    AS compute_saving_pct
FROM per_minute
FORMAT Vertical;

-- --param_headroom=1.3 --param_current_units=4   (current_units is an illustrative input)
-- p95_vcpu_busy:      0.086
-- peak_query_memory:  475.77 MiB
-- recommended_units:  1
-- current_units:      4
-- compute_saving_pct: 75
A single window is not a ClickHouse Cloud right-sizing decision. We run the model over at least a month, including month-end jobs, merges and backfills. We then propose one step at a time with the previous size as the rollback, and confirm the result in the next month’s telemetry. Autoscaling bounds, idling and replica counts are reviewed in the same change.
Engineering standards
How we engineer ClickHouse Cloud FinOps platforms and ClickHouse cost telemetry
| Standard | How it is enforced |
|---|---|
| Every number is reproducible | Each metric is a versioned SQL file with a test against known data |
| Explicit engines, no defaults | Every table declares its engine, version column, sort key, partition key and granularity |
| Idempotent loads | Re-running any loader or refresh replaces rows by key; it never doubles them |
| UTC everywhere | Telemetry buckets and bill days share one timezone |
| Least privilege | Loaders write only to finops; readers hold SELECT on system tables and finops |
| Secrets out of code | API keys and passwords come from the environment or a secret store, never the repository |
| Reversible guardrails | Every limit ships with its rollback and is applied to non-production first |
Engagement
What a ClickHouse Cloud FinOps engineering engagement delivers
| Deliverable | Form | Acceptance test |
|---|---|---|
| Cost telemetry warehouse | DDL and migrations in your repository | A full re-load reconciles to the usage cost API totals |
| Usage cost loader and telemetry rollup | Scheduled jobs with runbooks | Seven consecutive green daily runs |
| Tagging standard | log_comment format, per-user defaults, SDK snippets | Untagged share below an agreed threshold |
| Allocation and showback | SQL and a dashboard on the finops database | Allocated totals equal billed totals per service |
| Guardrails | CI gate, settings profiles, quotas | Known runaway query blocked; known legitimate query passes |
| Right-sizing report | Model output with a staged change plan | Reviewed and signed off by the service owner |
Scope and duration depend on the number of services and how much tagging already exists, and are agreed after a short discovery call. All advice is tested on non-production services before it reaches production, and we expect a tested backup and recovery posture to be in place before any sizing change.
Evidence and limits
How this ClickHouse Cloud FinOps engineering was tested
Every SQL file and script on this page ran on our lab service: open-source ClickHouse 26.9.17.8 on 2 vCPU, a 1-billion-row event table and a compressed business-day workload. Billing input was a synthetic usage cost response we generated in the documented schema, not a client’s bill. On ClickHouse Cloud, telemetry queries read all replicas with clusterAllReplicas.
FAQ
ClickHouse Cloud FinOps engineering: common questions
What does ClickHouse Cloud FinOps engineering include?
A cost telemetry warehouse fed by the usage cost API and system.query_log, a two-level allocation engine, guardrails from CI to runtime, and a right-sizing model. All of it is code in your repository.
How does ClickHouse Cloud cost monitoring attribute spend to teams?
Queries carry a log_comment tag such as team=growth;feature=hourly-traffic. Each service’s compute is split by each team’s share of CPU-seconds, and untagged work stays a visible line.
How often should the ClickHouse Cloud usage cost API be loaded?
Daily, re-sending the last 35 days so restated days correct themselves. The API returns at most 31 days per call, so longer ranges are split.
Can ClickHouse Cloud right-sizing be automated?
The calculation can; the decision should not be. We automate the model and the monthly report, and a service owner approves each staged change with a rollback.
Does ClickHouse cost telemetry add load to the service?
Very little: one hourly aggregation over two hours of query_log and one small daily insert. In our lab the hourly refresh took 13 ms and each daily load under 60 ms.
Related
More from ChistaDATA on ClickHouse Cloud costs
Managed ClickHouse Cloud FinOps: our desk operates this platform for you, with daily alerts and a monthly FinOps pack. ClickHouse Cloud FinOps metrics: the twelve-metric scorecard behind it. How expensive queries become a large ClickHouse Cloud bill. DBaaS optimization across clouds.
Measurements: ChistaDATA lab, 16 October 2026, ClickHouse 26.9.17.8. Billing inputs synthetic. Test every recommendation on a non-production service before applying it to production, and maintain a robust DR posture.
ChistaDATA
Engineer ClickHouse Cloud FinOps into your platform
ChistaDATA builds the cost telemetry warehouse, allocation engine, guardrails and right-sizing model on your own services, on open-source ClickHouse tooling, with zero vendor lock-in. Our engineers stay with it through handover, backed by 24×7×365 ClickHouse support with a 15-minute Severity 1 response.