ChistaDATA perspective · ClickHouse Cloud FinOps · October 2026
ClickHouse Cloud bills are rarely high because the platform is expensive. They are high because nobody can say which team, feature or habit produced each line of the invoice, so nobody can be asked to change it. ClickHouse Cloud FinOps closes that gap. It turns five billing meters into twelve FinOps metrics that finance can read and engineering can act on.
This paper sets out those twelve metrics: the formula for each, the data that feeds it and a starting threshold. It also gives the SQL and Python that compute them, and the operating rhythm that keeps them honest. The figures come from a measured workload on our own lab service and are priced at published ClickHouse Cloud pricing. Where a figure is synthetic or illustrative, we say so.
The short answer
What ClickHouse Cloud FinOps changes, in four points
Teams that ask us to cut a ClickHouse Cloud bill usually expect a list of slow queries. The list helps, but it treats a symptom. In our experience, durable ClickHouse Cloud cost optimization comes from four management changes, each tied to metrics later in this paper:
- Allocate before you optimize. Untagged spend has no owner, and spend without an owner is not reduced. Allocation coverage is the first of the FinOps metrics we put on a scorecard.
- Price work, not queries. In our lab, the busiest consumer by query count was among the cheapest by CPU. ClickHouse Cloud cost allocation must follow CPU-seconds, bytes returned and bytes stored, not request counts.
- Measure what you pay for but do not use. Compute is billed while a service is awake, used or not. Utilization and idle-awake time expose the gap between provisioned and consumed capacity.
- Govern the commitment. A burn index and a daily anomaly score turn the invoice from a monthly surprise into a weekly forecast.
Anatomy of the invoice
ClickHouse Cloud pricing and billing: the five meters behind every invoice
ClickHouse Cloud billing is usage-based, and every metric in this paper traces back to one of the meters below. The rates are the list rates published on the ClickHouse Cloud pricing page when we checked it on 16 October 2026, for its reference configuration. They differ by cloud provider and region, and negotiated commitments change the effective rate, so treat them as a model input, not a quote.
| Meter | How it is measured | List rate used in this paper | ClickHouse Cloud FinOps metric it feeds |
|---|---|---|---|
| Compute | Compute units per minute; one unit is 8 GiB of memory and 2 vCPU | $0.2181 (Basic), $0.2985 (Scale), $0.3903 (Enterprise) per unit-hour | Utilization, idle-awake ratio, unit cost, scan efficiency |
| Storage | Compressed data, per TB-month | $25.30 per TB-month | Cold-data share, compression ratio |
| Backups | Billed separately from data; by default one backup retained for one day | Storage rate on backup volume | Backup-to-data ratio |
| Data transfer | Bytes leaving the service: to the public internet, or across regions | $0.1152 per GB public; from $0.0312 per GB inter-region | Egress intensity |
| ClickPipes | Managed ingestion, billed as its own entity | See the pricing page | Cost mix, allocation coverage |
Two properties of ClickHouse Cloud pricing drive most of the analysis that follows. First, compute is billed per minute for the capacity that is awake, not for the CPU a query uses. A service at 2% utilization costs the same per minute as one at 90%. Second, storage is billed on compressed bytes, so a schema that compresses poorly is a recurring charge, not a one-off inefficiency. The ClickHouse Cloud billing overview documents the meters in full, including how Basic services pause after a period of inactivity.
The unit conversion used throughout is simple. At the Scale rate, one unit-hour buys 2 vCPU for 3,600 seconds, or 7,200 vCPU-seconds. One vCPU-second of awake capacity therefore costs $0.2985 / 7,200 = $0.0000415. Every CPU figure in this paper converts to dollars with that factor.
The scorecard
Twelve FinOps metrics for ClickHouse Cloud, and where each one comes from
Exhibit 1 is the structure we use. Finance owns the inform metrics, engineering the optimize metrics, and leadership the operate metrics. Each of the FinOps metrics can be computed from data a customer already holds: the organisation’s usage cost API and the service’s own system tables. No agent or third-party tool is required.
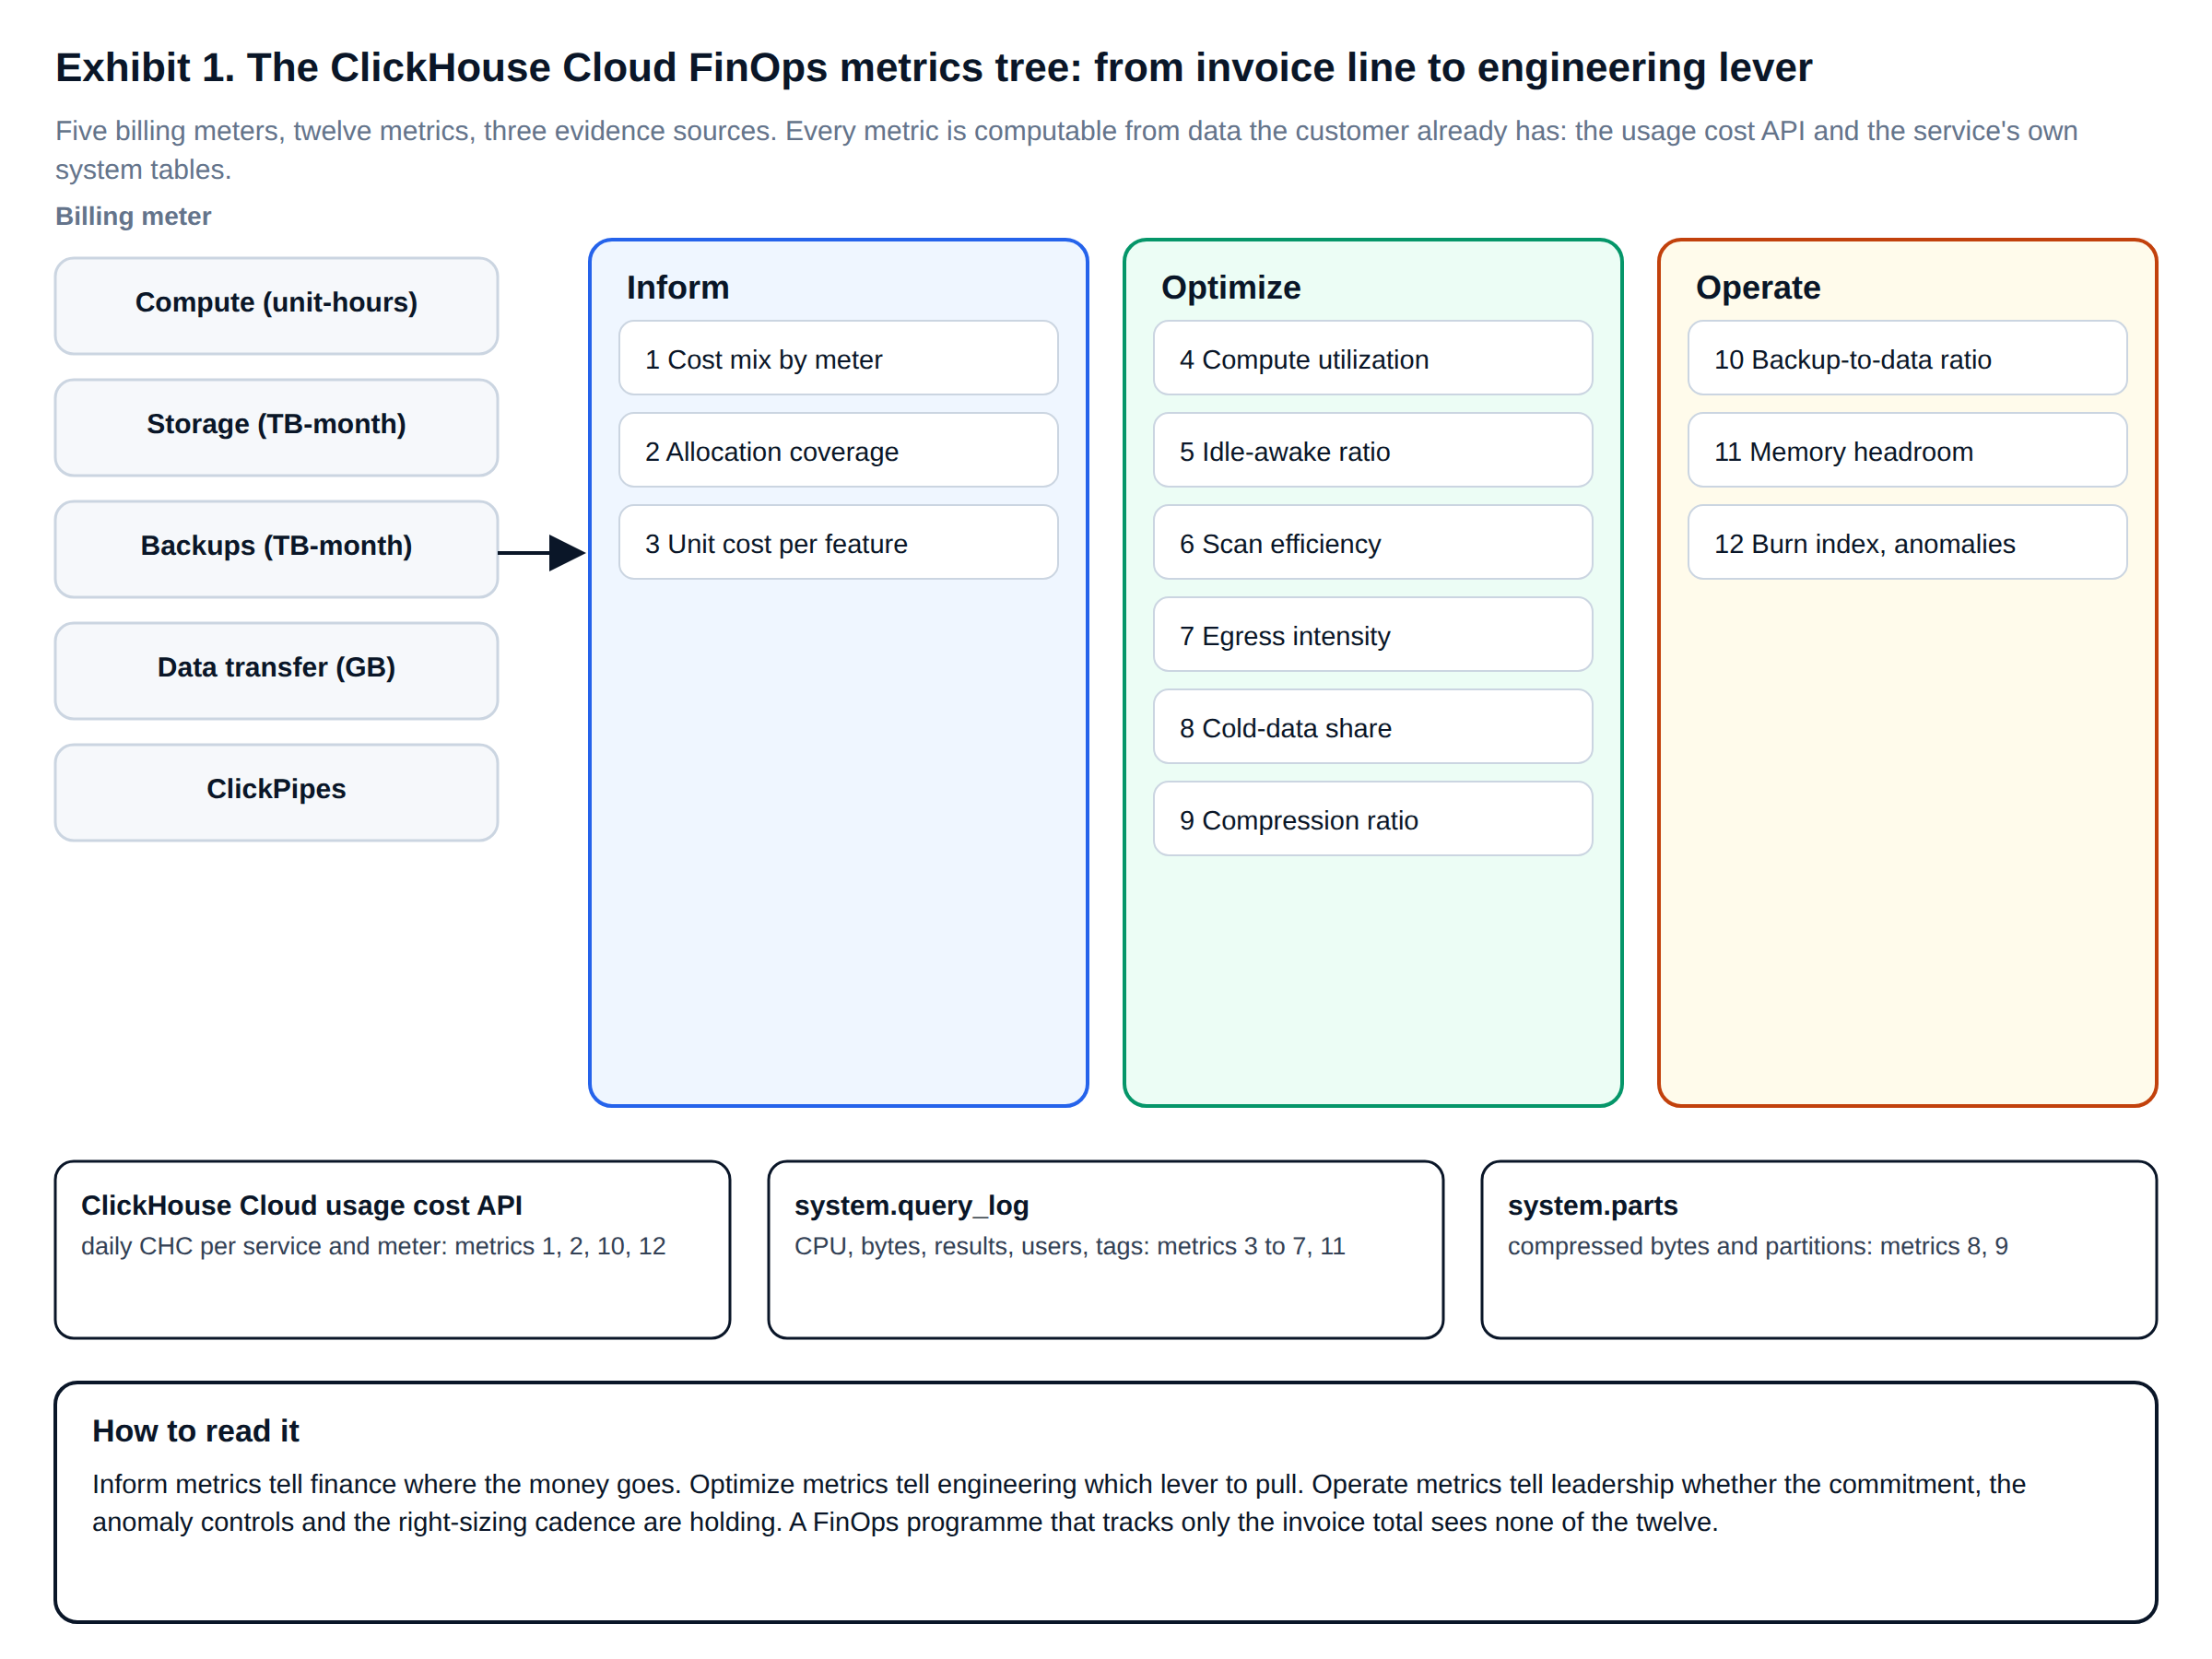
| # | Metric | Formula | Source | Starting threshold |
|---|---|---|---|---|
| 1 | Cost mix by meter | meter CHC ÷ total CHC | Usage cost API | Review if any meter moves more than 10 points in a month |
| 2 | Allocation coverage | CHC on owned services ÷ total CHC | Usage cost API and an owner map | At least 95% |
| 3 | Unit cost per feature | CPU-seconds × price ÷ business units | system.query_log tags | Trend, not level: alert on a 25% week-on-week rise |
| 4 | Compute utilization | consumed CPU-seconds ÷ provisioned vCPU-seconds | system.query_log | Below 20% for a month: right-size |
| 5 | Idle-awake ratio | awake minutes with no business query ÷ awake minutes | system.query_log | Above 25%: review idling and probes |
| 6 | Scan efficiency | rows read ÷ rows returned, per query fingerprint | system.query_log | Any fingerprint above 1 million |
| 7 | Egress intensity | result bytes × transfer rate ÷ compute cost, per consumer | system.query_log | Above 1×: review where the consumer runs |
| 8 | Cold-data share | compressed bytes in partitions no query read ÷ compressed bytes | system.parts, system.query_log | Above 50% on a table without TTL |
| 9 | Compression ratio | uncompressed bytes ÷ compressed bytes | system.parts | Below 3 on wide event tables: review codecs and types |
| 10 | Backup-to-data ratio | backup CHC ÷ storage CHC | Usage cost API | Rising without a change in retention policy |
| 11 | Memory headroom | peak query memory ÷ replica memory | system.query_log | p99 below 25% for a month: candidate to scale down |
| 12 | Burn index and anomaly score | days left in term ÷ runway days; daily z-score | Usage cost API, credit balance | Burn index outside 0.8 to 1.1; |z| above 3 |
The thresholds are where we start a first review cycle, not industry benchmarks. Each should be recalibrated against a service’s own baseline after a quarter of data.
Inform · metrics 1 and 2
Cost mix and allocation coverage from the ClickHouse Cloud billing API
The organisation-level view starts with the usage cost endpoint of the ClickHouse Cloud API. It returns, per UTC day and per entity (a warehouse, a service or a ClickPipe), the ClickHouse Credits (CHC) consumed on each meter. Requests cover at most 31 days, and authentication is HTTP Basic with an API key. The usage cost API reference documents the fields. One detail matters for ClickHouse Cloud FinOps arithmetic: the public and inter-region transfer fields are a breakdown of dataTransferCHC. Summing all of them double-counts transfer.
#!/usr/bin/env python3
"""
ClickHouse Cloud FinOps: pull daily usage cost from the ClickHouse Cloud billing API and derive
the organisation-level FinOps metrics (cost mix, allocation coverage, burn index, anomaly score).

Endpoint: GET https://api.clickhouse.cloud/v1/organizations/{organizationId}/usageCost
          ?from_date=YYYY-MM-DD&to_date=YYYY-MM-DD   (maximum 31 days per request)
Auth:     HTTP Basic with an API key id and secret, read from the environment, never hard-coded.
Amounts:  ClickHouse Credits (CHC), per entity (datawarehouse, service, clickpipe) per UTC day.
"""
import base64, json, os, statistics, sys, urllib.request
from collections import defaultdict
from datetime import date, timedelta

API = "https://api.clickhouse.cloud/v1/organizations/{org}/usageCost?from_date={f}&to_date={t}"

def fetch(org_id: str, start: date, end: date) -> list[dict]:
    """Return the daily per-entity cost records, splitting the range into 31-day windows."""
    token = base64.b64encode(f"{os.environ['CH_CLOUD_KEY_ID']}:{os.environ['CH_CLOUD_KEY_SECRET']}".encode()).decode()
    records, cur = [], start
    while cur <= end:
        stop = min(cur + timedelta(days=30), end)
        req = urllib.request.Request(API.format(org=org_id, f=cur, t=stop), headers={"Authorization": f"Basic {token}"})
        with urllib.request.urlopen(req, timeout=60) as r:
            records += json.load(r)["result"]["costs"]
        cur = stop + timedelta(days=1)
    return records

# These five meters are a breakdown of dataTransferCHC; counting them as well would double-count transfer
TRANSFER_DETAIL = {"publicDataTransferCHC", "interRegionTier1DataTransferCHC", "interRegionTier2DataTransferCHC",
                   "interRegionTier3DataTransferCHC", "interRegionTier4DataTransferCHC"}

def finops_metrics(records: list[dict], owners: dict[str, str], remaining_chc: float, days_left_in_term: int) -> dict:
    """owners maps serviceId -> owning team; anything unmapped counts as unallocated spend."""
    mix = defaultdict(float)                        # metric 1: ClickHouse Cloud cost mix by meter
    by_day = defaultdict(float)                     # daily total, for the anomaly score
    allocated = unallocated = 0.0                   # metric 2: ClickHouse Cloud cost allocation coverage
    for rec in records:
        for meter, chc in (rec.get("metrics") or {}).items():
            if meter not in TRANSFER_DETAIL:
                mix[meter] += chc or 0.0
        by_day[rec["date"]] += rec["totalCHC"]
        if rec.get("serviceId") in owners: allocated += rec["totalCHC"]
        else: unallocated += rec["totalCHC"]
    total = sum(by_day.values())
    days = sorted(by_day)
    # metric 12b: the latest day's spend against the trailing 14-day mean and standard deviation
    tail = [by_day[d] for d in days[-15:-1]]
    z = (by_day[days[-1]] - statistics.mean(tail)) / (statistics.pstdev(tail) or 1.0) if len(tail) >= 7 else None
    run_rate = sum(by_day[d] for d in days[-30:]) / len(days[-30:])   # trailing 30-day CHC per day
    runway = remaining_chc / run_rate if remaining_chc else None    # days the remaining commitment lasts
    return {
        "total_chc": round(total, 2),
        "cost_mix_pct": {m: round(100 * v / total, 1) for m, v in sorted(mix.items(), key=lambda kv: -kv[1]) if v},
        "allocation_coverage_pct": round(100 * allocated / total, 1) if total else None,
        "unallocated_chc": round(unallocated, 2),
        "runway_days": round(runway) if runway else None,
        # metric 12a: above 1.0 the credits run out before the term ends; well below 1.0 they expire unused
        "commit_burn_index": round(days_left_in_term / runway, 2) if runway else None,
        "latest_day_zscore": round(z, 2) if z is not None else None,
    }

if __name__ == "__main__":
    if len(sys.argv) > 1 and sys.argv[1] == "--sample":     # offline check against a saved response
        records = json.load(open(sys.argv[2]))["result"]["costs"]
    else:
        end = date.today() - timedelta(days=1)
        records = fetch(os.environ["CH_CLOUD_ORG_ID"], end - timedelta(days=89), end)
    owners = json.load(open(os.environ.get("FINOPS_OWNERS", "owners.json")))
    print(json.dumps(finops_metrics(records, owners,
                                    remaining_chc=float(os.environ.get("REMAINING_CHC", 0)),   # from the credit balance endpoint
days_left_in_term=int(os.environ.get("DAYS_LEFT_IN_TERM", 0))), indent=2))We tested this script offline against a 30-day response we generated in the documented schema, not against a real organisation’s bill. Its output below shows the shape of the result, not a benchmark: total 3,333.49 CHC, compute 81.2% of the mix, allocation coverage 93.1%, a burn index of 1.53 and a latest-day z-score of 2.58.
$ REMAINING_CHC=12000 DAYS_LEFT_IN_TERM=165 python3 usage_cost.py --sample sample_usage.json
{
  "total_chc": 3333.49,
  "cost_mix_pct": {"computeCHC": 81.2, "storageCHC": 14.7, "backupCHC": 2.5, "dataTransferCHC": 1.6},
  "allocation_coverage_pct": 93.1,
  "unallocated_chc": 229.48,
  "runway_days": 108,
  "commit_burn_index": 1.53,
  "latest_day_zscore": 2.58
}
Read as a steering committee would, that synthetic result says three things. Compute dominates, so the optimize metrics on compute come first. Almost 7% of spend has no owner, below the 95% coverage threshold, so someone must claim it before the next review. And at the current run rate the commitment runs out 57 days before the term ends. That is a renegotiation conversation to have now, not at renewal.
Inform · metric 3
ClickHouse Cloud cost allocation below the service: showback by team and feature
The billing API stops at the service. Most organisations run several teams on one service, so ClickHouse Cloud cost allocation needs a second layer, inside the service. We use the log_comment setting: every application, dashboard and job identifies its team and feature in a fixed format, and system.query_log records it with each query’s CPU, bytes and memory. Database users identify the consumer; tags identify the business purpose. Both are needed, because one service account often serves many features.
-- ClickHouse Cloud cost allocation: set once per role, overridable per query by the application
ALTER USER bi_dashboard SETTINGS log_comment = 'team=growth;feature=unassigned';

-- An application sets the feature it is serving, per query or per session
SELECT count()
FROM lab.events
WHERE event_date = today()
SETTINGS log_comment = 'team=growth;feature=hourly-traffic';
We then ran a compressed business day against our lab service for eight minutes. A load-balancer probe sent SELECT 1 every two seconds. Two dashboard tiles refreshed every three seconds. An analyst ran a week-long scan every 20 seconds, plus one query filtering on a column outside the sort key. A partner export pulled 500,000 raw rows a minute. The showback query converts each team’s CPU-seconds to dollars at the Scale rate.
-- ClickHouse Cloud FinOps metric 3: unit cost and showback by team and feature (from log_comment tags)
-- On ClickHouse Cloud, read every replica: FROM clusterAllReplicas('default', system.query_log)
WITH
    {unit_price:Float64} / 7200                                              AS usd_per_vcpu_second,   -- 1 unit = 2 vCPU for 1 hour
    extract(log_comment, 'team=([^;]+)')                                      AS team,
    extract(log_comment, 'feature=([^;]+)')                                   AS feature
SELECT
    team,
    feature,
    count()                                                                   AS queries,
    round(sum(ProfileEvents['OSCPUVirtualTimeMicroseconds']) / 1e6, 2)        AS cpu_s,
    round(100 * cpu_s / sum(cpu_s) OVER (), 1)                                AS pct_of_cpu,
    round(cpu_s * usd_per_vcpu_second, 6)                                     AS cpu_usd,
    round(1e6 * cpu_usd / queries, 2)                                         AS usd_per_million_queries
FROM system.query_log
WHERE type = 'QueryFinish'
  AND event_time BETWEEN {from:DateTime} AND {to:DateTime}
  AND log_comment != ''
GROUP BY team, feature
ORDER BY cpu_s DESC;

-- clickhouse-client --param_unit_price=0.2985 --param_from='2026-10-16 06:41:44' --param_to='2026-10-16 06:49:54'
-- team          feature           queries  cpu_s  pct_of_cpu  cpu_usd   usd_per_million_queries
-- risk          adhoc                   6  13.55        60.7  0.000562                    93.67
-- risk          adhoc-unbounded         1   7.12        31.9  0.000295                      295
-- growth        hourly-traffic         91   0.56         2.5  0.000023                     0.25
-- growth        tenant-overview        91   0.40         1.8  0.000017                     0.19
-- partnerships  raw-feed                5   0.36         1.6  0.000015                        3
-- platform      lb-probe              240   0.35         1.6  0.000015                     0.06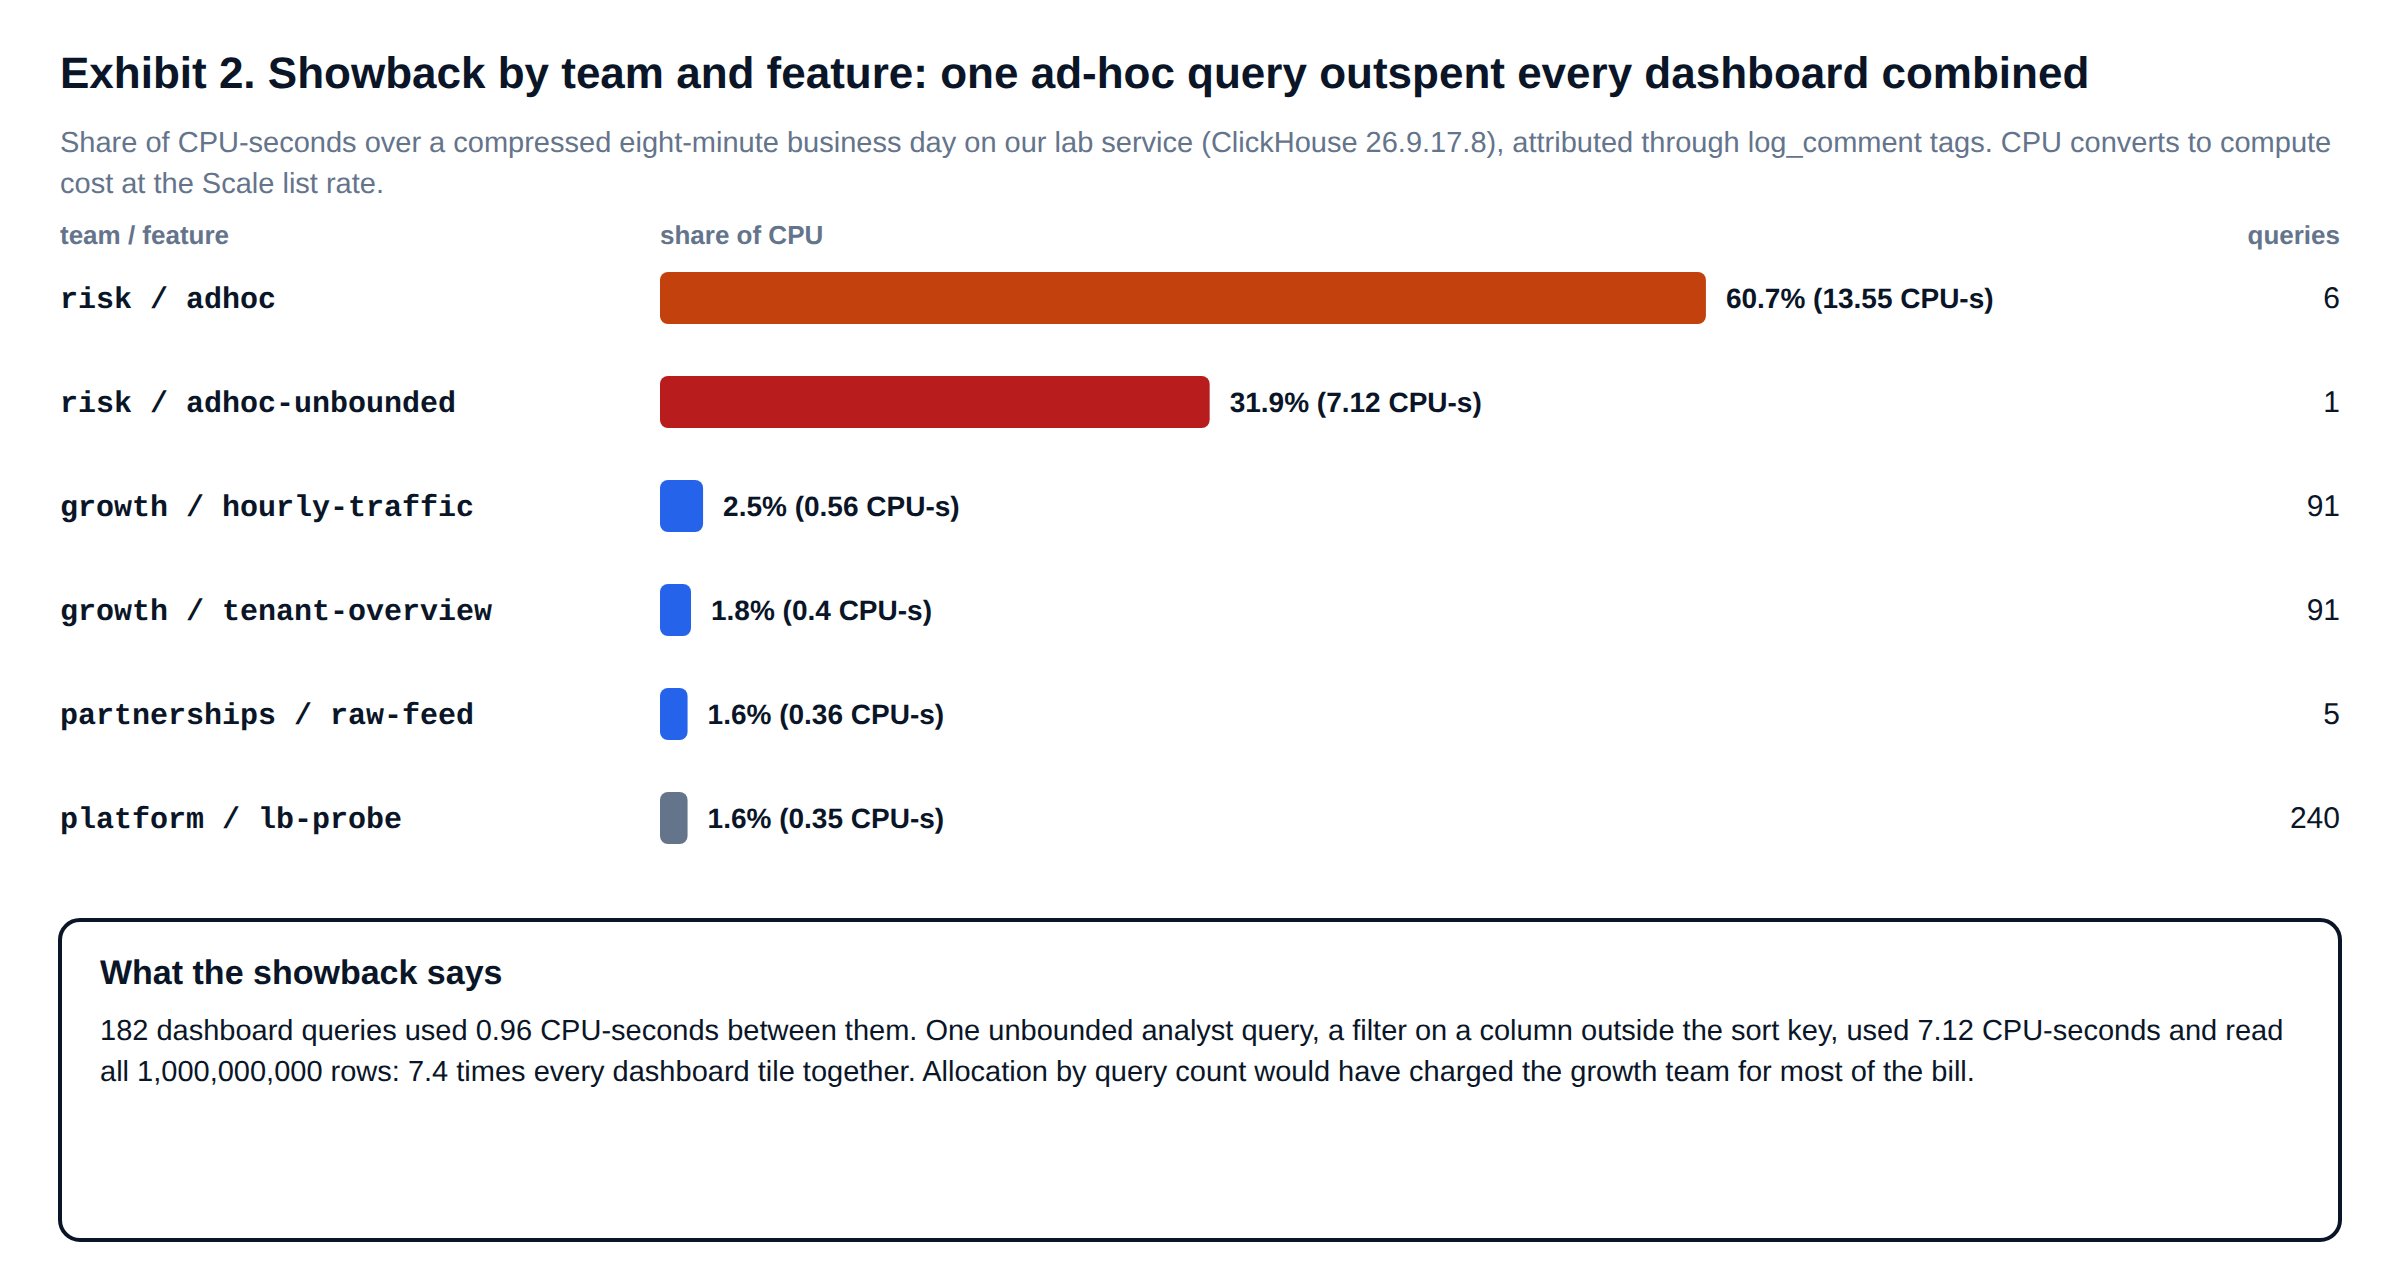
The result inverts the intuition most budget owners hold. The growth team issued 182 of the 434 tagged queries and consumed 0.96 CPU-seconds. A single unbounded analyst query consumed 7.12 CPU-seconds, 7.4 times every dashboard tile together. Allocating by query count would have charged growth for most of the bill, and the team responsible would never have seen it. The dollar amounts are tiny because the window was eight minutes on one small service. The ratios are what scale.
Optimize · metrics 4 and 5
Compute utilization and idle-awake time: the gap ClickHouse Cloud pricing bills for
Because compute is billed for awake capacity, the most important ClickHouse Cloud cost optimization question is how much of that capacity did useful work. Two FinOps metrics answer it. Utilization compares CPU consumed with vCPU-seconds provisioned. The idle-awake ratio counts the minutes in which the service was awake but no business query ran: only probes, monitoring or operators. The query below spreads each query’s CPU across every minute it was running, so a long query is not booked to the minute it happened to finish.
-- ClickHouse Cloud FinOps metrics 4 and 5: compute utilization and idle-awake ratio, minute by minute
-- vcpus = vCPUs provisioned across all replicas of the service
WITH per_query AS
(
    SELECT
        range(toUInt32(toStartOfMinute(query_start_time)), toUInt32(event_time) + 1, 60) AS minutes,
        ProfileEvents['OSCPUVirtualTimeMicroseconds'] / 1e6 / length(minutes)            AS cpu_per_minute,
        user NOT IN {non_business_users:Array(String)}                                    AS is_business   -- probes, operators
    FROM system.query_log
    WHERE type = 'QueryFinish'
      AND event_time BETWEEN {from:DateTime} AND {to:DateTime}
),
per_minute AS
(
    SELECT
        arrayJoin(minutes)            AS minute,
        sum(cpu_per_minute)           AS cpu_s,
        max(is_business)              AS any_business_work
    FROM per_query
    GROUP BY minute
)
SELECT
    count()                                                                   AS awake_minutes,
    countIf(any_business_work = 0)                                            AS idle_awake_minutes,
    round(100 * idle_awake_minutes / awake_minutes, 1)                        AS idle_awake_pct,
    round(sum(cpu_s), 1)                                                      AS consumed_cpu_s,
    awake_minutes * 60 * {vcpus:UInt32}                                       AS provisioned_vcpu_s,
    round(100 * consumed_cpu_s / provisioned_vcpu_s, 1)                       AS compute_utilization_pct
FROM per_minute
FORMAT Vertical;

-- business window, vcpus = 2:  awake_minutes 9, idle_awake_pct 0, consumed_cpu_s 22.3,
--                              provisioned_vcpu_s 1080, compute_utilization_pct 2.1
-- probe-only window:           awake_minutes 3, idle_awake_pct 100, compute_utilization_pct 0.1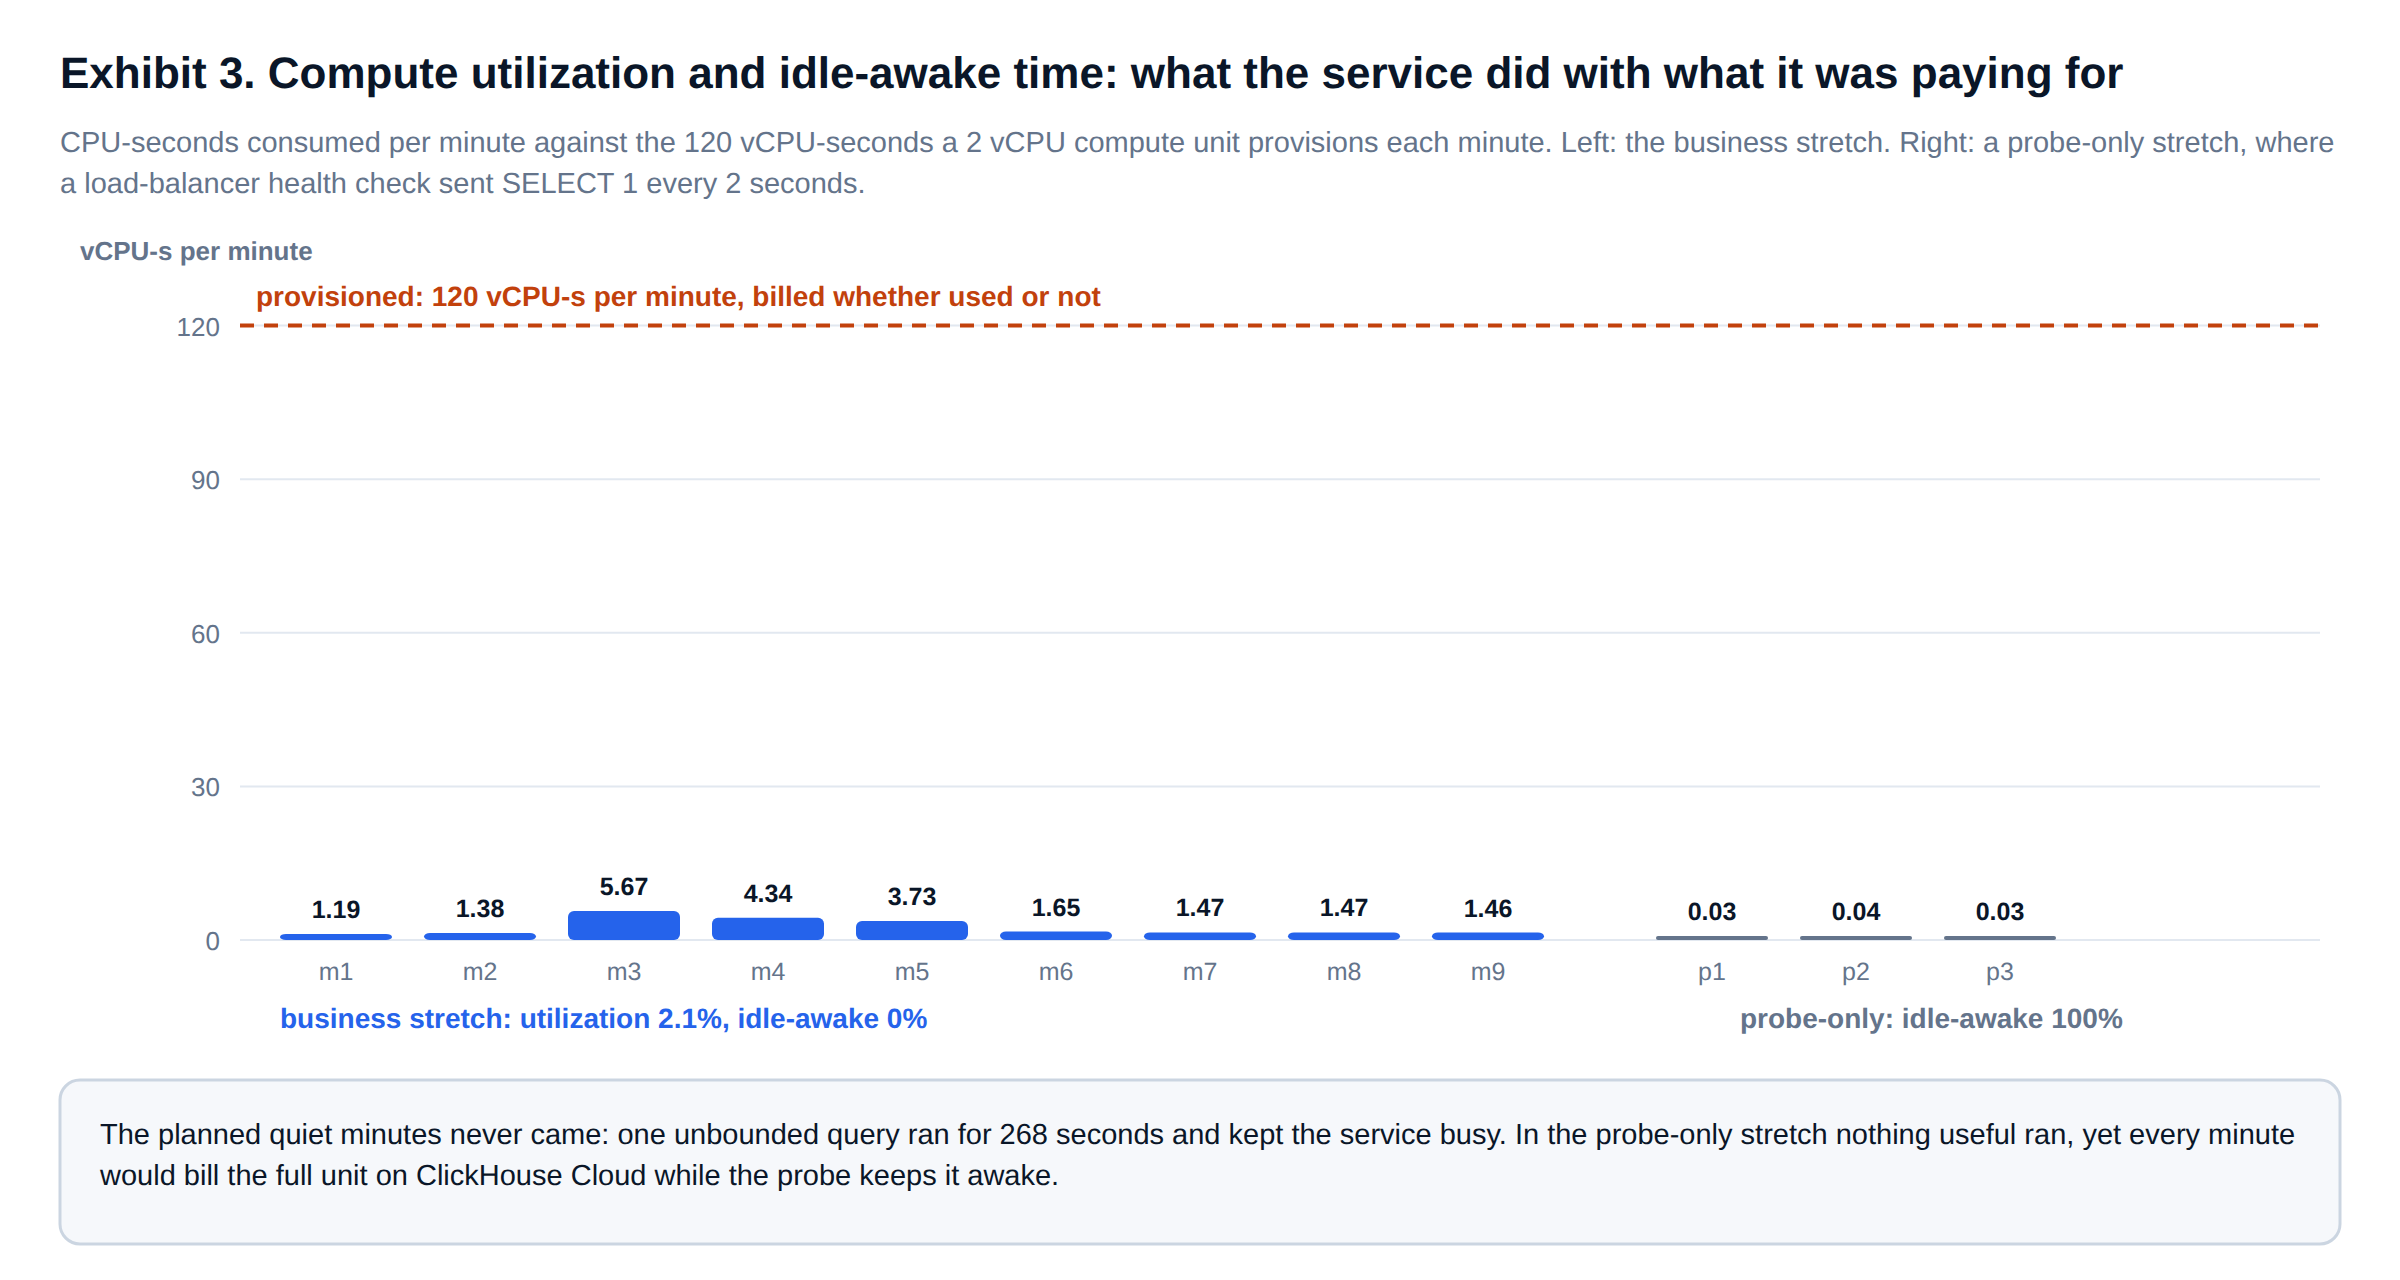
Two findings matter. The business window used 2.1% of what a 2 vCPU unit provides, and it would still have billed every minute in full. The planned quiet minutes at the end of the run never came, because the unbounded query ran for 268 seconds and kept the service busy. The probe-only window is the purer lesson. About 50 health checks over three minutes used 0.1% of capacity, yet on a service with idling enabled, any query counts as activity. A load-balancer probe aimed at the database, rather than at the application in front of it, can keep a service awake around the clock.
Utilization below 20% for a month is our trigger to right-size: lower the autoscaling floor, reduce replicas outside business hours, or move bursty work to a separate compute group. Before acting, check memory headroom (metric 11). A service sized for one memory-hungry query will look idle on CPU and still need its memory.
Optimize · metric 6
Scan efficiency: the ClickHouse Cloud cost optimization metric that finds runaway queries
ClickHouse is fast enough that an inefficient query often finishes before anyone notices it. The bill notices. Scan efficiency measures rows read per row returned, grouped by normalized_query_hash, so a query shape that runs thousands of times a day counts once with its full cost.
-- ClickHouse Cloud FinOps metric 6: scan efficiency per query fingerprint
SELECT
    normalized_query_hash                                                     AS fingerprint,
    any(user)                                                                 AS sample_user,
    count()                                                                   AS runs,
    formatReadableSize(sum(read_bytes))                                       AS read,
    formatReadableSize(sum(result_bytes))                                     AS returned,
    round(sum(read_rows) / greatest(sum(result_rows), 1))                     AS rows_read_per_row_returned,
    round(sum(ProfileEvents['OSCPUVirtualTimeMicroseconds']) / 1e6, 2)        AS cpu_s
FROM system.query_log
WHERE type = 'QueryFinish'
  AND event_time BETWEEN {from:DateTime} AND {to:DateTime}
  AND query_kind = 'Select'
  AND user != 'healthcheck'
GROUP BY fingerprint
ORDER BY cpu_s DESC
LIMIT 6;

-- sample_user     runs  read        returned   rows_read_per_row_returned  cpu_s
-- analyst            6  2.03 GiB    68.14 KiB                     1795130  13.55
-- analyst            1  3.73 GiB    136.00 B                   1000000000   7.12
-- bi_dashboard      91  63.14 MiB   45.14 KiB                       14742   0.56
-- bi_dashboard      91  7.03 MiB    50.30 KiB                         183   0.40
-- partner_export     5  111.57 MiB  39.97 MiB                          10   0.36
The second row is the expensive pattern in its purest form: 3.73 GiB read to return 136 bytes, a billion rows read per row returned. The table is sorted by (tenant_id, event_time), and the query filtered on user_id, so no granule could be skipped. The engineering fix is a projection or a skip index if the lookup is a real product need. The FinOps control is a guardrail that stops the query before it spends the money.
-- ClickHouse Cloud cost optimization guardrail for ad-hoc roles. Blast radius: queries from roles that
-- carry this profile fail with TOO_MANY_ROWS instead of running. Rollback: DROP SETTINGS PROFILE sp_adhoc_guardrail.
CREATE SETTINGS PROFILE IF NOT EXISTS sp_adhoc_guardrail SETTINGS
    max_rows_to_read     = 250000000, read_overflow_mode    = 'throw',   -- above the 165 M rows of a legitimate week scan
    max_execution_time   = 60,        timeout_overflow_mode = 'throw',
    max_result_bytes     = 104857600, result_overflow_mode  = 'throw';   -- 100 MiB: large extracts go through exports

ALTER USER analyst SETTINGS PROFILE 'sp_adhoc_guardrail';

-- Test in our lab, as a user with the profile (query condition cache off to force a real read):
-- SELECT count() FROM lab.events WHERE user_id = 4218139 SETTINGS use_query_condition_cache = 0
-- Code: 158. DB::Exception: Limit for rows or bytes to read exceeded, max rows: 250.00 million,
--            current rows: 1.00 billion ... (TOO_MANY_ROWS)                       elapsed 0.2 s
The rejection took 0.2 seconds. The same query had run for 268 seconds without the profile. The limit sits above the 165 million rows the analyst’s legitimate week-long scan reads, so normal work is unaffected. We set guardrails from the observed distribution of read_rows per role, not from a round number, and review them with the scan efficiency report each week.
Optimize · metric 7
Egress intensity: when data transfer outweighs compute in ClickHouse Cloud billing
Data transfer is a small share of most ClickHouse Cloud billing, which is exactly why it goes unwatched. It is concentrated: one consumer that ships raw rows out of the region can cost more in transfer than its queries cost in compute. Egress intensity measures that per consumer from the bytes each query returned.
-- ClickHouse Cloud FinOps metric 7: egress intensity, result bytes leaving the service per user and interface
WITH {egress_usd_per_gb:Float64} AS usd_per_gb
SELECT
    user,
    interface,
    count()                                                                   AS queries,
    formatReadableSize(sum(result_bytes))                                     AS returned,
    round(sum(result_bytes) / 1e9 * usd_per_gb, 4)                            AS egress_usd_if_public,
    round(sum(ProfileEvents['OSCPUVirtualTimeMicroseconds']) / 1e6, 2)        AS cpu_s
FROM system.query_log
WHERE type = 'QueryFinish'
  AND event_time BETWEEN {from:DateTime} AND {to:DateTime}
GROUP BY user, interface
ORDER BY sum(result_bytes) DESC;

-- --param_egress_usd_per_gb=0.1152
-- user            interface  queries  returned    egress_usd_if_public  cpu_s
-- partner_export  HTTP             5  39.97 MiB                 0.0048   0.36
-- healthcheck     HTTP           240  960.00 KiB                0.0001   0.35
-- bi_dashboard    HTTP           182  95.44 KiB                      0   0.96
-- analyst         HTTP             7  68.27 KiB                      0  20.68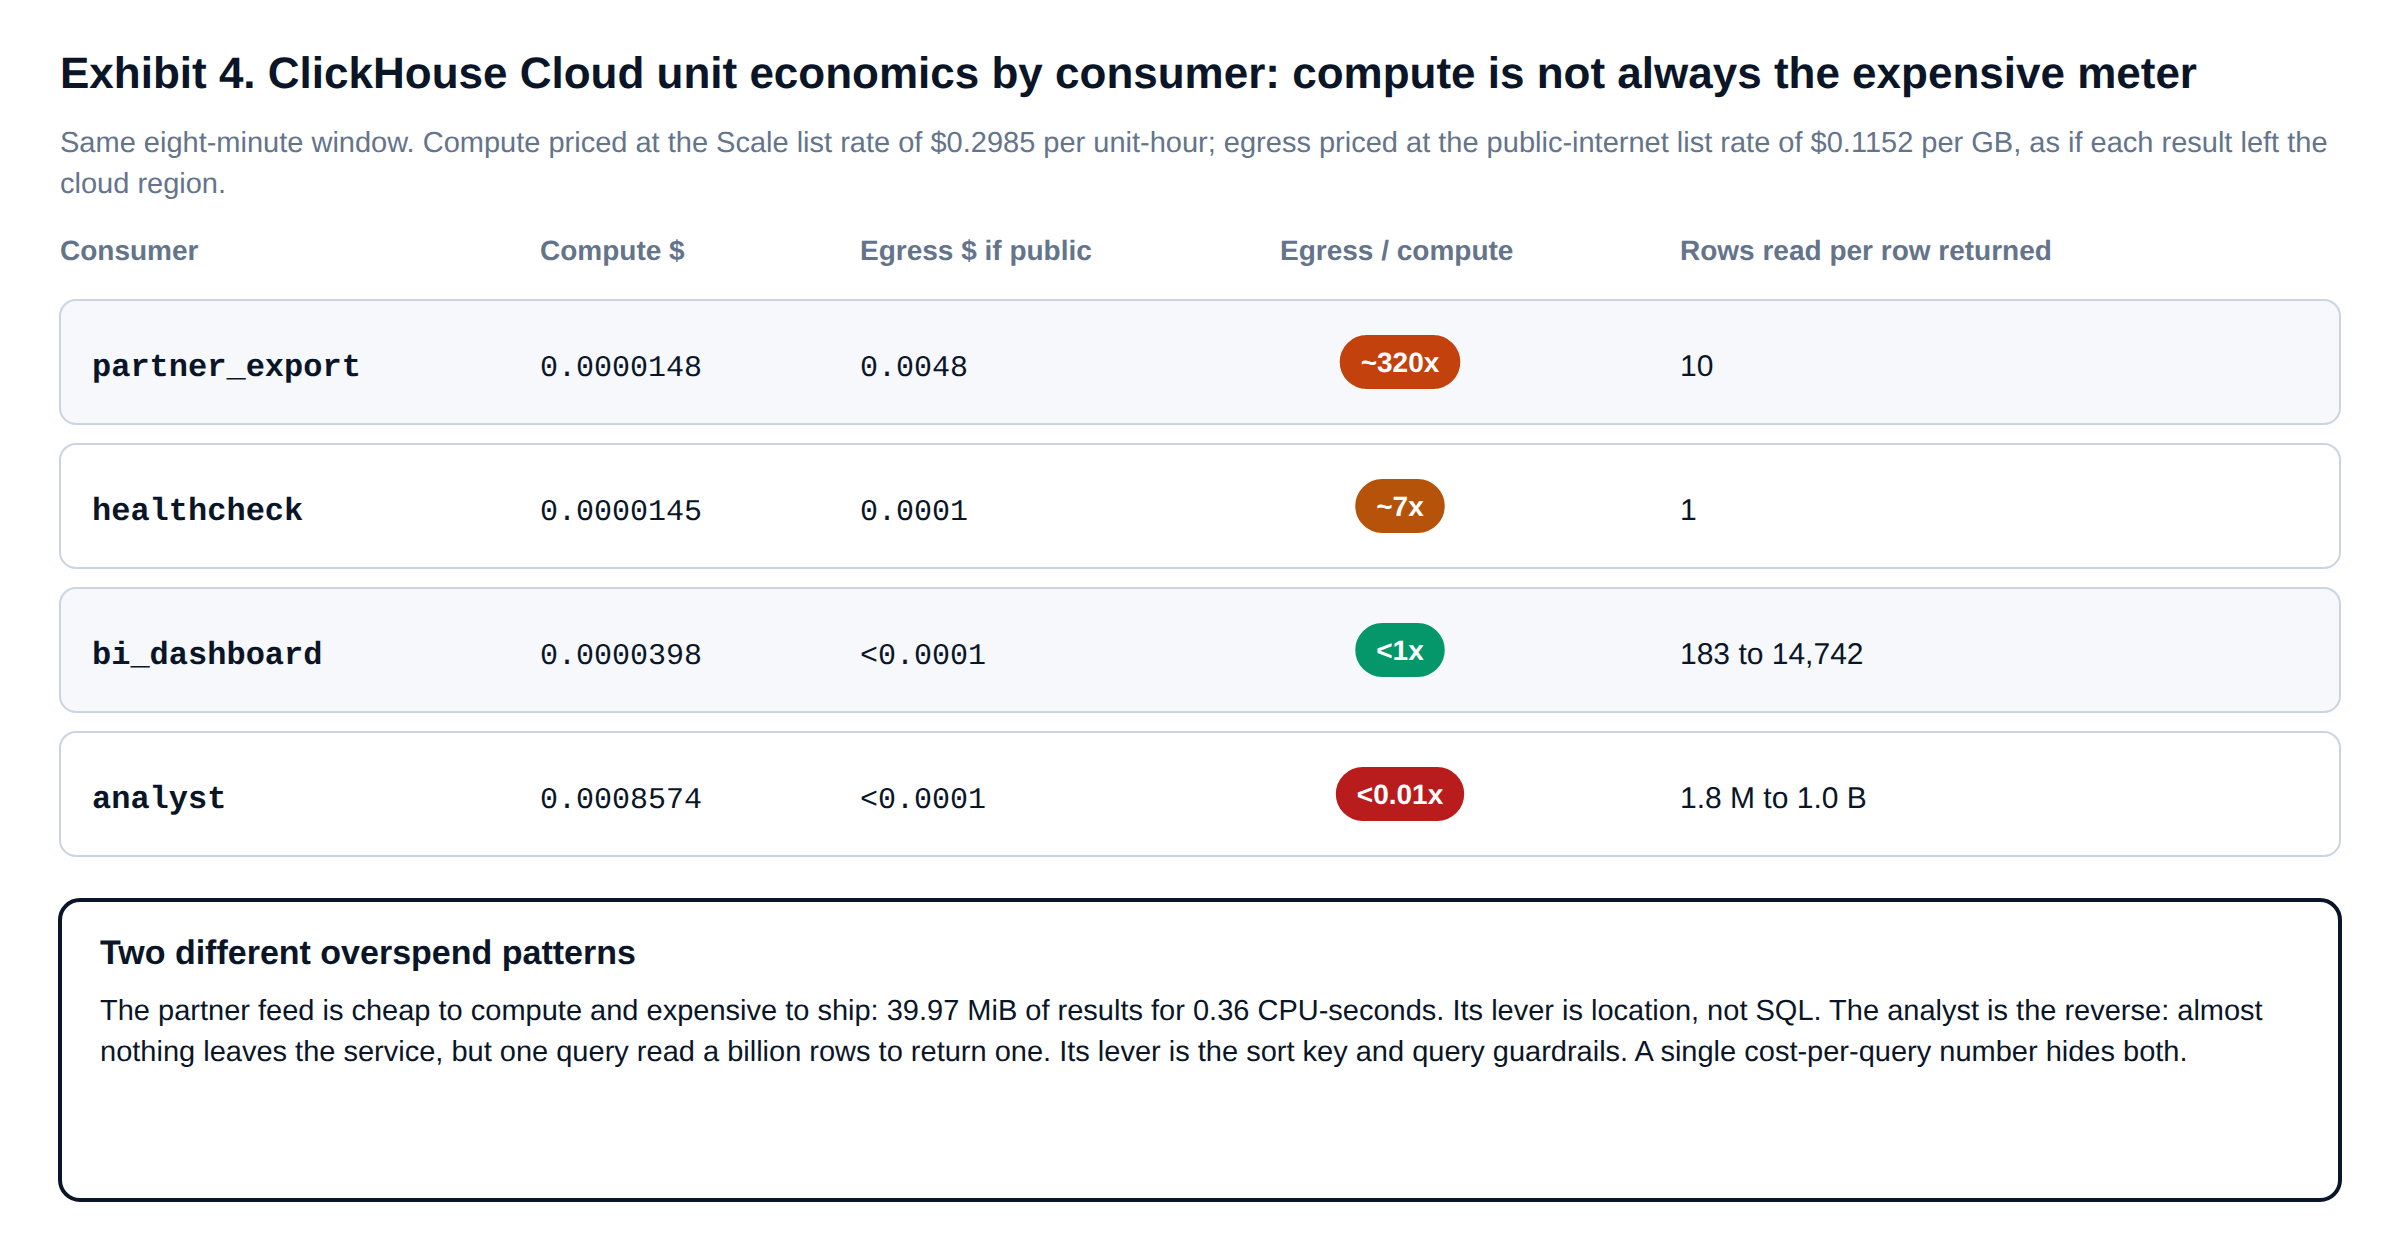
The partner feed used 0.36 CPU-seconds, about $0.0000148 of compute at the Scale rate. Its 39.97 MiB of results would cost $0.0048 if they crossed the public internet: roughly 320 times the compute. The health check returned 960 KiB, which also outweighs its compute. The analyst is the mirror image, expensive to compute and almost free to ship. A single cost-per-query figure hides both patterns. The partner feed’s lever is location, through private connectivity, an in-region consumer or a scheduled export to object storage. The analyst’s lever is the sort key and the guardrail.
Result bytes are an upper bound on transfer. The meter counts bytes that actually leave the service’s network boundary, and compressed HTTP responses send fewer bytes than result_bytes records. Use this metric to rank consumers, then confirm against dataTransferCHC in the billing API.
Optimize · metrics 8 and 9
Cold-data share and compression: the storage half of ClickHouse Cloud cost optimization
Storage is billed on compressed bytes every month, whether anyone reads them or not. Cold-data share measures the compressed bytes in partitions that no query read during the review window. Compression ratio measures how much the schema is paying for its data types and codecs. We exclude one-off backfills and known full scans from the read set, because a single unbounded query would otherwise mark every partition as warm.
-- ClickHouse Cloud FinOps metrics 8 and 9: cold-data share and compression ratio per table
-- query_log.partitions holds 'db.table.partition' for every partition a query read
WITH read_partitions AS
(
    SELECT DISTINCT arrayJoin(partitions) AS p
    FROM system.query_log
    WHERE type = 'QueryFinish'
      AND event_time BETWEEN {from:DateTime} AND {to:DateTime}
      AND log_comment NOT LIKE {exclude_tag:String}       -- leave out one-off backfills and runaway scans
)
SELECT
    database,
    table,
    formatReadableSize(sum(data_compressed_bytes))                            AS compressed,
    round(sum(data_uncompressed_bytes) / sum(data_compressed_bytes), 2)       AS compression_ratio,
    round(sum(data_compressed_bytes) / 1e12 * {usd_per_tb_month:Float64}, 2)  AS storage_usd_month,
    round(100 * sumIf(data_compressed_bytes,
              concat(database, '.', table, '.', partition) NOT IN (SELECT p FROM read_partitions))
          / sum(data_compressed_bytes), 1)                                    AS cold_pct
FROM system.parts
WHERE active
  AND database = {db:String}
GROUP BY database, table
ORDER BY sum(data_compressed_bytes) DESC;

-- --param_exclude_tag='%adhoc-unbounded%' --param_usd_per_tb_month=25.30 --param_db=lab
-- database  table         compressed  compression_ratio  storage_usd_month  cold_pct
-- lab       events        15.83 GiB                1.47               0.43      83.5
-- lab       events_daily  227.34 MiB               1.01               0.01      83.4
With the unbounded query included, every partition of lab.events counted as read and cold share was 0%. Excluding it, 83.5% of the table’s compressed bytes sat in months no one queried. On a table without a TTL, that is the case for a retention policy or a move to cheaper object storage. The compression ratio of 1.47 is low because our synthetic generator writes near-random values. Real event data usually compresses much better, and a low ratio on production data is worth a schema review of types, LowCardinality and codecs. Storage cost here is cents because the lab table is small; the percentages are the finding.
Operate · metrics 10 to 12
Memory headroom, backups and the burn index: ClickHouse Cloud FinOps for leadership
The operate metrics answer whether the service is the right size and the commitment the right shape. Memory headroom comes first because it is the usual reason a service cannot be scaled down. A compute unit pairs 2 vCPU with 8 GiB, so a service sized for memory carries CPU it does not need, and the reverse.
-- ClickHouse Cloud FinOps metric 11: memory headroom, peak query memory against one replica's memory
SELECT
    user,
    count()                                                                   AS queries,
    formatReadableSize(quantile(0.99)(memory_usage))                          AS p99_query_memory,
    formatReadableSize(max(memory_usage))                                     AS max_query_memory,
    round(100 * max(memory_usage) / ({replica_gib:UInt32} * 1073741824), 1)   AS pct_of_replica_memory
FROM system.query_log
WHERE type = 'QueryFinish'
  AND event_time BETWEEN {from:DateTime} AND {to:DateTime}
GROUP BY user
ORDER BY max(memory_usage) DESC;

-- --param_replica_gib=8
-- user            queries  p99_query_memory  max_query_memory  pct_of_replica_memory
-- analyst               7  41.07 MiB         41.07 MiB                           0.5
-- bi_dashboard        182  5.70 MiB          5.73 MiB                            0.1
-- partner_export        5  4.35 MiB          4.36 MiB                            0.1
The heaviest query in our window used 41.07 MiB, 0.5% of an 8 GiB replica. This workload was bound by neither CPU nor memory. A review that saw that profile for a month would test a smaller floor, after checking peak concurrency and merge memory, which this per-query view does not capture.
The backup-to-data ratio is the backup CHC from the billing API divided by storage CHC. Backups are billed separately, and the default keeps one backup for one day. When the ratio rises with no change in retention policy, someone has extended retention or added backups without a cost decision. Neither is wrong; both should be visible.
The burn index compares the days left in a commitment term with the days the remaining credits will last at the trailing 30-day run rate. At 1.0 the credits and the term end together. Above 1.1 they run out early and further usage is billed outside the commitment; below 0.8 credits are likely to expire unused. The daily anomaly score is the latest day’s spend as a z-score against the trailing 14 days. Both are computed by the script above from the usage cost API, with the remaining balance taken from the organisation’s credit balance endpoint.
Governance
The ClickHouse Cloud FinOps operating rhythm we install
Metrics without a cadence decay into a dashboard nobody opens. Exhibit 5 is the rhythm we put in place: who reviews each of the FinOps metrics, how often, and what trips a conversation. Owners are named as roles so the rhythm survives reorganisations.
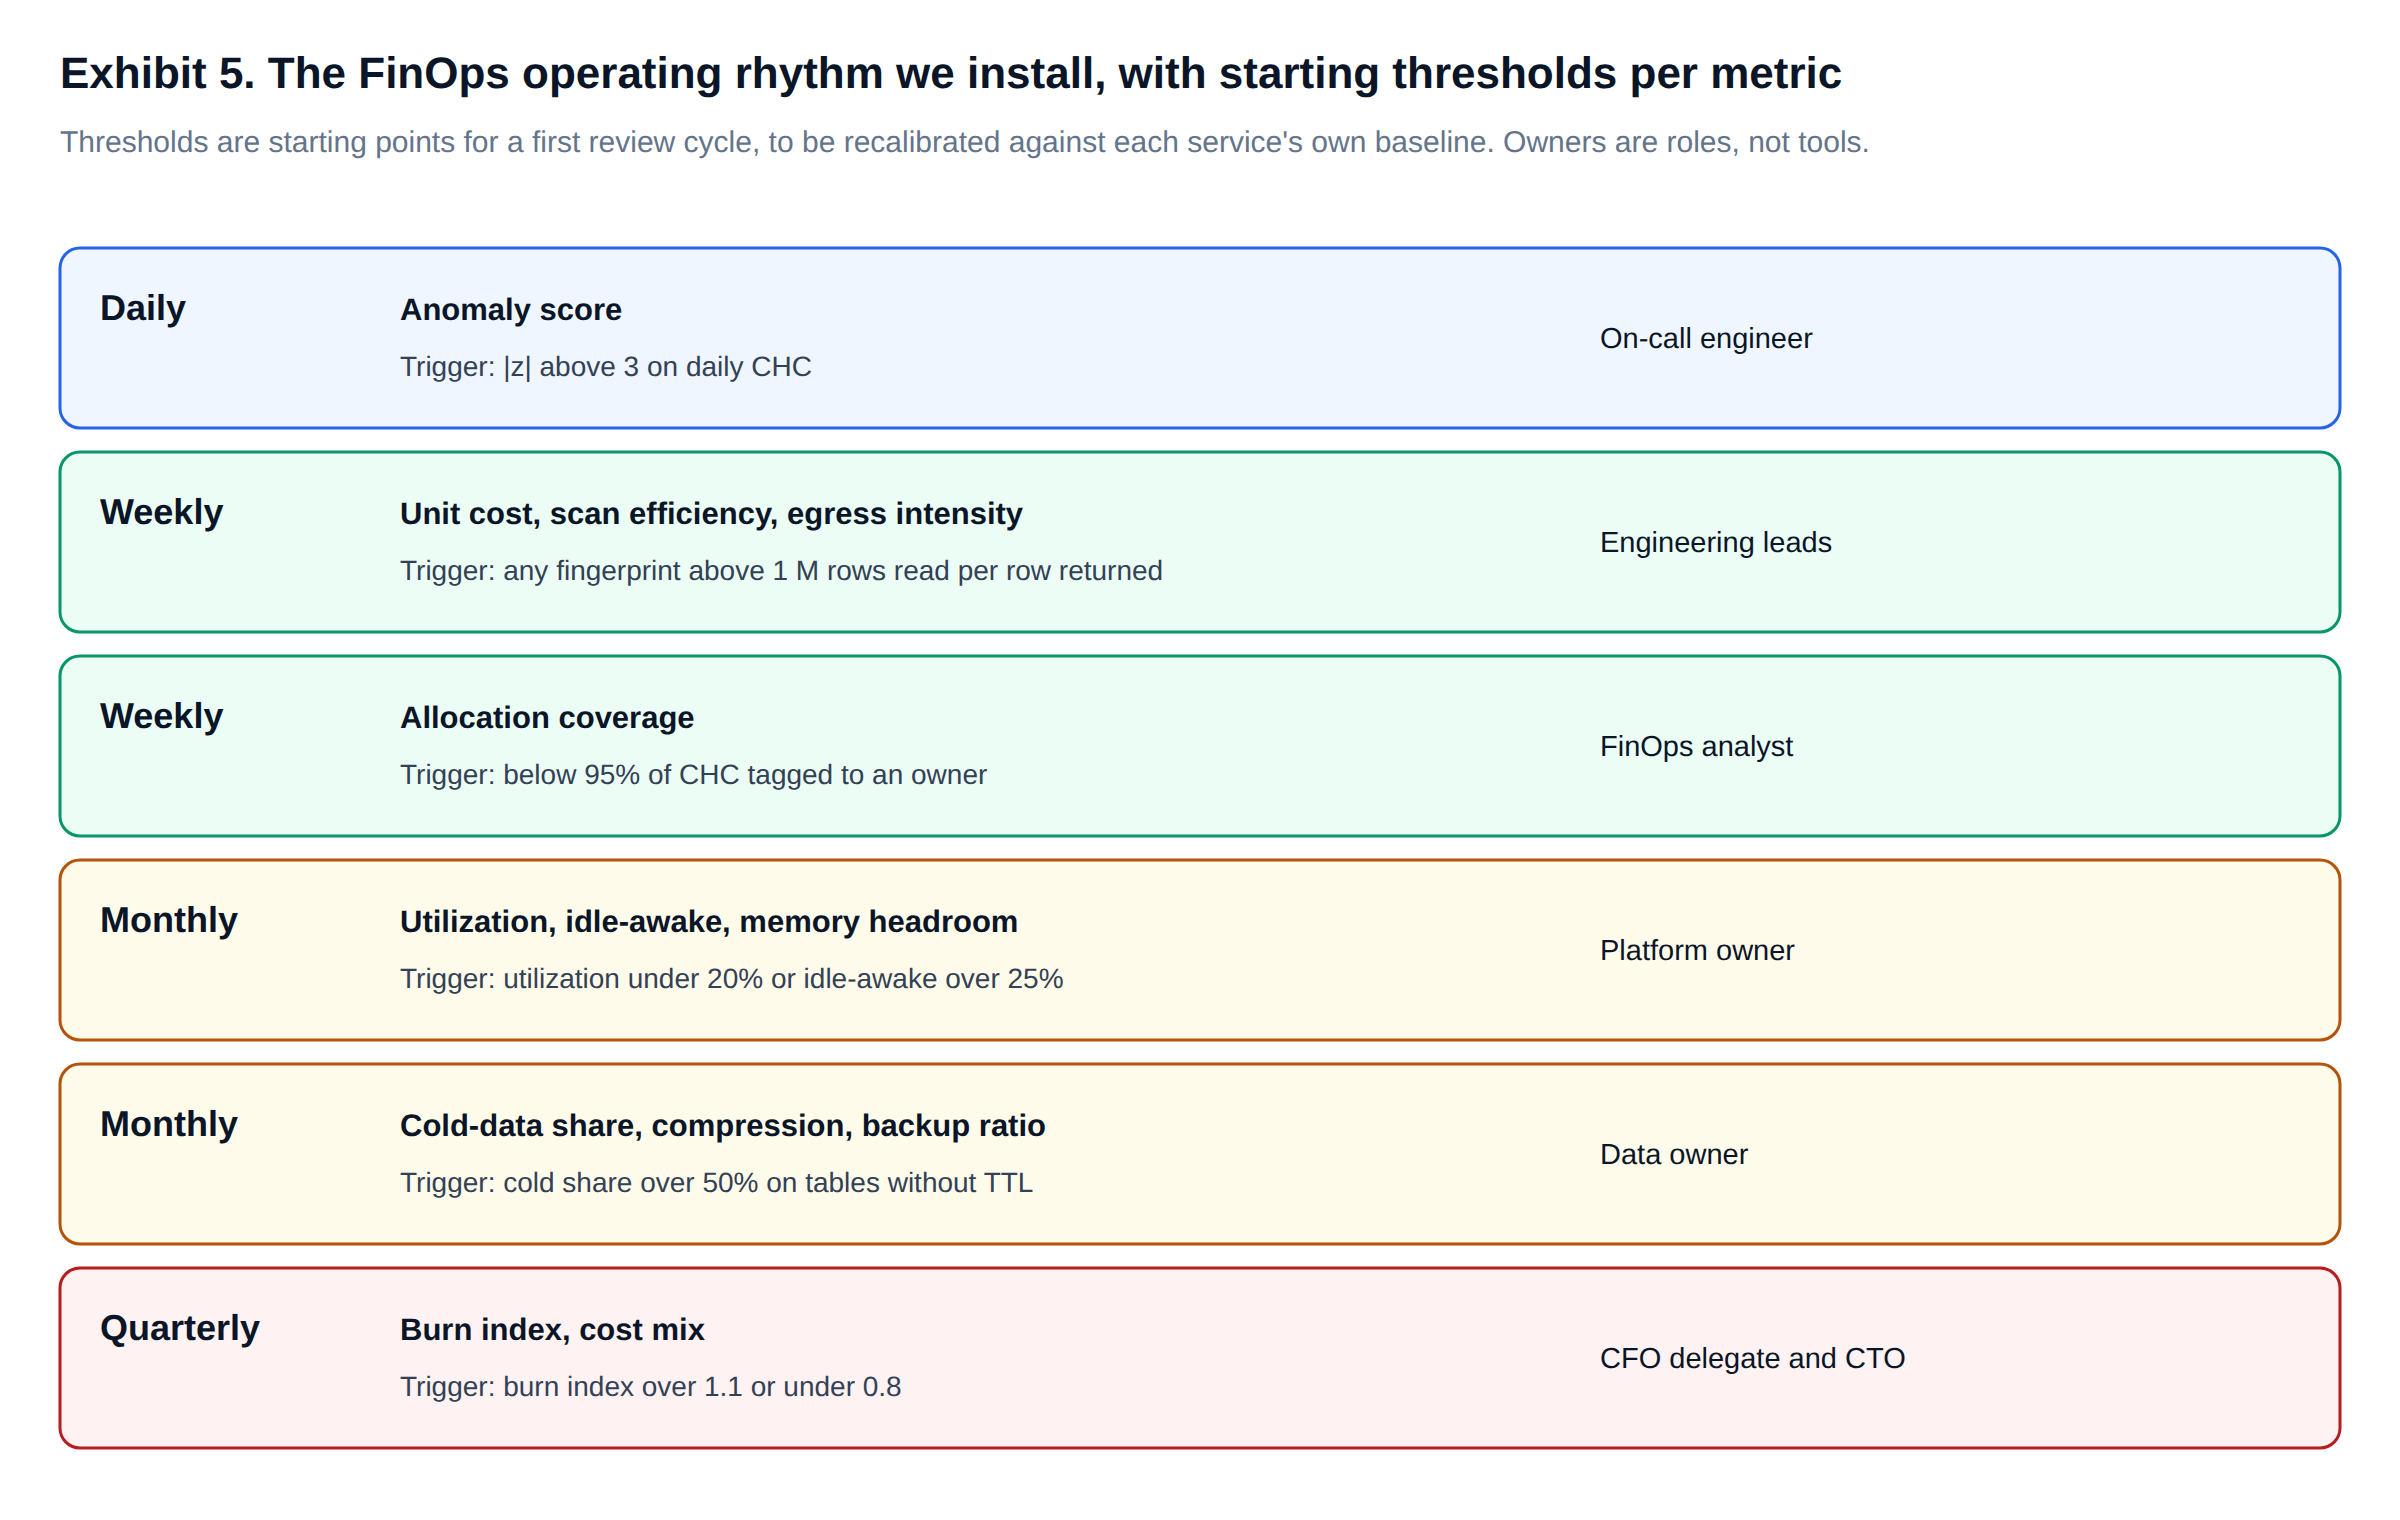
The first three review cycles usually run in a fixed order. In the first month, tags and the owner map lift allocation coverage above 95%, and the guardrail profile goes onto every ad-hoc role. In the second, the weekly scan efficiency and egress reviews produce a short list of query shapes and consumers to fix, each with a named owner and an estimated saving. In the third, a month of utilization and memory headroom data supports a right-sizing decision, and the burn index informs the next commitment. Every configuration change is applied to a non-production service first, with its rollback written down.
Questions a steering committee should ask about ClickHouse Cloud billing
- What share of last month’s ClickHouse Cloud billing has a named owner, and who owns the rest?
- Which five query fingerprints consumed the most CPU, and which teams own them?
- For how many awake minutes did the service do no business work?
- Which consumers return more in data transfer cost than they use in compute?
- At the current run rate, when does the commitment run out, and is that before or after renewal?
Scope of the evidence
How we measured, and what this ClickHouse Cloud FinOps evidence does not show
The workload ran on our own ClickHouse 26.9.17.8 service, open-source, on 2 vCPU, against a synthetic 1-billion-row event table. It was not a ClickHouse Cloud service. We applied ClickHouse Cloud pricing to the measured CPU-seconds, bytes and storage by arithmetic, at list rates checked on 16 October 2026. The usage cost script was tested against a synthetic response in the documented schema, not a real invoice.
Three limits follow. ClickHouse Cloud bills awake compute, not the CPU a query uses, so our CPU-based unit costs allocate the bill rather than reproduce it. The workload compressed a business day into eight minutes, so absolute dollar figures are tiny and only the ratios carry over. And a single small service shows none of the effects of autoscaling, multiple replicas or compute groups. On ClickHouse Cloud, read system.query_log across replicas with clusterAllReplicas, and validate every threshold against your own baseline before it drives a decision.
FAQ
ClickHouse Cloud FinOps: questions we are asked
What are the most important FinOps metrics for ClickHouse Cloud?
Start with allocation coverage, compute utilization and scan efficiency. Coverage gives every dollar an owner. Utilization shows how much awake capacity did useful work: 2.1% in our busy window. Scan efficiency finds the queries behind the compute bill: one of ours read a billion rows to return one.
How does ClickHouse Cloud pricing work?
Compute is billed per minute in units of 2 vCPU and 8 GiB, at a rate set by the tier: $0.2985 per unit-hour on Scale at the list rates we used. Storage is billed per TB-month of compressed data, backups and data transfer separately. Rates vary by provider and region.
How do we do ClickHouse Cloud cost allocation across teams on one service?
Tag queries with log_comment in a fixed format such as team=growth;feature=hourly-traffic, set defaults per database user, and allocate CPU-seconds from system.query_log. The billing API allocates between services; tags allocate within them.
Where does ClickHouse Cloud billing data come from?
The organisation’s usage cost API returns daily ClickHouse Credits per service and meter, up to 31 days per request. Combine it with each service’s system tables, which explain why the meters moved.
What is the quickest ClickHouse Cloud cost optimization win?
A settings profile on ad-hoc roles. In our lab, max_rows_to_read rejected a billion-row scan in 0.2 seconds; without it the query ran for 268 seconds. Set the limit from the observed distribution so legitimate work passes.
Further reading
Related ChistaDATA research and ClickHouse sources
From ChistaDATA: how expensive queries become a very large ClickHouse Cloud bill, the query-level companion to this paper; ClickHouse performance observability, for the system tables used here; and our ClickHouse high availability architecture framework, for the replica and zone decisions that drive compute spend.
ClickHouse documentation: ClickHouse Cloud pricing, the billing overview, the usage cost API, system.query_log and query complexity restrictions.
Measurements: ChistaDATA lab, 16 October 2026, ClickHouse 26.9.17.8 on one 2 vCPU host, synthetic data and workload. Prices: ClickHouse Cloud list rates as published on 16 October 2026; your rates depend on provider, region and contract. Usage cost API output is from a synthetic response. Test every recommendation on a non-production service before applying it to production, and keep a tested backup and recovery posture.
ChistaDATA
Commission a ClickHouse Cloud FinOps review
ChistaDATA installs the twelve-metric scorecard on your own data: usage cost extraction, tagging and ClickHouse Cloud cost allocation, guardrail profiles, right-sizing analysis and the operating rhythm that keeps savings from eroding. We are vendor-neutral, work on open-source ClickHouse and ClickHouse Cloud alike, and provide 24×7×365 support with a 15-minute Severity 1 response.
Running ClickHouse in production? ChistaDATA provides ClickHouse consulting for architecture, performance and migrations, and 24×7 ClickHouse support with a 15-minute S1 response. For day-to-day operations see ClickHouse DBA services and ClickHouse managed services.
