ChistaDATA · ClickHouse Cloud cost engineering · October 2026
ClickHouse Cloud cost is not set by how much data you store. It is set by how your queries are written and how often they run. An expensive query does not appear as a line on the invoice; it appears as a bigger replica, a service that never idles, an extra replica for concurrency, or a gigabyte of egress nobody meant to send.
We measured five common query patterns on a billion-row table, priced every one of them at ClickHouse Cloud list rates, and wrote down the SQL we use to find and fix them on customer services. The numbers below are our own lab measurements; the prices are the public list prices for AWS us-east-1 on 2 October 2026.
How the bill is built
ClickHouse Cloud pricing meters capacity, not queries
ClickHouse Cloud pricing has four meters. Compute is billed per minute in compute units, where one unit is 8 GiB of RAM and 2 vCPU, at $0.2181 per unit-hour on Basic, $0.2985 on Scale and $0.3903 on Enterprise. Storage is billed on compressed size at $25.30 per TB-month, backups at the same rate, and public-internet egress at $0.1152 per GB. Those are the AWS us-east-1 list prices on the ClickHouse Cloud pricing page; other regions and contracts differ.
The meter that matters for expensive ClickHouse queries is compute, and it bills provisioned replicas, not the queries that ran on them. Every replica in a service is billed for every minute it is awake. Scale and Enterprise services run at least two replicas, and vertical autoscaling resizes all of them together when sustained CPU and memory cross its thresholds. A query therefore moves ClickHouse Cloud cost in one of four ways, and only one of them is obvious.
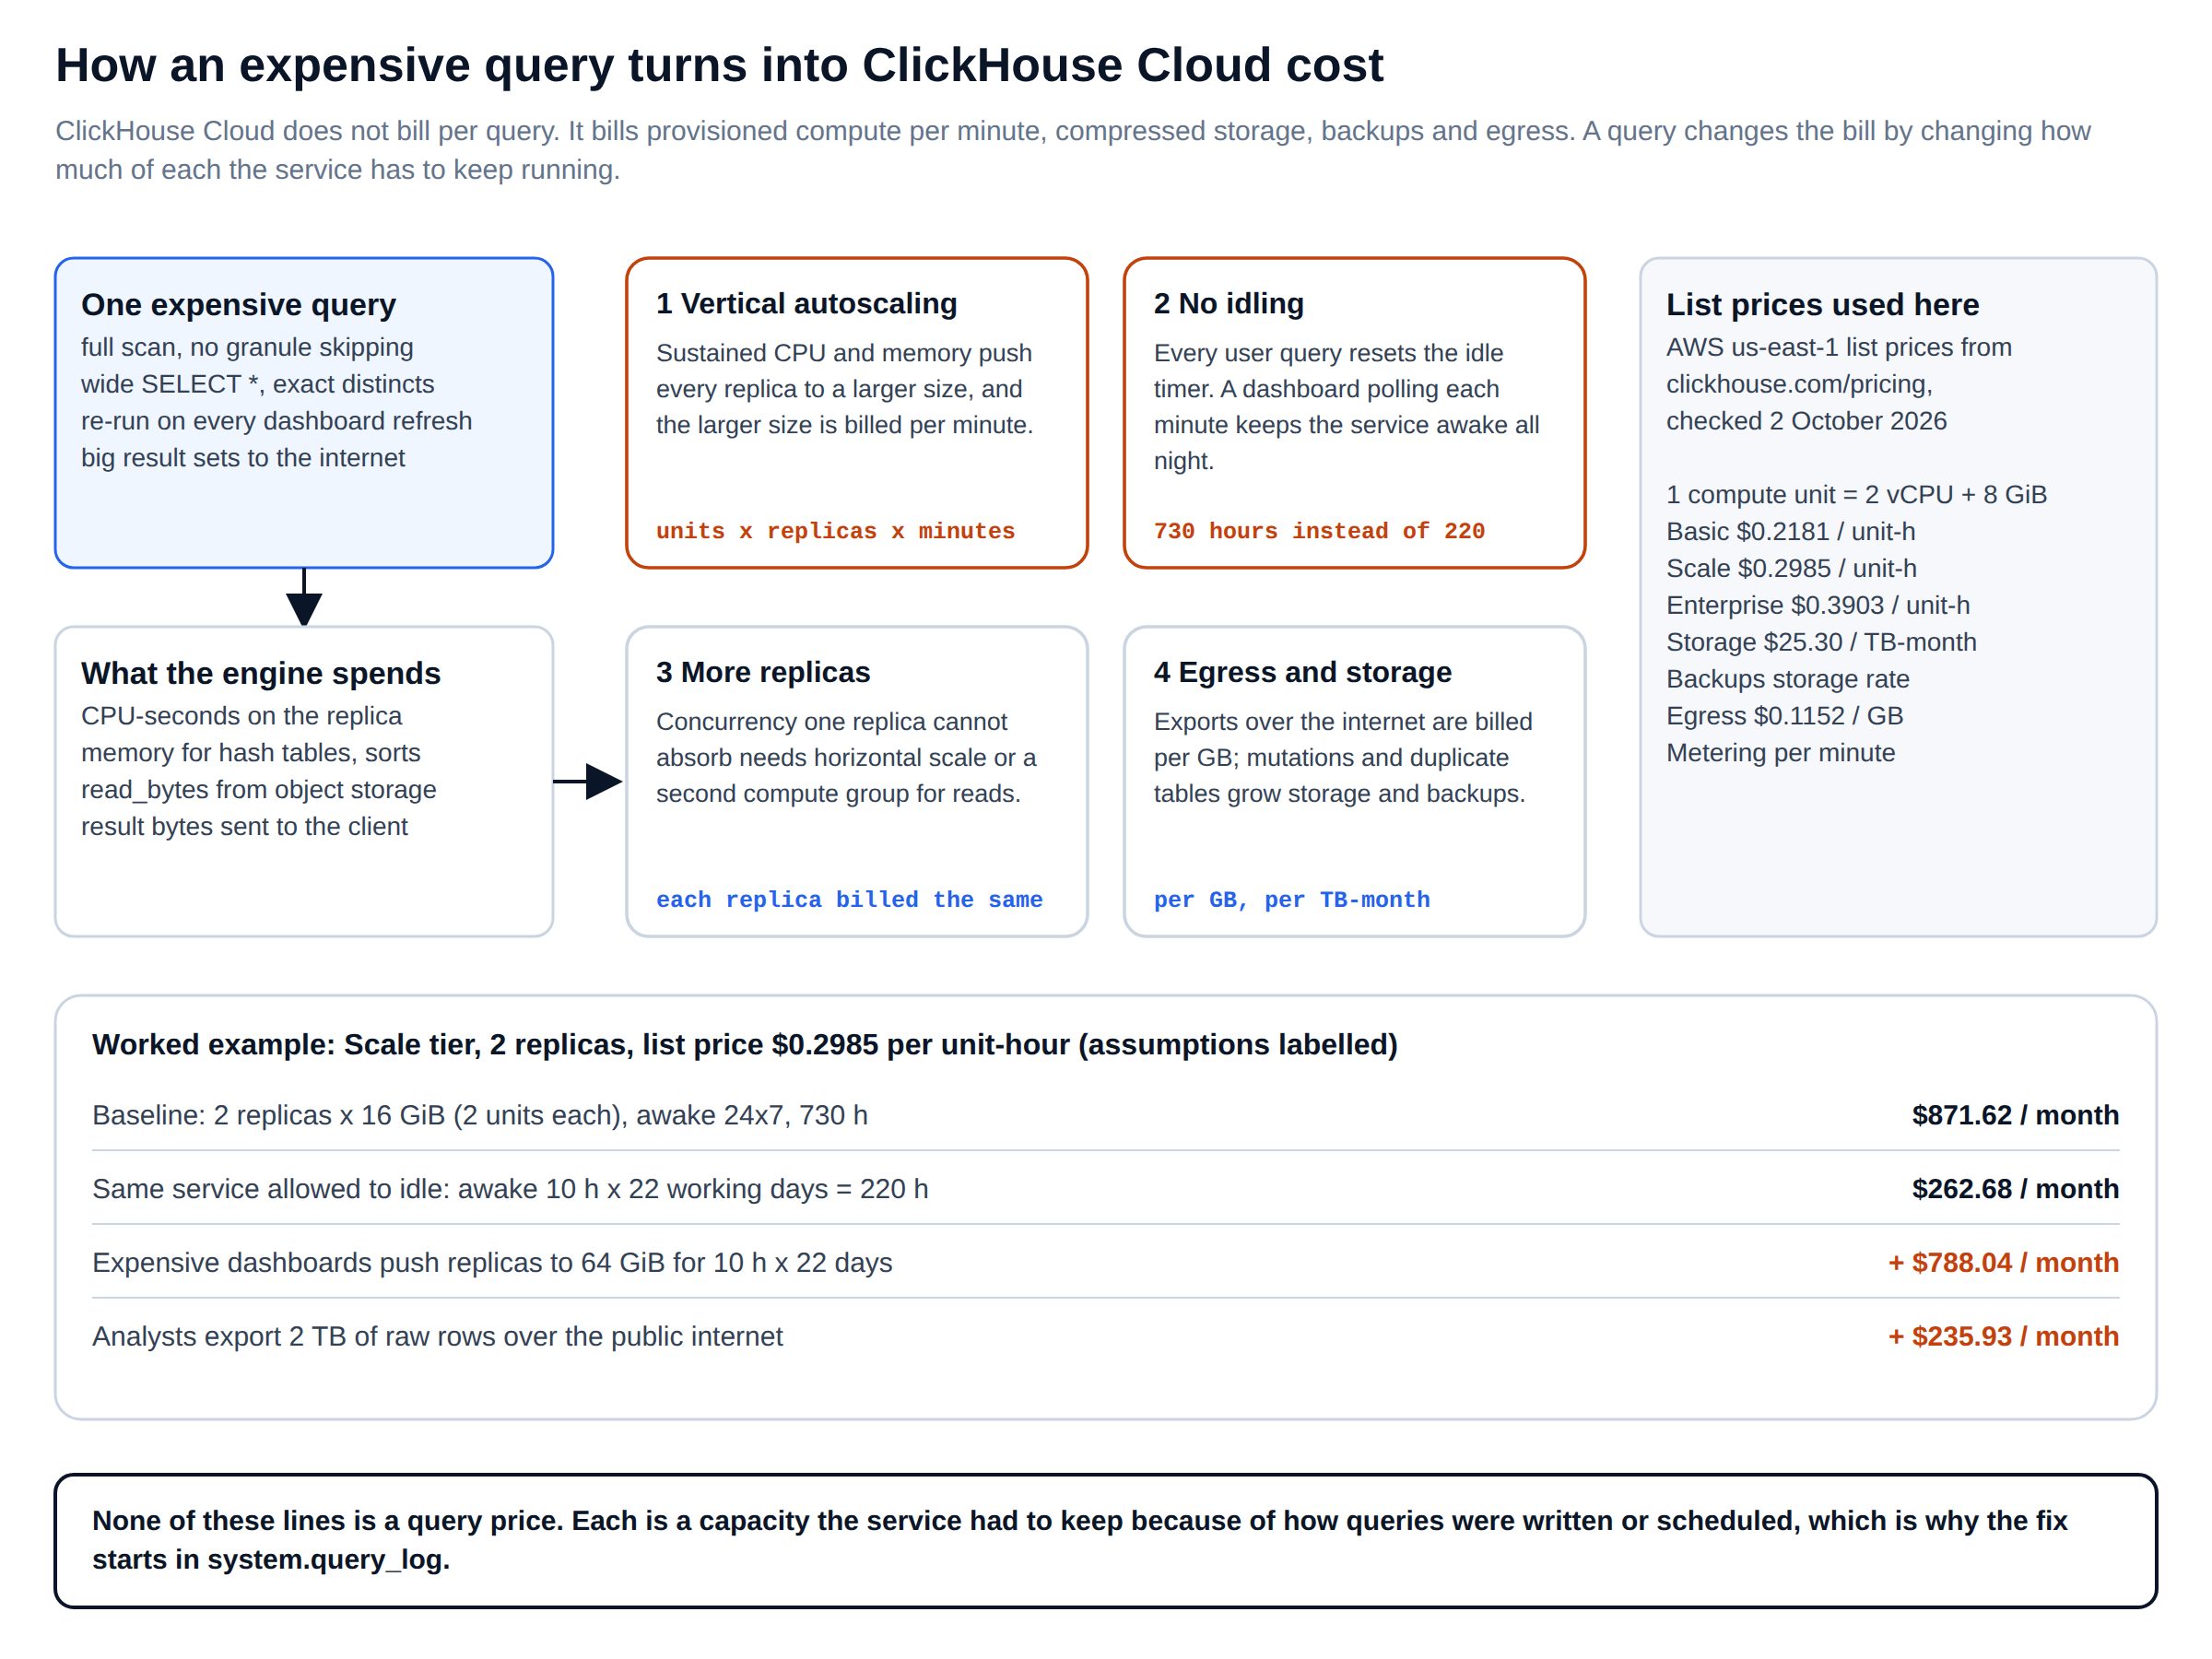
The worked example in Figure 1 is arithmetic, not a customer story. Two 16 GiB replicas awake around the clock cost $871.62 a month at Scale list price. The same pair allowed to idle outside a 10-hour working day costs $262.68. Dashboards that hold the replicas at 64 GiB for those 10 hours add $788.04, and a habit of exporting 2 TB of raw rows over the public internet adds $235.93. None of those lines names a query, which is why ClickHouse Cloud cost work has to start in system.query_log.
What we measured
Expensive ClickHouse queries, measured against their rewrites
The lab is a single node with 2 vCPU and 7 GiB of RAM, just under one ClickHouse Cloud compute unit, running ClickHouse 26.8.11.7 LTS. The table holds 1,000,000,000 rows across six monthly partitions, ordered by (tenant_id, event_time); every query reads one month, about 165 million rows. Each query ran twice and we kept the second run, with the query condition cache disabled where it would have hidden the cost of the first pattern.
CPU time comes from ProfileEvents['OSCPUVirtualTimeMicroseconds'] in system.query_log. To turn it into money we divide by 7,200 vCPU-seconds per compute-unit hour and multiply by the Scale list price. That gives a floor: the CPU-equivalent cost of one million executions if the service ran at 100% utilisation and billed nothing else. Real ClickHouse Cloud cost is higher because capacity is provisioned, but the ratios carry straight through.
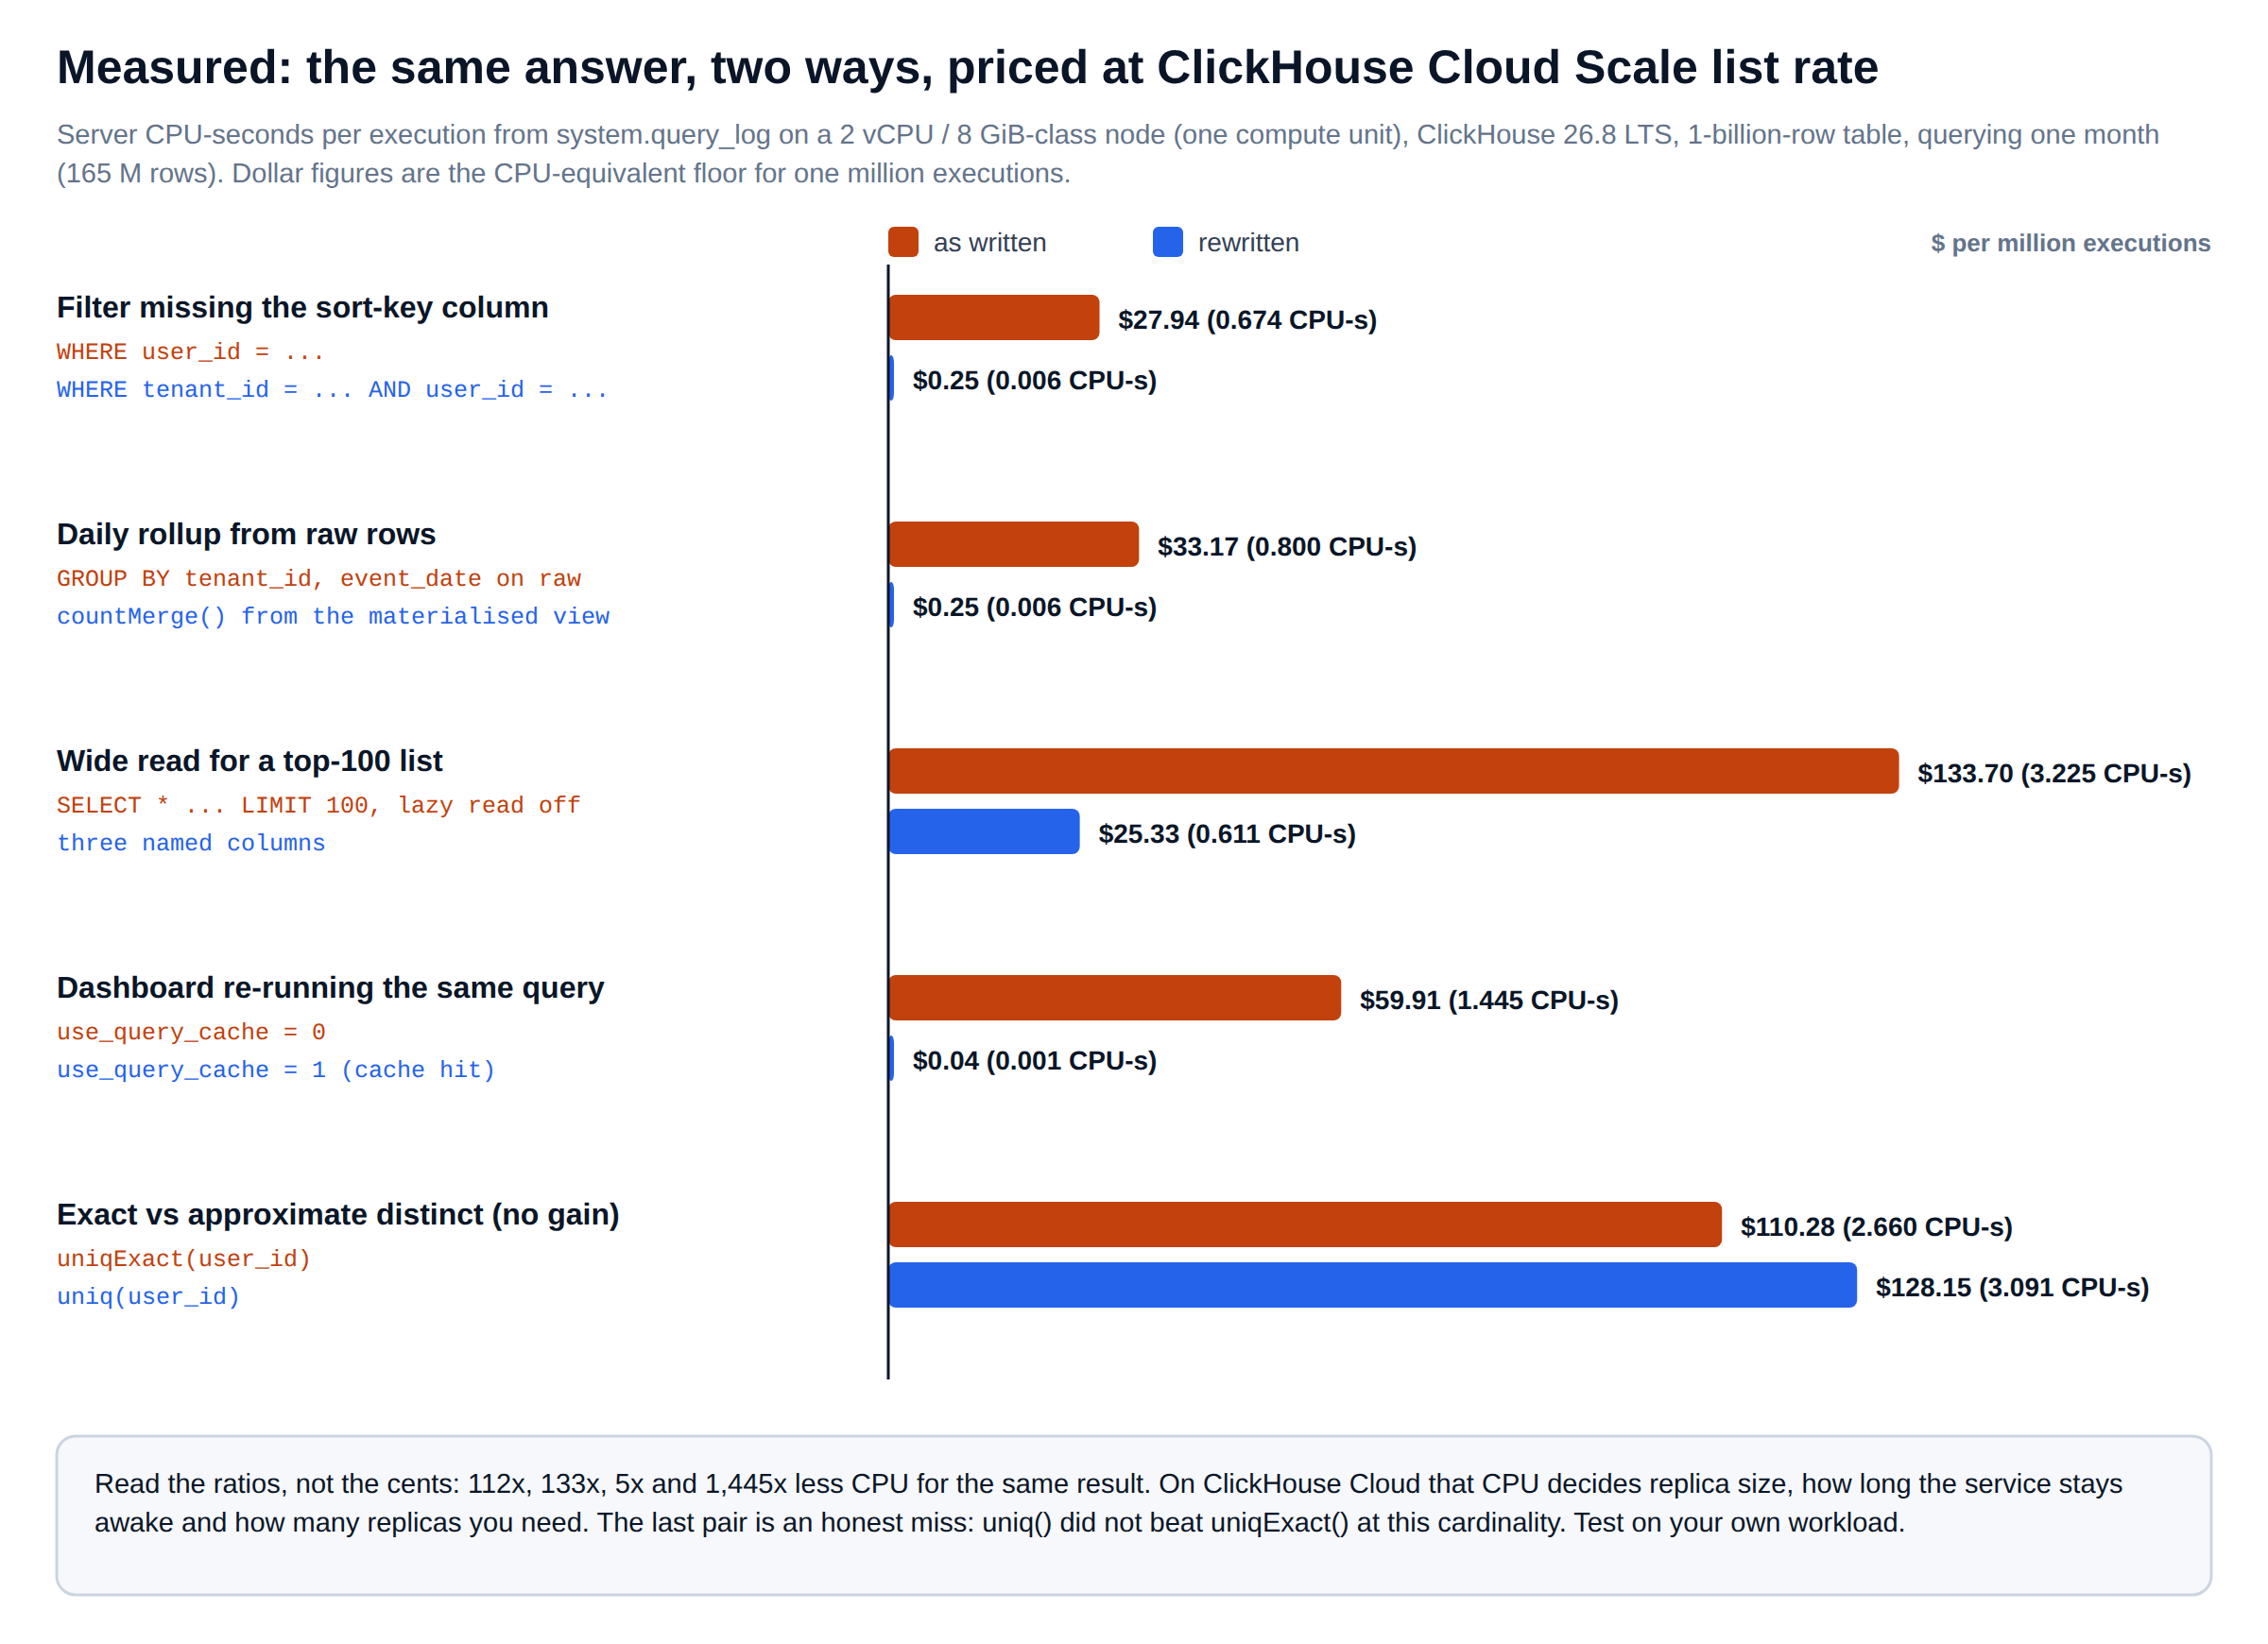
| Pattern | As written | Rewritten | CPU ratio | Per million runs (Scale) |
|---|---|---|---|---|
| Filter missing the leading sort-key column | 0.674 CPU-s, 20,146 marks | 0.006 CPU-s, 42 marks | 112× | $27.94 → $0.25 |
| Daily rollup computed from raw rows | 0.800 CPU-s, 165 M rows | 0.006 CPU-s, 10 K rows | 133× | $33.17 → $0.25 |
Top-100 list with SELECT *, lazy read off | 3.225 CPU-s, 1.76 GiB read | 0.611 CPU-s, 0.91 GiB read | 5.3× | $133.70 → $25.33 |
| Dashboard re-running an identical query | 1.445 CPU-s | 0.001 CPU-s, cache hit | 1,445× | $59.91 → $0.04 |
uniqExact replaced by uniq | 2.660 CPU-s | 3.091 CPU-s | 0.86× | $110.28 → $128.15 |
The last row is the one we would rather not have, and it stays in. Swapping an exact distinct count for an approximate one is standard advice, and at this cardinality it made the query slower. Advice that is not measured on your own data is how teams end up paying for rewrites that do nothing.
Pattern 1
Filters that miss the sort key: the most common ClickHouse Cloud cost leak
The table is ordered by (tenant_id, event_time). A query that filters on user_id alone cannot use the sparse primary index, so it reads all 20,146 marks in the partition. The application already knows the tenant; adding it to the predicate let the index skip to 42 marks. Same rows returned, 112 times less CPU, and the same factor off this query’s share of ClickHouse Cloud cost.
-- As written: user_id is not in the sort key, every granule in the month is read
SELECT countIf(http_status >= 500) / count() AS error_rate
FROM analytics.events
WHERE user_id = 4218139
  AND event_date >= '2026-06-01';
-- lab: 0.674 CPU-s, 165.03 M rows, 20,146 marks

-- Rewritten: the leading sort-key column narrows the scan to a few granules
SELECT countIf(http_status >= 500) / count() AS error_rate
FROM analytics.events
WHERE tenant_id = 42                -- known to the application from the session
  AND user_id = 4218139
  AND event_date >= '2026-06-01';
-- lab: 0.006 CPU-s, 0.34 M rows, 42 marks
When the access pattern genuinely has no tenant, the fix belongs in the table, not the query. A projection sorted by user_id gives those lookups their own index at the price of extra storage, which ClickHouse Cloud bills at the storage rate. Materialise it partition by partition so the rewrite is spread over time instead of landing as one burst of merge CPU.
-- Second sort order for user-centric lookups.
-- Cost: roughly another copy of the table in storage, billed at the TB-month rate.
ALTER TABLE analytics.events
    ADD PROJECTION IF NOT EXISTS prj_by_user
    (
        SELECT *
        ORDER BY (user_id, event_time)
    );

-- Build it one partition at a time; check system.mutations between runs.
ALTER TABLE analytics.events MATERIALIZE PROJECTION prj_by_user IN PARTITION 202610;
Check the plan before and after with EXPLAIN indexes = 1. The Granules line under PrimaryKey is the number that predicts ClickHouse Cloud cost for this pattern, long before the invoice does.
Pattern 2
Rollups recomputed from raw rows: ClickHouse Cloud cost paid on every refresh
A dashboard that shows events per tenant per day does not need 165 million rows each time it loads. A materialised view maintains the aggregate as data arrives, and the dashboard reads about ten thousand pre-aggregated rows instead. In the lab that cut CPU per execution from 0.800 to 0.006 seconds.
-- Target table holds partial aggregate states, merged in the background.
CREATE TABLE IF NOT EXISTS analytics.events_daily
(
    tenant_id  UInt16,
    day        Date,
    events     AggregateFunction(count),
    errors     AggregateFunction(countIf, UInt8),
    users      AggregateFunction(uniqCombined(12), UInt32)
)
ENGINE = AggregatingMergeTree()
PARTITION BY toYYYYMM(day)
ORDER BY (tenant_id, day)
SETTINGS index_granularity = 8192;

-- Fires on every INSERT into analytics.events; existing rows need a one-off backfill.
CREATE MATERIALIZED VIEW IF NOT EXISTS analytics.mv_events_daily
TO analytics.events_daily
AS
SELECT
    tenant_id,
    toDate(event_time)                AS day,
    countState()                      AS events,
    countIfState(http_status >= 500)  AS errors,
    uniqCombinedState(12)(user_id)    AS users
FROM analytics.events
GROUP BY tenant_id, day;

-- The dashboard query: merge the states, never touch raw rows.
SELECT tenant_id, day, countMerge(events) AS events
FROM analytics.events_daily
WHERE day >= '2026-06-01'
GROUP BY tenant_id, day
ORDER BY tenant_id, day;
The view moves work from read time to insert time, so it is not free. Every insert now does a small aggregation, and on ClickHouse Cloud that runs on the same billed compute. For a table that is written once and read thousands of times a day, the trade is overwhelmingly in favour of the view, and the ClickHouse Cloud cost of the dashboard drops with it.
Pattern 3 and 4
Wide reads and repeated dashboards: the quiet ClickHouse Cloud cost
A columnar engine charges for the columns it reads. SELECT * for a top-100 list read 1.76 GiB and spent 3.225 CPU-seconds with lazy materialisation switched off; naming the three columns the screen shows cut that to 0.611. On current releases lazy materialisation is on by default and narrows the gap for ORDER BY … LIMIT shapes, but it cannot help the queries that need every row of every column, such as exports.
The largest single saving in the lab came from not running the query at all. A dashboard tile that twenty people refresh returns the same answer every time until new data lands. With the query cache, the second execution cost 0.001 CPU-seconds instead of 1.445. The trade is staleness up to the cache TTL, which is a product decision, not an engineering one.
-- Per-query: serve identical SELECTs from the result cache for 60 seconds.
SELECT tenant_id, count() AS events, avg(latency_ms) AS avg_latency
FROM analytics.events
WHERE event_date >= today() - 30
GROUP BY tenant_id
SETTINGS use_query_cache = 1, query_cache_ttl = 60;

-- Name the columns the screen shows; never SELECT * behind a dashboard.
SELECT event_time, url_path, latency_ms
FROM analytics.events
WHERE event_date >= today() - 30
ORDER BY latency_ms DESC
LIMIT 100;Replacing uniqExact(user_id) with uniq(user_id) made the query 16% more expensive in our lab at this cardinality per tenant. Approximate functions save memory and CPU when the distinct count per group is large; when it is small, the exact hash set is cheap and the sketch overhead dominates. Measure before you change it.
Find them first
Attributing ClickHouse Cloud cost to query fingerprints
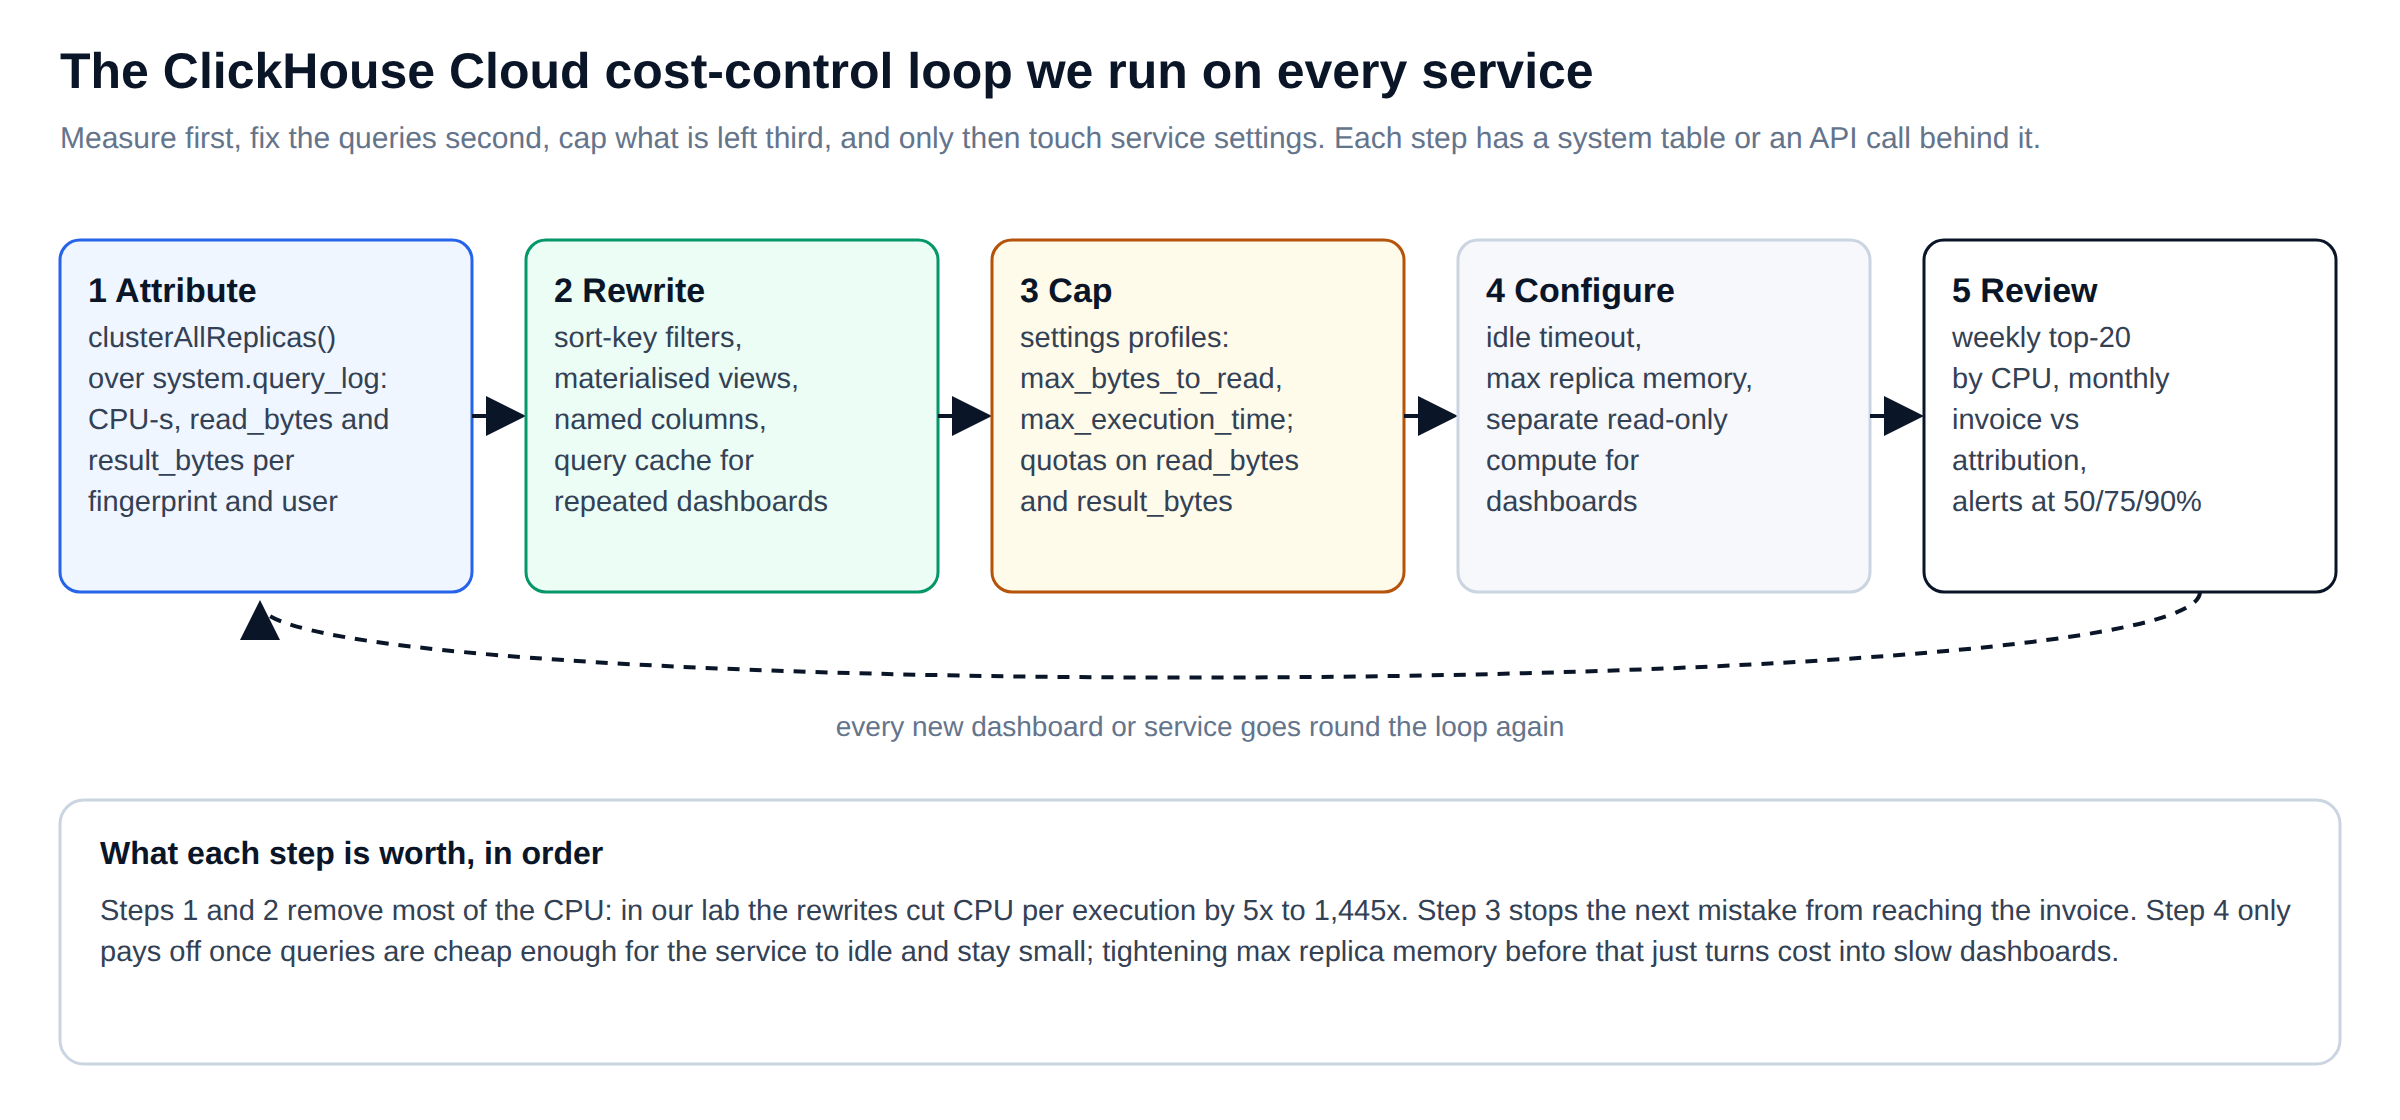
ClickHouse Cloud writes system.query_log on each replica, so attribution has to read all of them through clusterAllReplicas('default', …). The query below ranks fingerprints by CPU over seven days and converts CPU-seconds into compute-unit hours at whatever price you pass in. It is the first query we run on any ClickHouse Cloud cost engagement.
-- Top query fingerprints by CPU across every replica, last 7 days.
-- Run with: clickhouse client --param_unit_price=0.2985   (your tier's $ per unit-hour)
SELECT
    normalizedQueryHash(query)                                          AS fingerprint,
    any(user)                                                           AS sample_user,
    count()                                                             AS executions,
    round(sum(ProfileEvents['OSCPUVirtualTimeMicroseconds']) / 1e6, 1)  AS cpu_seconds,
    round(cpu_seconds / 7200, 3)                                        AS unit_hours,   -- 1 unit = 2 vCPU
    round(unit_hours * {unit_price:Float64}, 2)                         AS cpu_equivalent_usd,
    formatReadableSize(sum(read_bytes))                                 AS bytes_read,
    formatReadableSize(sum(result_bytes))                               AS bytes_returned,
    formatReadableSize(max(memory_usage))                               AS peak_memory,
    substring(any(query), 1, 100)                                       AS example
FROM clusterAllReplicas('default', system.query_log)
WHERE type = 'QueryFinish'
  AND event_date >= today() - 7
  AND query_kind = 'Select'
GROUP BY fingerprint
ORDER BY cpu_seconds DESC
LIMIT 20;
The column to argue about is cpu_equivalent_usd. It is a floor, not the invoice: it ignores idle capacity, the second replica and storage. Its value is ranking. When a handful of fingerprints dominate the list, most of the avoidable ClickHouse Cloud cost sits in queries someone can name and fix this week.
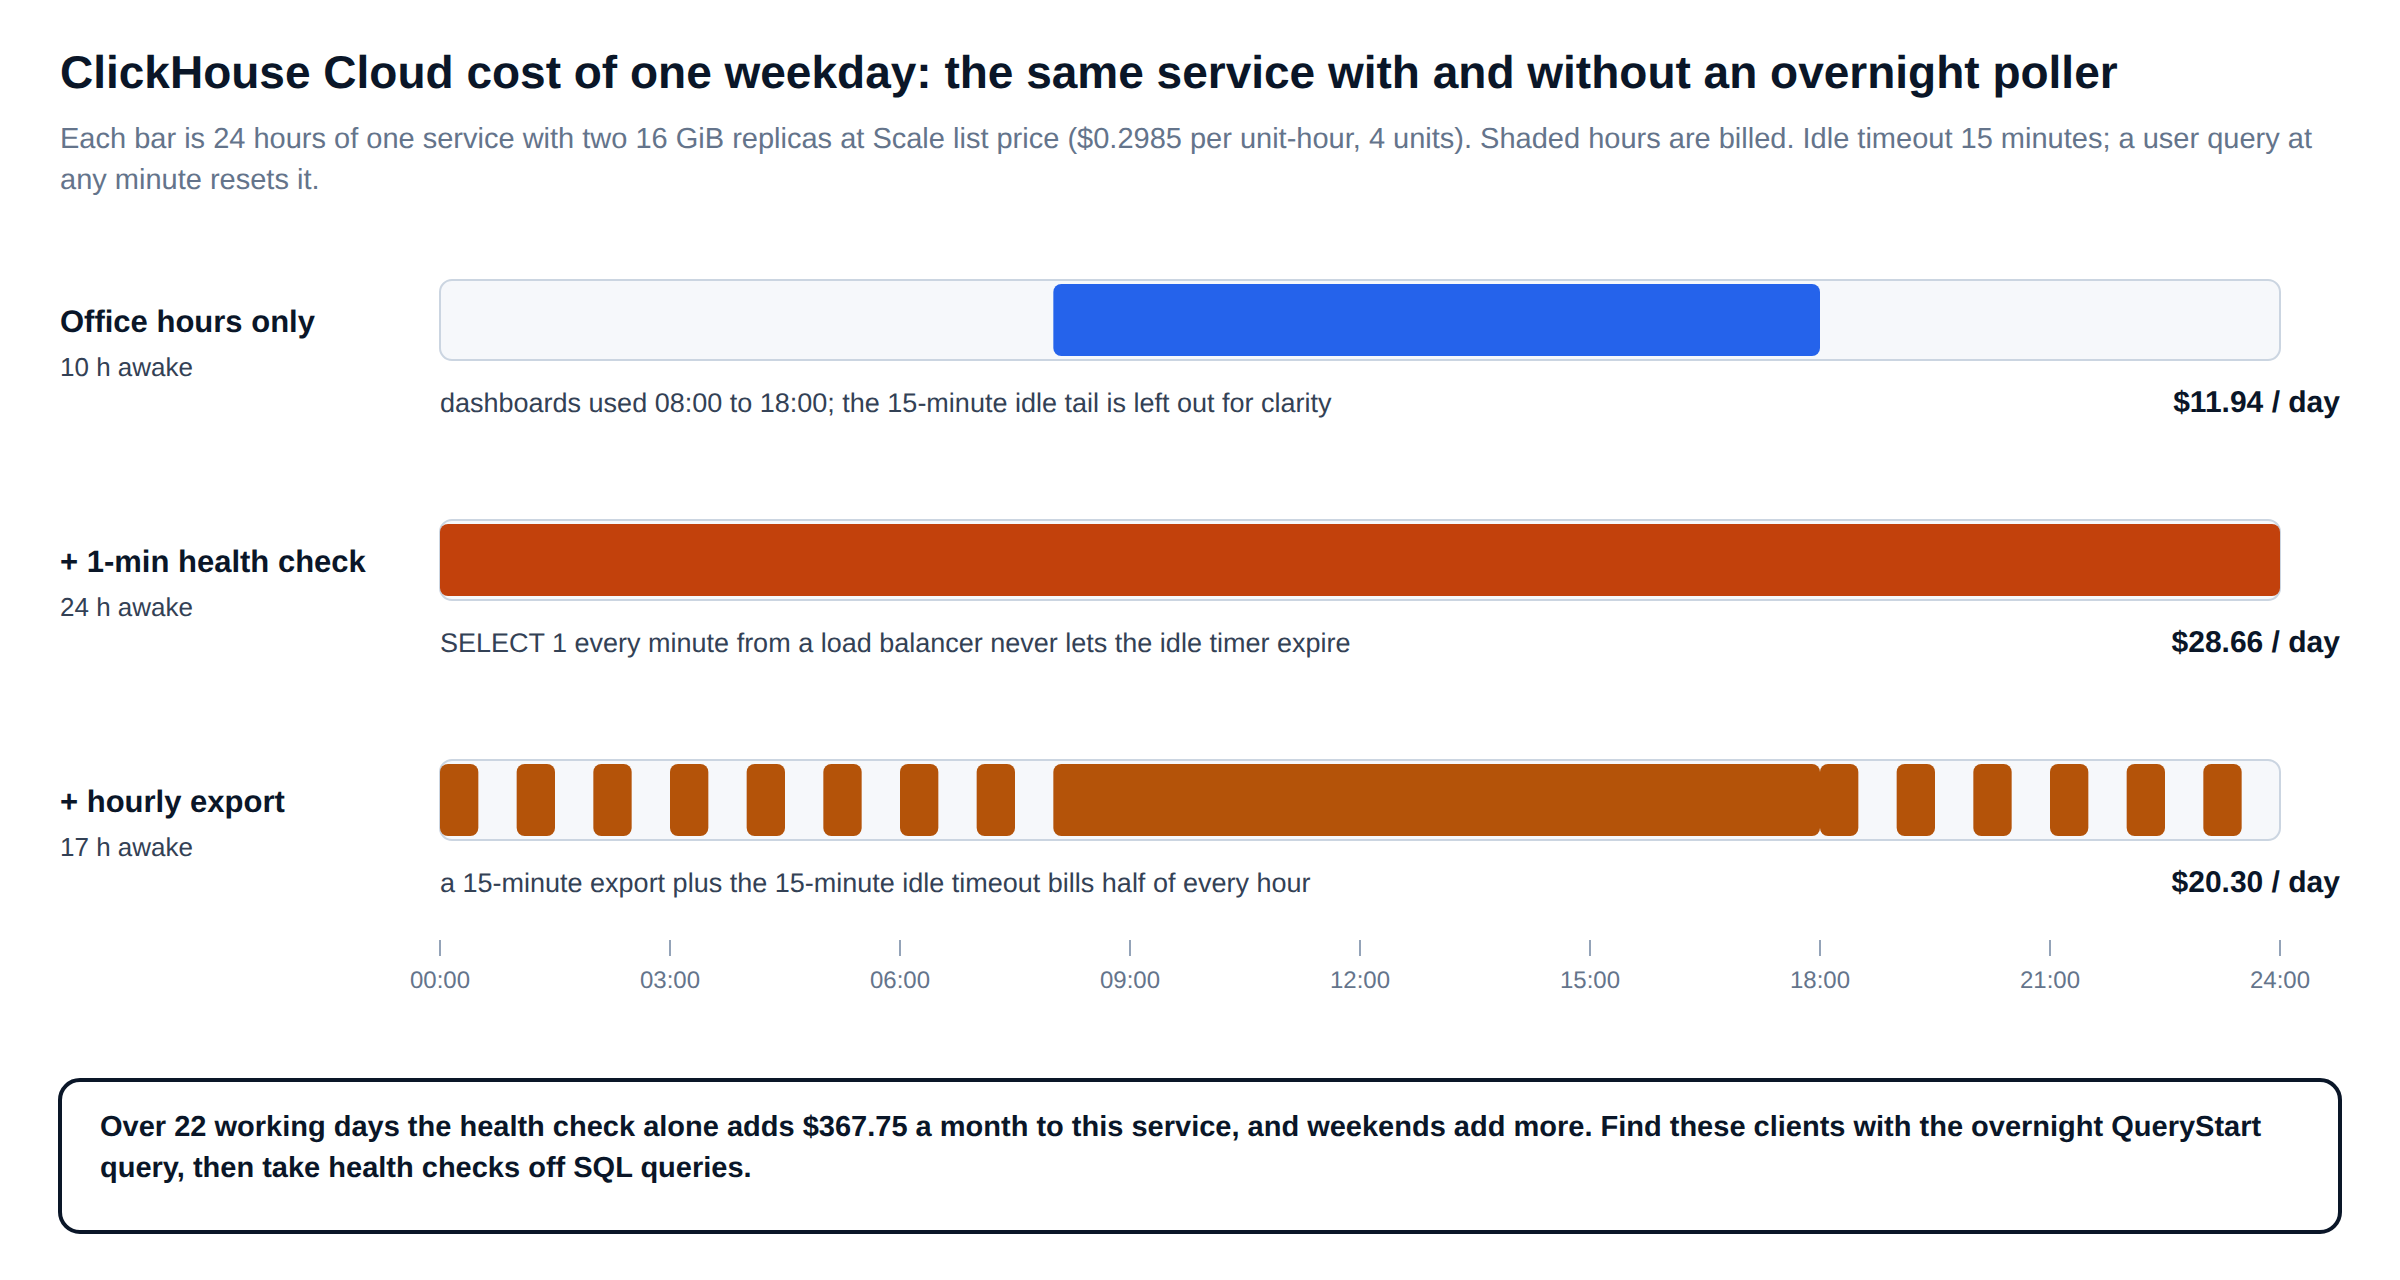
Two more queries explain the service-level multipliers. The first shows CPU demand per five-minute window, which is what vertical autoscaling reacts to. The second lists who is querying outside working hours, which is what stops a service from idling.
-- CPU demand per 5-minute window: the signal behind vertical autoscaling.
SELECT
    toStartOfFiveMinutes(event_time)                                          AS window_start,
    count()                                                                   AS queries,
    round(sum(ProfileEvents['OSCPUVirtualTimeMicroseconds']) / 1e6 / 300, 2) AS avg_busy_vcpus,
    formatReadableSize(max(memory_usage))                                     AS peak_query_memory
FROM clusterAllReplicas('default', system.query_log)
WHERE type = 'QueryFinish'
  AND event_date >= today() - 1
GROUP BY window_start
ORDER BY avg_busy_vcpus DESC
LIMIT 20;

-- Who keeps the service awake overnight: every user query resets the idle timer.
SELECT
    toHour(event_time)             AS hour_utc,
    user,
    client_name,
    http_user_agent,
    count()                        AS queries,
    substring(any(query), 1, 60)   AS example
FROM clusterAllReplicas('default', system.query_log)
WHERE type = 'QueryStart'
  AND event_date >= today() - 7
  AND (toHour(event_time) < 6 OR toHour(event_time) >= 20)
GROUP BY hour_utc, user, client_name, http_user_agent
ORDER BY queries DESC
LIMIT 20;
The overnight list is usually short and embarrassing: a health check sending SELECT 1 every minute, a BI tool refreshing an unused dashboard, an exporter on a cron. Each one costs the difference between 730 billed hours and the hours anyone actually works, which on an idle-capable service is often the largest single ClickHouse Cloud cost saving available.
-- Result bytes by user and interface: the egress side of ClickHouse Cloud pricing.
-- Run with: --param_egress_per_gb=0.1152   (public-internet rate; inter-region is lower)
SELECT
    user,
    interface,
    count()                                                       AS queries,
    formatReadableSize(sum(result_bytes))                         AS returned,
    round(sum(result_bytes) / 1e9 * {egress_per_gb:Float64}, 2)   AS egress_usd_if_public
FROM clusterAllReplicas('default', system.query_log)
WHERE type = 'QueryFinish'
  AND event_date >= today() - 30
GROUP BY user, interface
ORDER BY sum(result_bytes) DESC
LIMIT 20;
Cap what is left
Guardrails that stop expensive ClickHouse queries reaching the ClickHouse Cloud cost line
Rewrites fix the queries you know about. Settings profiles and quotas stop the next one. Attach them to a role that dashboards and BI tools use, never to the admin user, and size the limits from the attribution query rather than from a blog post, including this one.
-- Per-query ceilings for dashboard and BI traffic.
-- Values are starting points; derive yours from the p99 of the attribution query.
CREATE SETTINGS PROFILE IF NOT EXISTS dashboard_guardrails
SETTINGS
    max_execution_time    = 30,              -- seconds; a tile that needs more is a design problem
    timeout_overflow_mode = 'throw',
    max_bytes_to_read     = 50000000000,     -- 50 GB scanned per query
    read_overflow_mode    = 'throw',
    max_result_bytes      = 100000000,       -- 100 MB returned: stops accidental exports and egress
    result_overflow_mode  = 'throw',
    max_memory_usage      = 8000000000,      -- 8 GB per query, below the replica size
    max_threads           = 8,               -- leave headroom for other tenants of the replica
    use_query_cache       = 1,               -- identical refreshes are served from cache
    query_cache_ttl       = 60
TO dashboard_role;

-- Per-hour budget for the same role across all its queries.
CREATE QUOTA IF NOT EXISTS dashboard_hourly
FOR INTERVAL 1 hour
MAX queries = 20000, read_bytes = 2000000000000, result_bytes = 20000000000, execution_time = 7200
TO dashboard_role;

-- Rollback without dropping anything: detach both from the role.
ALTER SETTINGS PROFILE dashboard_guardrails TO NONE;
ALTER QUOTA dashboard_hourly TO NONE;
Expect the first week to produce errors. A dashboard that hits TOO_MANY_BYTES was spending money you did not know about, and the error is the cheapest way to find it. A guardrail is the cheapest ClickHouse Cloud cost control there is. Apply the profile in staging first, review the failures with the dashboard owners, and only then attach it to the production role.
Then configure the service
Idling, replica limits and separate compute: service-level ClickHouse Cloud cost controls
Once queries are cheap, service settings start to pay. Idling lets a service stop billing compute when no user queries arrive; the timeout can be as low as five minutes, though services with long start-up times get a longer adaptive minimum. Vertical autoscaling limits stop a bad week from resizing every replica. Both are set per service in the console or through the ClickHouse Cloud API.
# Cap vertical autoscaling and enable idling for one service.
# Credentials are placeholders; the API key needs control-plane:service:manage-scaling-config.
curl -sS -X PATCH \
  --user "${CH_CLOUD_KEY_ID}:${CH_CLOUD_KEY_SECRET}" \
  -H 'Content-Type: application/json' \
  "https://api.clickhouse.cloud/v1/organizations/${CH_ORG_ID}/services/${CH_SERVICE_ID}/replicaScaling" \
  -d '{
        "minReplicaMemoryGb": 16,
        "maxReplicaMemoryGb": 64,
        "idleScaling": true,
        "idleTimeoutMinutes": 15
      }'
# Rollback: send the previous values, recorded from the console before the change.
Order matters. Lowering the maximum replica memory while expensive ClickHouse queries are still running does not reduce cost; it converts cost into slow dashboards and memory-limit errors. Idling also has a price: connections can time out while the service wakes, so applications need retries. Background merges, high part counts and inserts on another read-write service in the same warehouse can keep a service awake.
For mixed workloads, compute-compute separation lets a read-only service serve dashboards from the same storage while ingestion runs elsewhere. Compute is priced the same for every service in the warehouse and storage is billed once. The read-only service skips background merges, can idle on its own schedule, and can be sized for the dashboard peak instead of the ingest peak, which keeps ClickHouse Cloud cost proportional to each workload.
Model it before you change it
A ClickHouse Cloud cost model you can run
We keep a small model next to every recommendation, so the conversation with finance is about inputs rather than opinions. It reproduces the worked example in Figure 1; replace the prices with your contract and region.
#!/usr/bin/env python3
"""Monthly ClickHouse Cloud cost model for one service (prices: list, AWS us-east-1, Oct 2026)."""
UNIT_PRICE = {"basic": 0.2181, "scale": 0.2985, "enterprise": 0.3903}  # $ per compute-unit hour
STORAGE_PER_TB_MONTH = 25.30   # $ per TB-month, compressed; backups billed at the same rate
EGRESS_PER_GB = 0.1152         # $ per GB to the public internet
GIB_PER_UNIT = 8               # 1 compute unit = 8 GiB RAM + 2 vCPU


def compute_cost(tier, replicas, replica_gib, awake_hours):
    """Provisioned compute: units per replica x replicas x hours awake x price."""
    return replica_gib / GIB_PER_UNIT * replicas * awake_hours * UNIT_PRICE[tier]


def monthly_bill(tier, replicas, base_gib, peak_gib, peak_hours, awake_hours,
                 stored_tb, backup_tb, egress_gb):
    base = compute_cost(tier, replicas, base_gib, awake_hours)
    burst = compute_cost(tier, replicas, peak_gib - base_gib, peak_hours)  # extra size only
    storage = (stored_tb + backup_tb) * STORAGE_PER_TB_MONTH
    egress = egress_gb * EGRESS_PER_GB
    return {"compute_base": base, "compute_burst": burst, "storage": storage,
            "egress": egress, "total": base + burst + storage + egress}


before = monthly_bill("scale", 2, 16, 64, 220, 730, 4, 4, 2048)   # always on, bursting, exporting
after = monthly_bill("scale", 2, 16, 16, 0, 220, 4, 4, 50)        # idling, no burst, exports capped
print({k: round(v, 2) for k, v in before.items()})
# {'compute_base': 871.62, 'compute_burst': 788.04, 'storage': 202.4, 'egress': 235.93, 'total': 2097.99}
print({k: round(v, 2) for k, v in after.items()})
# {'compute_base': 262.68, 'compute_burst': 0.0, 'storage': 202.4, 'egress': 5.76, 'total': 470.84}
The model is deliberately simple and its inputs are illustrative; it shows where ClickHouse Cloud cost moves, not what your invoice will say. It says nothing about whether your service can idle for 510 hours a month; only the overnight query list can tell you that.
Checklist
The ClickHouse Cloud cost checklist
| Check | Where to look | What to change |
|---|---|---|
| Which queries cost the most | CPU-seconds per fingerprint, clusterAllReplicas over system.query_log | Rewrite the top three before touching anything else |
| Filters that skip no granules | EXPLAIN indexes = 1, SelectedMarks close to total marks | Add the leading sort-key column, or a projection for the other access path |
| Rollups on raw rows | Same fingerprint, high read_rows, small result | Materialised view into AggregatingMergeTree |
| Repeated identical dashboards | High executions per fingerprint | use_query_cache with a TTL the product owner accepts |
| Service never idles | Overnight QueryStart by user and client | Move health checks off SQL, pause unused dashboards, set an idle timeout |
| Autoscaling bursts | Busy vCPUs and peak memory per five-minute window | Fix the queries first, then set a maximum replica memory |
| Egress | result_bytes by user and interface | max_result_bytes on BI roles; exports to object storage in-region |
| Next mistake | Errors from the guardrail profile | Settings profile and hourly quota on the dashboard role |
None of this argues against ClickHouse Cloud. For many teams a managed service with idling and per-minute billing is cheaper than running clusters themselves, and we support customers on both. The point is narrower: expensive ClickHouse queries are a ClickHouse Cloud cost problem first, and the fix is in the SQL. Test every change on a staging copy of your own workload, and keep the rollback for every service setting before you apply it.
Related reading: our guides to advanced ClickHouse troubleshooting, how ClickHouse query execution works and why ClickHouse is so fast, plus the ClickHouse documentation on billing and automatic scaling.
Prices: ClickHouse Cloud list prices for AWS us-east-1 as shown on clickhouse.com/pricing on 2 October 2026; regions, contracts and committed-spend discounts differ. Measurements: ChistaDATA lab, 2 vCPU, ClickHouse 26.8.11.7 LTS, 1,000,000,000-row MergeTree table, second of two runs, server-side CPU from system.query_log. Worked examples are illustrative arithmetic, not customer data.
ChistaDATA
Want the attribution run on your own service?
ChistaDATA engineers run ClickHouse Cloud cost reviews on production services: fingerprint attribution, query and schema rewrites with measured before-and-after CPU, guardrail profiles, and idling and autoscaling settings with a rollback for every change. We also support self-managed ClickHouse, with 24×7×365 coverage and a 15-minute Severity 1 response.
Running ClickHouse in production? ChistaDATA provides ClickHouse consulting for architecture, performance and migrations, and 24×7 ClickHouse support with a 15-minute S1 response. For day-to-day operations see ClickHouse DBA services and ClickHouse managed services.
