ChistaDATA · Data fabric engineering on 100% open-source, cloud-native ClickHouse
A data fabric is the layer that lets an organisation treat data from OLTP databases, event streams, lakes and SaaS tools as one queryable estate, with the same governance, the same freshness guarantees and the same access path everywhere. ChistaDATA designs and operates data fabric platforms with ClickHouse as the serving core, deployed cloud-natively on Kubernetes in your own account, for real-time analytics, artificial intelligence and machine learning workloads.
This page is the engineering description of that platform: the six layers of the data fabric, the ingestion paths and the consistency guarantee each one gives, the Kubernetes and object-storage topology, the physical ClickHouse design, the governance model, how features and embeddings are served to machine learning, and how every layer is measured.
On this page
- What a data fabric is, precisely
- Data fabric reference architecture
- Layer 2 · Ingestion paths and consistency
- Layer 3 · The cloud native ClickHouse serving core
- Deployment topology on Kubernetes
- Layer 4 · Semantic and integration layer
- Layer 6 · Governance and security
- Data fabric for artificial intelligence and machine learning
- Observability and SLOs
- Industry patterns
- How ChistaDATA delivers a data fabric
- Data fabric FAQ
Definition
What a data fabric is, and what a ClickHouse data fabric is not
The term is used loosely, so it is worth being exact. A data fabric is a metadata-driven integration and serving layer that spans distributed sources without forcing them into one physical store. It has six responsibilities that always travel together.
They are: connecting to sources without rewriting them, ingesting with a declared freshness and consistency contract, serving queries at the latency the consumers need, exposing a semantic layer so consumers do not need to know where a column came from, governing access and retention uniformly, and observing itself so freshness and cost are measured per dataset. Remove any one of those and what remains is a set of pipelines.
ChistaDATA’s data fabric puts ClickHouse at the serving core because the consumers that justify the investment, real-time dashboards, embedded product analytics, feature reads for machine learning, ad-hoc exploration over years of events, all need sub-second answers over columnar data at high concurrency. ClickHouse delivers that on commodity hardware and object storage, in your own cloud account, with no proprietary format between you and your data.
It is equally important to say what this data fabric is not. It is not a replacement for the transactional databases that own writes; those stay where they are and are read through change data capture. It is not a lakehouse replacement; Iceberg and Delta tables on object storage remain the long-term store of record for cold data and are queried in place or loaded from. And it is not a data mesh organisational model; a data fabric is the platform that a mesh, a central team or a single product team can run on. The distinction matters because the most expensive platform failures we review are platforms that tried to be all three.
Reference architecture
Data fabric reference architecture on cloud-native ClickHouse
The diagram below is the topology ChistaDATA deploys. Sources on the left are owned by their teams and are never rewritten by the data fabric. The ingestion layer lands data through one of four paths, each with a declared contract. The serving core is a ClickHouse cluster managed by an operator on Kubernetes, with hot partitions on local NVMe and cold partitions on object storage. The semantic layer carries dictionaries, catalog metadata and the access endpoints, including the ChistaDATA Fabric gateway. Consumers are analytics tools and the artificial intelligence and machine learning stack. Governance and observability span every layer.
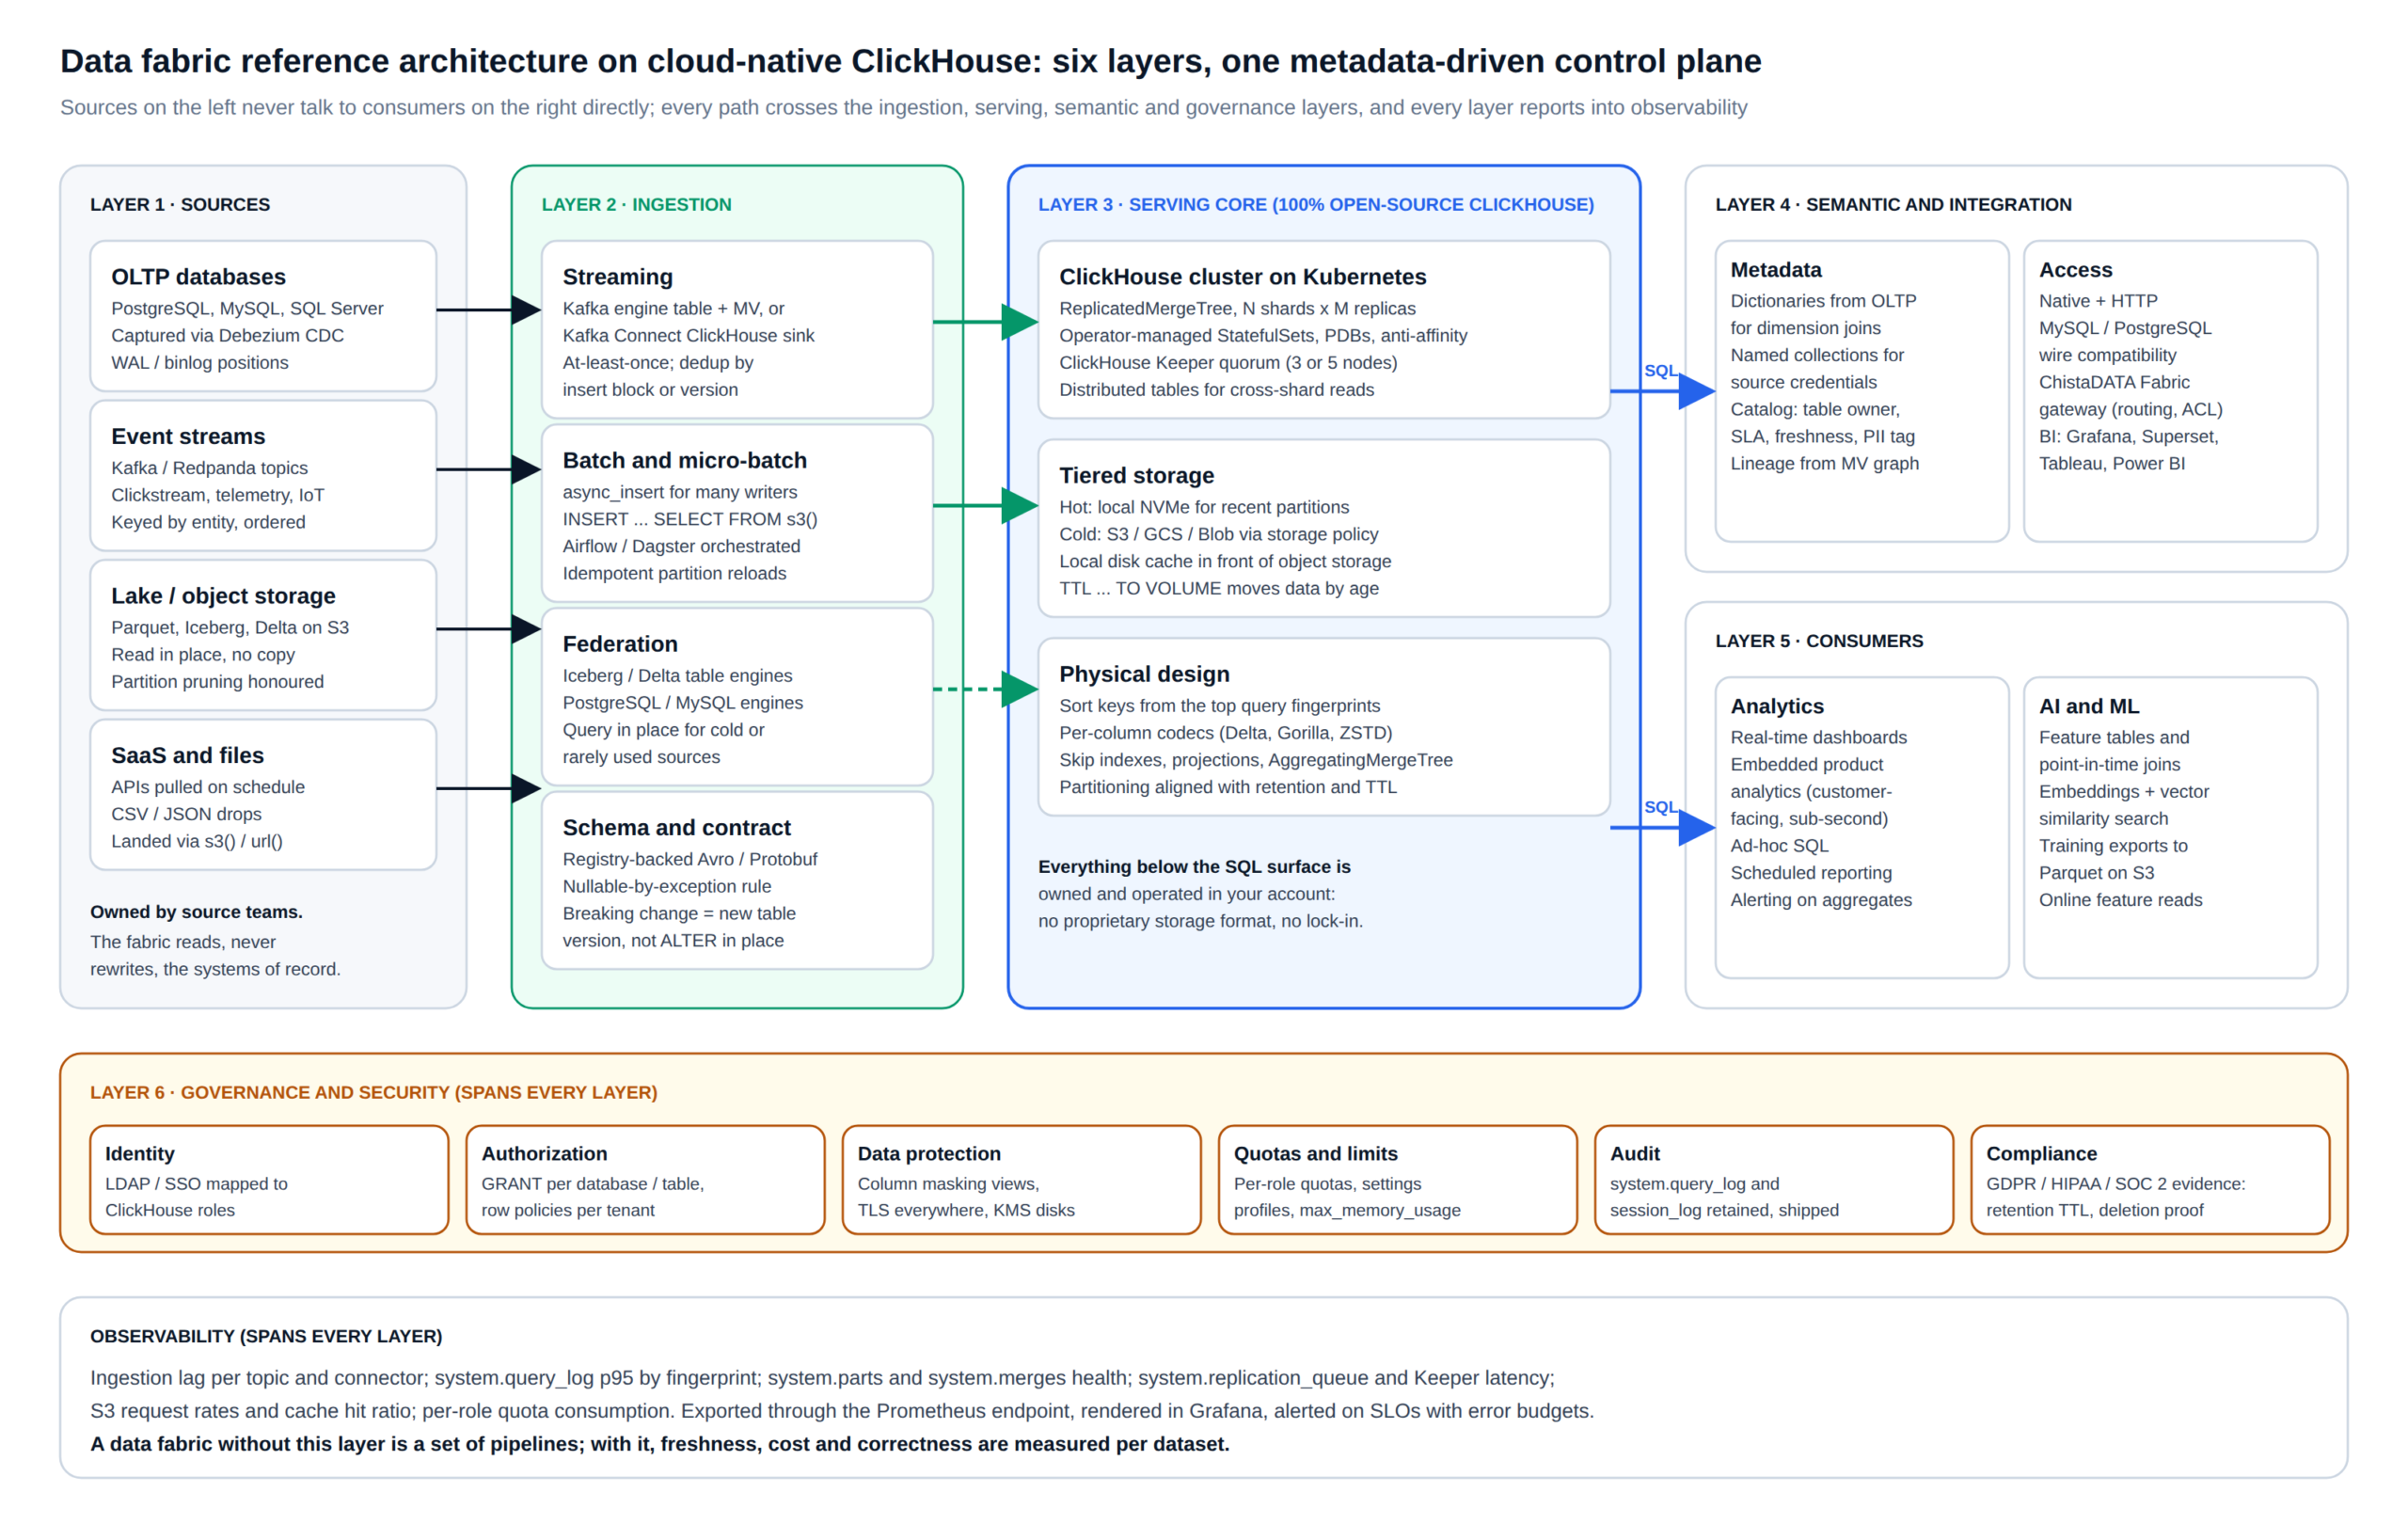
Three properties of this design carry most of its value. Sources are read-only to the platform, so adopting it never puts a transactional system at risk. Every dataset carries a written contract (append-only events or upserted entities, freshness target, owner, retention, PII classification) that the ingestion, serving and governance layers all enforce. And the serving core is plain ClickHouse: any client that speaks its native or HTTP protocol, or the MySQL and PostgreSQL wire protocols it also understands, can use the platform without a vendor SDK.
Layer 2 · Ingestion
Four ingestion paths into the data fabric, and what each one guarantees
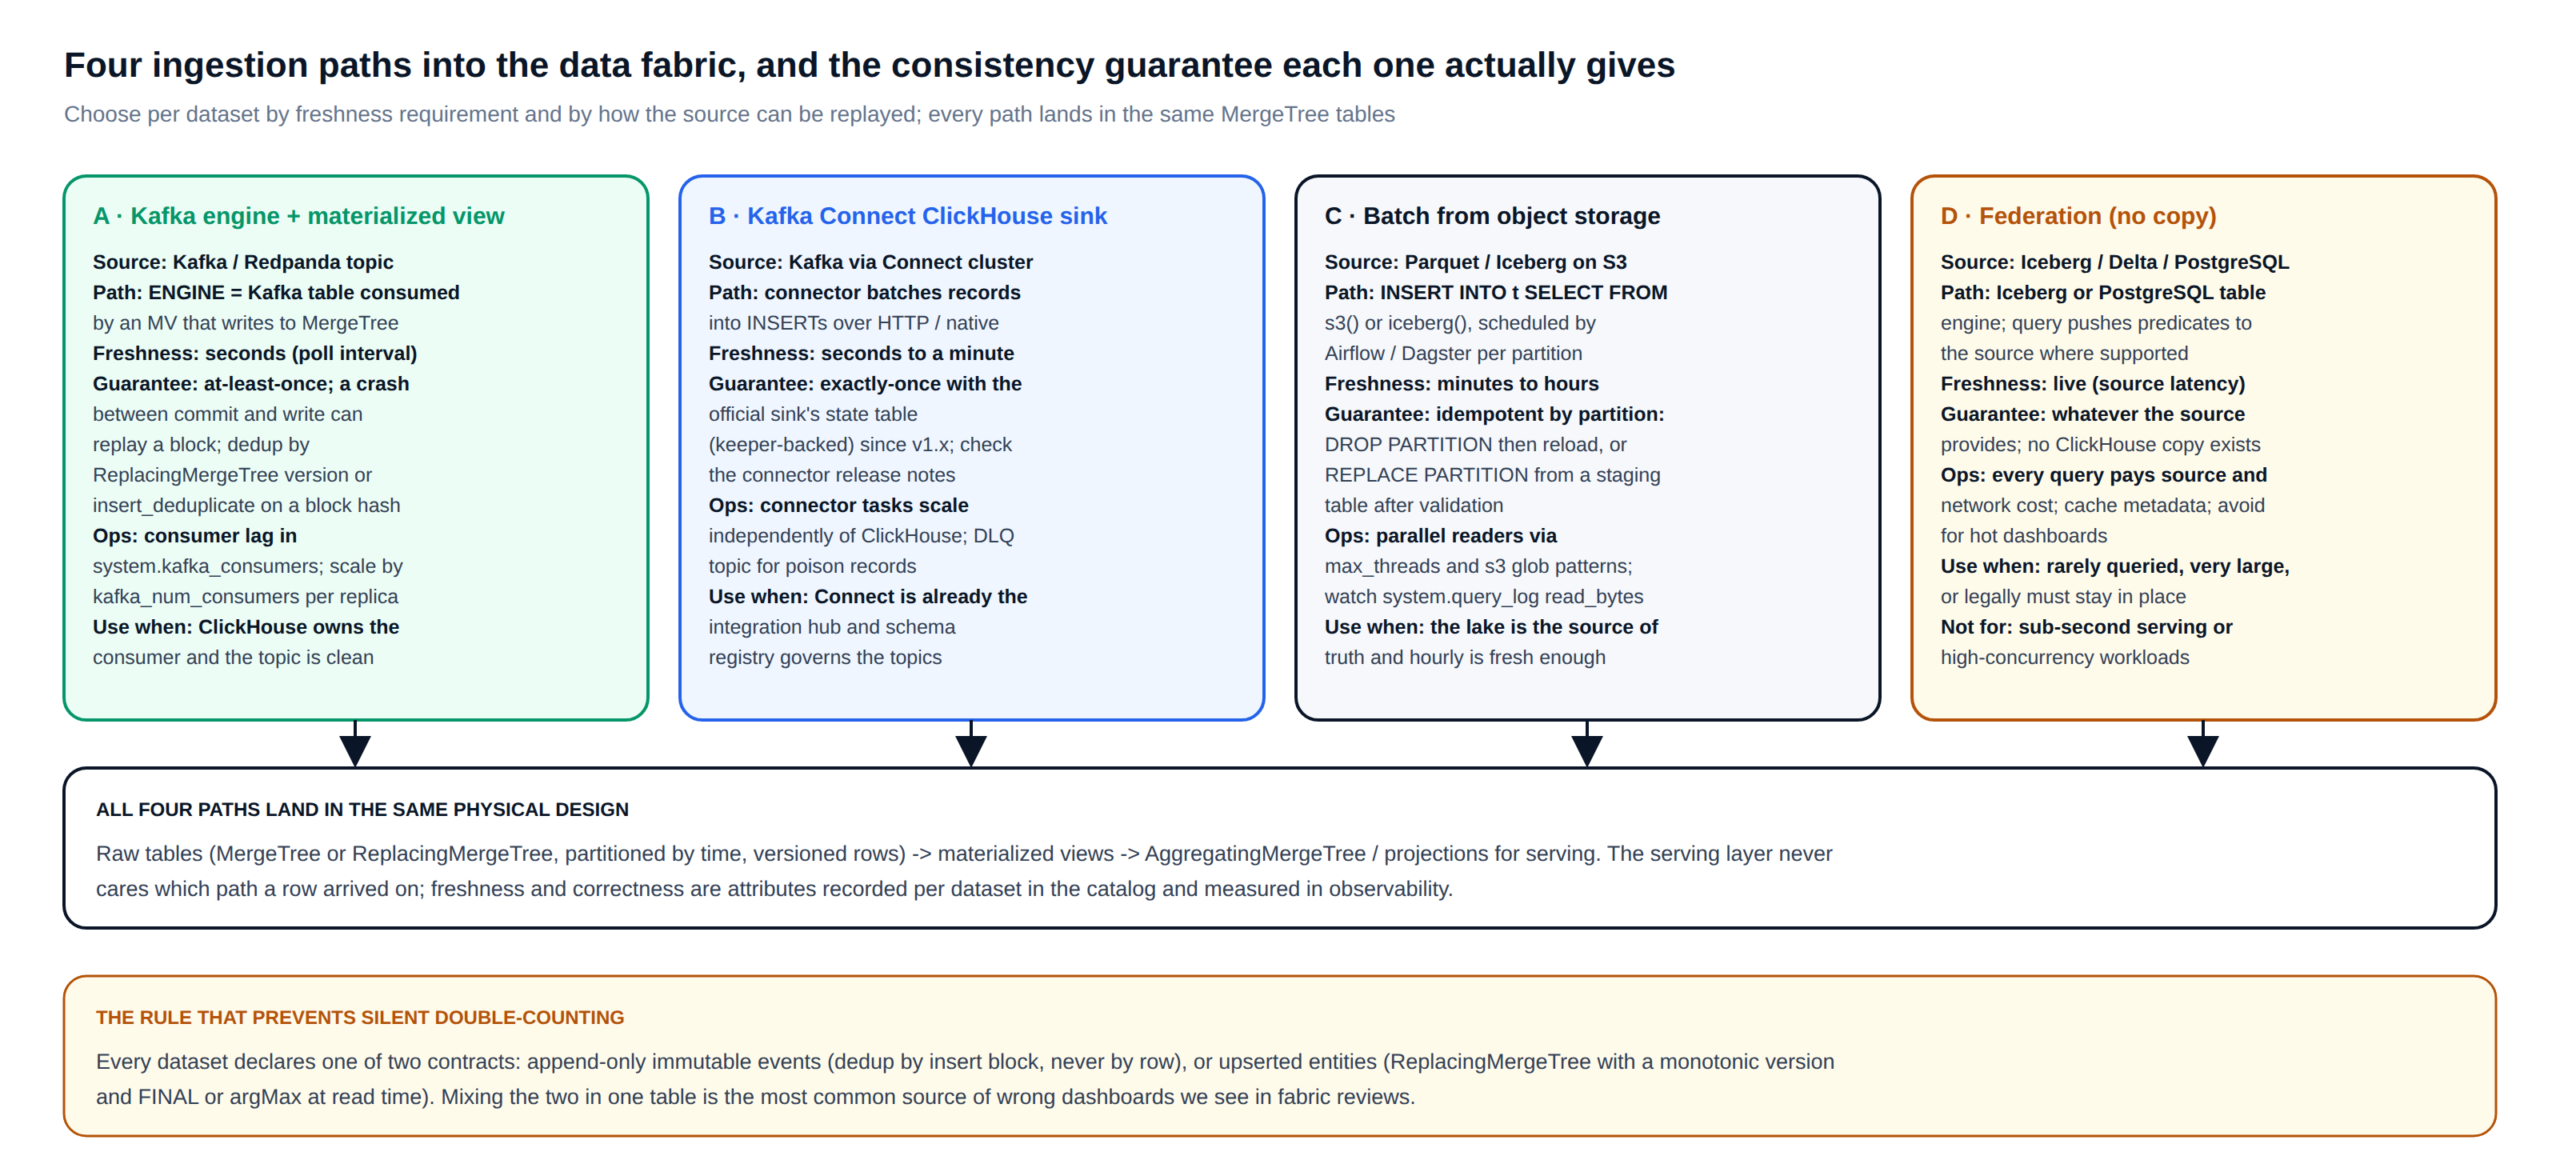
Ingestion is where these platforms most often go wrong, usually by treating every source the same way. ChistaDATA classifies each dataset by two questions: how fresh must it be, and how can the source be replayed if the pipeline fails? The answers select one of four paths, shown below with the consistency guarantee each actually provides rather than the one its documentation implies.
Path A: Kafka engine table with a materialized view
ClickHouse consumes the topic itself. A table with ENGINE = Kafka holds no data; a materialized view attached to it receives every polled block and writes it into a MergeTree table. Delivery is at-least-once: if a replica crashes between committing the Kafka offset and completing the insert, or the reverse, a block can be replayed. The platform handles that by declaring the dataset’s contract up front. Append-only events rely on insert-block deduplication (a block with the same hash is dropped by the replicated engine), and upserted entities use ReplacingMergeTree with a monotonic version.
-- ClickHouse 25.x / 26.x LTS: streaming ingestion for the data fabric
CREATE TABLE fabric.events_kafka ON CLUSTER '{cluster}'
(
    event_id    UUID,
    tenant_id   UInt32,
    entity_id   UInt64,
    event_type  LowCardinality(String),
    event_time  DateTime64(3, 'UTC'),
    payload     String
)
ENGINE = Kafka
SETTINGS
    kafka_broker_list        = '${KAFKA_BROKERS}',
    kafka_topic_list         = 'events.v2',
    kafka_group_name         = 'fabric-events-v2',
    kafka_format             = 'JSONEachRow',
    kafka_num_consumers      = 2,
    kafka_max_block_size     = 65536,
    kafka_handle_error_mode  = 'stream';

CREATE TABLE fabric.events ON CLUSTER '{cluster}'
(
    event_id    UUID,
    tenant_id   UInt32,
    entity_id   UInt64,
    event_type  LowCardinality(String),
    event_time  DateTime64(3, 'UTC') CODEC(DoubleDelta, ZSTD(3)),
    payload     String               CODEC(ZSTD(6)),
    ingested_at DateTime DEFAULT now()
)
ENGINE = ReplicatedMergeTree('/clickhouse/tables/{shard}/fabric/events', '{replica}')
PARTITION BY toYYYYMMDD(event_time)
ORDER BY (tenant_id, entity_id, event_time)
TTL toDateTime(event_time) + INTERVAL 90 DAY TO VOLUME 'cold',
    toDateTime(event_time) + INTERVAL 24 MONTH DELETE
SETTINGS storage_policy = 'tiered', index_granularity = 8192;

CREATE MATERIALIZED VIEW fabric.events_mv ON CLUSTER '{cluster}'
TO fabric.events AS
SELECT event_id, tenant_id, entity_id, event_type, event_time, payload
FROM fabric.events_kafka;
Rows that fail to parse are routed by kafka_handle_error_mode = 'stream' to virtual columns (_error, _raw_message) that a second materialized view captures into a dead-letter table, so a malformed producer never stalls the consumer. Consumer lag is read from system.kafka_consumers and exported to Prometheus; the alert threshold is the dataset’s freshness contract, not a fixed number.
Path B: Kafka Connect ClickHouse sink
When Kafka Connect is already the organisation’s integration hub and a schema registry governs the topics, the official ClickHouse sink connector is the better fit. Its tasks scale independently of the cluster, poison records go to a dead-letter topic, and recent versions provide exactly-once delivery through a Keeper-backed state table; the connector’s release notes are the authority on which guarantee applies to the version deployed. This path is preferred for Debezium CDC topics, because the Connect cluster is already running the source connectors.
Path C: batch from object storage
For datasets where hourly freshness is enough and the lake is the source of truth, the platform loads partitions with INSERT INTO ... SELECT FROM s3() or iceberg() under an orchestrator. The correctness rule is idempotency by partition: a reload drops or replaces the partition rather than appending to it, so a retried job cannot double-count.
-- Idempotent partition load into the data fabric from Parquet on S3
INSERT INTO fabric.orders_staging
SELECT *
FROM s3('https://${LAKE_BUCKET}.s3.amazonaws.com/orders/dt=2026-09-24/*.parquet', 'Parquet')
SETTINGS max_threads = 16, input_format_parquet_filter_push_down = 1;

-- Validation query BEFORE swapping: expected row count and checksum
SELECT count(), sum(cityHash64(order_id, status, total)) FROM fabric.orders_staging;

ALTER TABLE fabric.orders REPLACE PARTITION '20260924' FROM fabric.orders_staging;

-- Validation query AFTER: the live partition matches staging
SELECT count() FROM fabric.orders WHERE toYYYYMMDD(order_date) = 20260924;
Path D: federation without a copy
Some sources should not be copied: an Iceberg table that is petabytes and queried monthly, or a regulated PostgreSQL schema that legally must stay in place. ClickHouse’s Iceberg, Delta Lake, PostgreSQL and MySQL table engines let the platform query these in place, pushing predicates down where the engine supports it. Every such query pays the source’s latency and network cost, so federation is recorded in the catalog as a deliberate choice for cold or rarely used data, never as a default for anything a dashboard depends on.
Layer 3 · Serving core
The cloud native ClickHouse serving core of the data fabric
Everything a consumer touches is a ClickHouse table, and the physical design of those tables is where the platform’s latency and cost are decided. ChistaDATA derives it from measurement rather than convention: the top query fingerprints from the assessment choose the sort keys, the retention contract chooses the partitioning and TTL, and the column types choose the codecs. The DDL above shows the shape; the reasoning behind each decision is below.
The sort key leads with the columns that the most selective filters use, in order of cardinality, and ends with time.
With index_granularity = 8192, a point lookup by tenant and entity reads one or two granules; a time-range scan over one tenant reads a contiguous run of them. Partitioning by day aligns with the TTL move rule, so a whole partition ages from NVMe to object storage as one operation, and with retention deletion, so erasure of a day is a metadata change rather than a mutation. Codecs are chosen per column: DoubleDelta for timestamps that arrive in order, Gorilla for slowly varying floats, ZSTD at a higher level for payloads written once and read rarely, and LowCardinality(String) for enumerations, which turns string comparisons into integer comparisons.
Above the raw tables sit the serving structures. Materialized views into AggregatingMergeTree tables hold pre-aggregated states for the dashboards that run the same GROUP BY every minute, and projections give the same table a second sort order for a second class of query without a second pipeline. Skip indexes (minmax, set, bloom_filter) cover filters that the sort key does not. Each of these is validated with EXPLAIN indexes = 1 and EXPLAIN PIPELINE against the real fingerprints before it is deployed, and its benefit is recorded as read bytes before and after in system.query_log.
-- Tiered storage policy for the data fabric (config.d/storage.xml, all replicas)
<clickhouse>
  <storage_configuration>
    <disks>
      <nvme><path>/var/lib/clickhouse/</path></nvme>
      <s3_cold>
        <type>s3</type>
        <endpoint>https://${COLD_BUCKET}.s3.${AWS_REGION}.amazonaws.com/fabric/</endpoint>
        <use_environment_credentials>true</use_environment_credentials>
        <metadata_path>/var/lib/clickhouse/disks/s3_cold/</metadata_path>
      </s3_cold>
      <s3_cache>
        <type>cache</type>
        <disk>s3_cold</disk>
        <path>/var/lib/clickhouse/cache/s3_cold/</path>
        <max_size>200Gi</max_size>
      </s3_cache>
    </disks>
    <policies>
      <tiered>
        <volumes>
          <hot><disk>nvme</disk></hot>
          <cold><disk>s3_cache</disk></cold>
        </volumes>
        <move_factor>0.1</move_factor>
      </tiered>
    </policies>
  </storage_configuration>
</clickhouse>
The result is that the hot 90 days of a dataset answer from local NVMe while two years of history stay queryable from object storage through the same table, with a local cache absorbing repeated cold reads. Where a partition physically lives is visible in system.parts.disk_name, and the move itself in system.part_log, so the cost profile of the storage tier is always inspectable.
Cloud native deployment
Deployment topology: the data fabric on Kubernetes with object storage
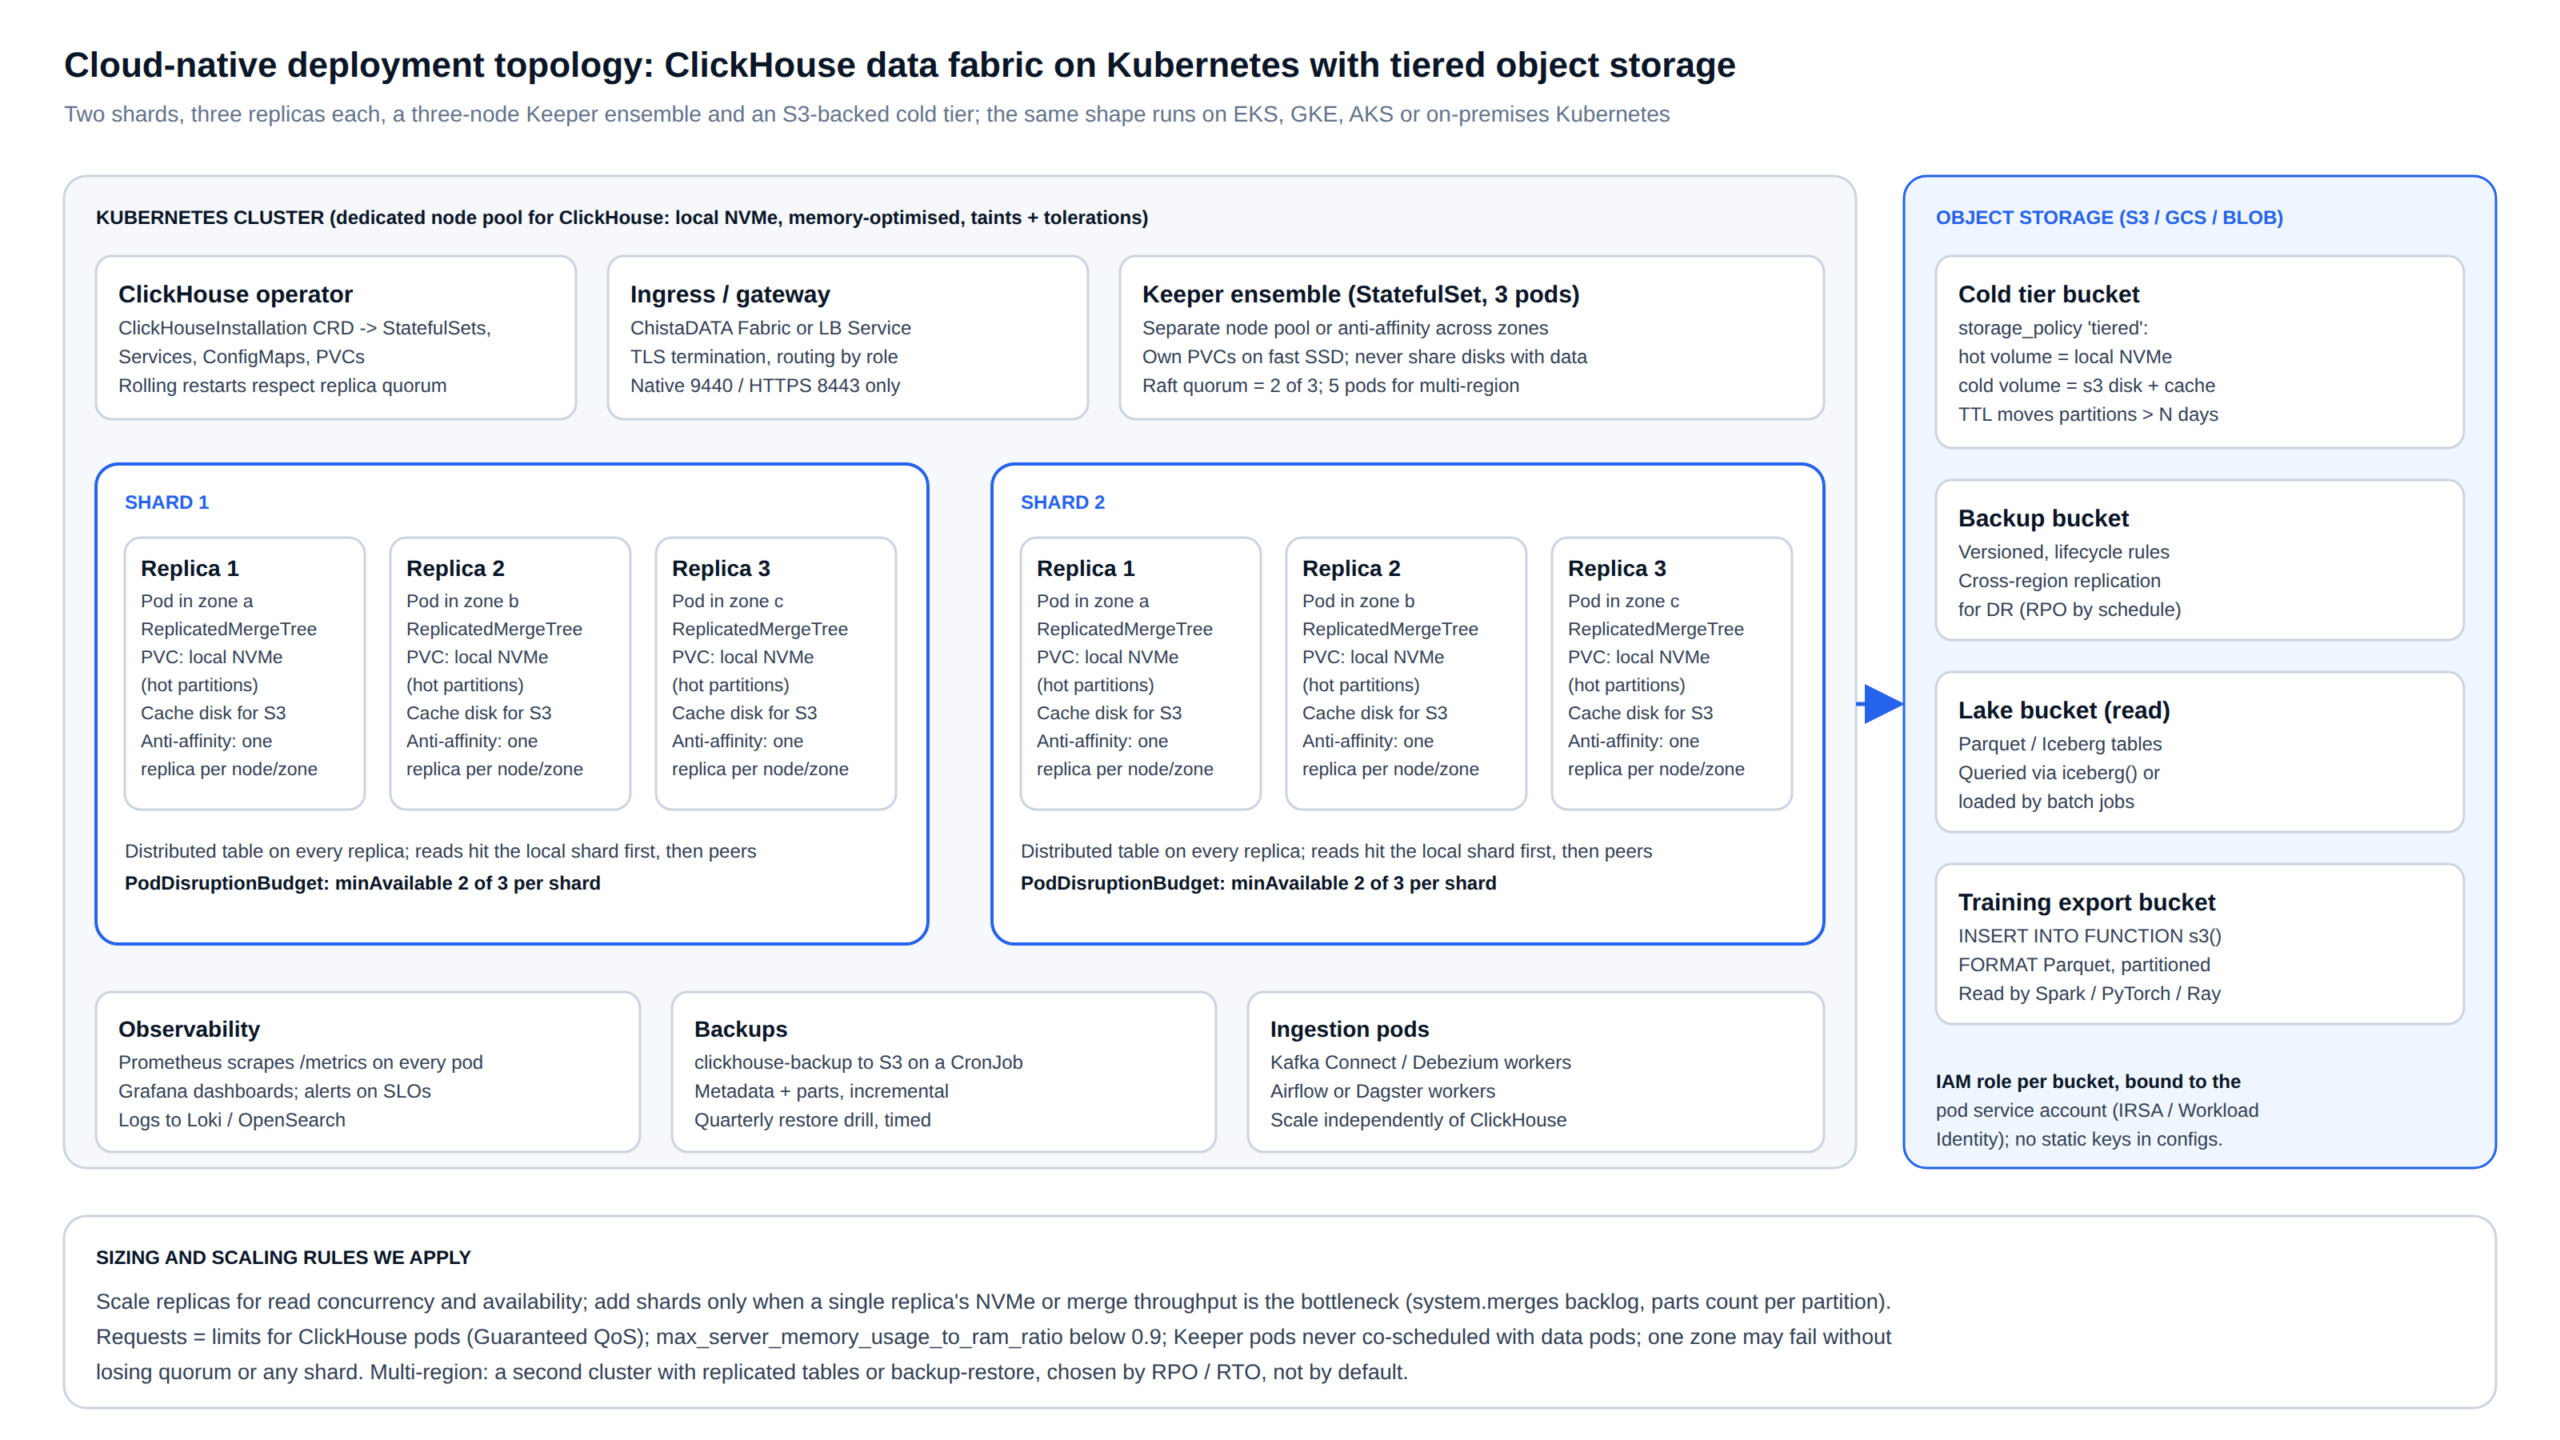
Cloud native, for a data fabric, means something specific: the ClickHouse cluster is declared as a Kubernetes custom resource and reconciled by an operator; storage is split between local NVMe for hot data and object storage for cold data and backups; and every supporting component (Keeper, Kafka Connect, orchestrator, Prometheus) runs in the same cluster with its own scaling. The topology below is the one ChistaDATA deploys on EKS, GKE, AKS and on-premises Kubernetes alike.
# ClickHouseInstallation (Altinity clickhouse-operator CRD), abbreviated
apiVersion: clickhouse.altinity.com/v1
kind: ClickHouseInstallation
metadata:
  name: fabric
  namespace: data-fabric
spec:
  configuration:
    zookeeper:
      nodes:
        - host: keeper-0.keeper.data-fabric.svc
        - host: keeper-1.keeper.data-fabric.svc
        - host: keeper-2.keeper.data-fabric.svc
    clusters:
      - name: fabric
        layout:
          shardsCount: 2
          replicasCount: 3
        templates:
          podTemplate: ch-pod
          dataVolumeClaimTemplate: ch-nvme
  templates:
    podTemplates:
      - name: ch-pod
        spec:
          affinity:
            podAntiAffinity:
              requiredDuringSchedulingIgnoredDuringExecution:
                - topologyKey: topology.kubernetes.io/zone
                  labelSelector:
                    matchLabels: { clickhouse.altinity.com/chi: fabric }
          containers:
            - name: clickhouse
              image: clickhouse/clickhouse-server:${CH_LTS_VERSION}
              resources:
                requests: { cpu: "16", memory: "64Gi" }
                limits:   { cpu: "16", memory: "64Gi" }
    volumeClaimTemplates:
      - name: ch-nvme
        spec:
          storageClassName: local-nvme
          accessModes: [ReadWriteOnce]
          resources: { requests: { storage: 2Ti } }
A few of the rules encoded there deserve explanation. Requests equal limits so that pods get Guaranteed QoS and are never evicted under node pressure; inside the container, max_server_memory_usage_to_ram_ratio is kept below 0.9 so ClickHouse leaves headroom for the page cache. Anti-affinity is required, not preferred, across zones, so a zone failure costs one replica per shard and never quorum.
Keeper runs as its own StatefulSet on separate PVCs; co-locating Keeper with data pods is the single most common cause of replication stalls we see in reviews. A PodDisruptionBudget of two of three per shard lets node upgrades proceed without a read outage. Backups run clickhouse-backup from a CronJob to a versioned bucket with cross-region replication, and the restore is drilled quarterly with a timed RTO.
Scaling follows the measurement: replicas are added for read concurrency or availability, shards only when a single replica’s NVMe or merge throughput is the bottleneck, which shows as a growing system.merges backlog or a rising parts count per partition. Ingestion workers scale separately, so a Kafka surge never competes with query CPU.
Layer 4 · Semantic and integration
The semantic layer: how consumers use the data fabric without knowing its plumbing
A consumer should be able to join events to customers, products or regions without knowing that the dimension lives in PostgreSQL. ClickHouse dictionaries do that: a dictionary is loaded from the source on a refresh interval, held in memory in a layout chosen for the key type, and used through dictGet or a dictionary join. Credentials for the source live in a named collection, so no DDL or dashboard ever contains a password.
-- Named collection holds the source credentials once (server-side)
CREATE NAMED COLLECTION crm_pg AS
    host = '${PG_HOST}', port = 5432, database = 'crm',
    user = '${PG_RO_USER}', password = '${PG_RO_PASSWORD}';

-- Dimension dictionary refreshed from PostgreSQL every 5 minutes
CREATE DICTIONARY fabric.dim_customer ON CLUSTER '{cluster}'
(
    customer_id UInt64,
    segment     String,
    country     String,
    account_manager String
)
PRIMARY KEY customer_id
SOURCE(POSTGRESQL(NAME crm_pg TABLE 'customers'))
LAYOUT(HASHED())
LIFETIME(MIN 300 MAX 360);

-- Consumers join without knowing where the dimension lives
SELECT dictGet('fabric.dim_customer', 'segment', entity_id) AS segment,
       count() AS events
FROM fabric.events
WHERE event_time >= now() - INTERVAL 1 DAY
GROUP BY segment
ORDER BY events DESC;
The catalog is the second half of the semantic layer. Every table carries its owner, contract type, freshness target, retention and PII classification, stored as table comments and in a small metadata schema that the observability layer reads. Lineage falls out of the materialized-view graph in system.tables and system.dependencies, so the question “which dashboards break if this topic changes” is a query, not an investigation.
Access is the third. Consumers reach the serving core through the native protocol, HTTP, or the MySQL and PostgreSQL wire protocols ClickHouse also serves, which is what lets Tableau, Power BI and legacy JDBC tools connect unchanged. Where several backends are involved, the ChistaDATA Fabric gateway sits in front: it terminates TLS, holds the backend credentials, applies routing rules and a SQL blacklist, and logs every statement with its route, which is also how a row-store archival tier is folded into the same data fabric.
Layer 6 · Governance
Governance and security across the data fabric
Governance in a data fabric is only real if it is enforced by the serving engine rather than by convention in each tool. ClickHouse’s role-based access control gives the platform one model that every consumer inherits: identity from LDAP or SSO mapped to roles, grants per database and table, row policies that restrict what each role can see, settings profiles that cap what each role can spend, and quotas that cap how often. The audit trail is system.query_log and system.session_log, retained and shipped to the observability store.
-- Data fabric governance: one model, enforced by the engine
CREATE ROLE fabric_analyst ON CLUSTER '{cluster}';
CREATE ROLE fabric_ml_export ON CLUSTER '{cluster}';

GRANT SELECT ON fabric.* TO fabric_analyst;
GRANT SELECT ON fabric.events, fabric.features_daily TO fabric_ml_export;

-- Tenant isolation: analysts see only their tenant's rows
CREATE ROW POLICY tenant_scope ON fabric.events
    FOR SELECT USING tenant_id = toUInt32(getSetting('SQL_tenant_id'))
    TO fabric_analyst;

-- Spend limits per role
CREATE SETTINGS PROFILE analyst_limits
    SETTINGS max_memory_usage = 20000000000,
             max_execution_time = 60,
             max_result_rows = 1000000
    TO fabric_analyst;

CREATE QUOTA analyst_quota
    FOR INTERVAL 1 HOUR MAX queries = 5000, read_rows = 50000000000
    TO fabric_analyst;

-- Column masking for direct identifiers, exposed as a view
CREATE VIEW fabric.events_masked AS
SELECT event_id, tenant_id, cityHash64(entity_id) AS entity_key,
       event_type, event_time
FROM fabric.events;
Compliance obligations map onto the same primitives. Retention is a TTL expression, so the evidence that data older than the policy is gone is a query against system.parts. Erasure requests under GDPR or DPDP are lightweight deletes scoped by entity, followed by a proof-of-deletion query that is stored with the ticket. Encryption in transit is TLS on every port, including the Keeper ports; encryption at rest is the cloud KMS on the NVMe volumes and the buckets. SOC 2 and HIPAA evidence packs are generated from the same system tables the observability layer already reads.
Artificial intelligence and machine learning
The data fabric as the feature and embedding platform for machine learning
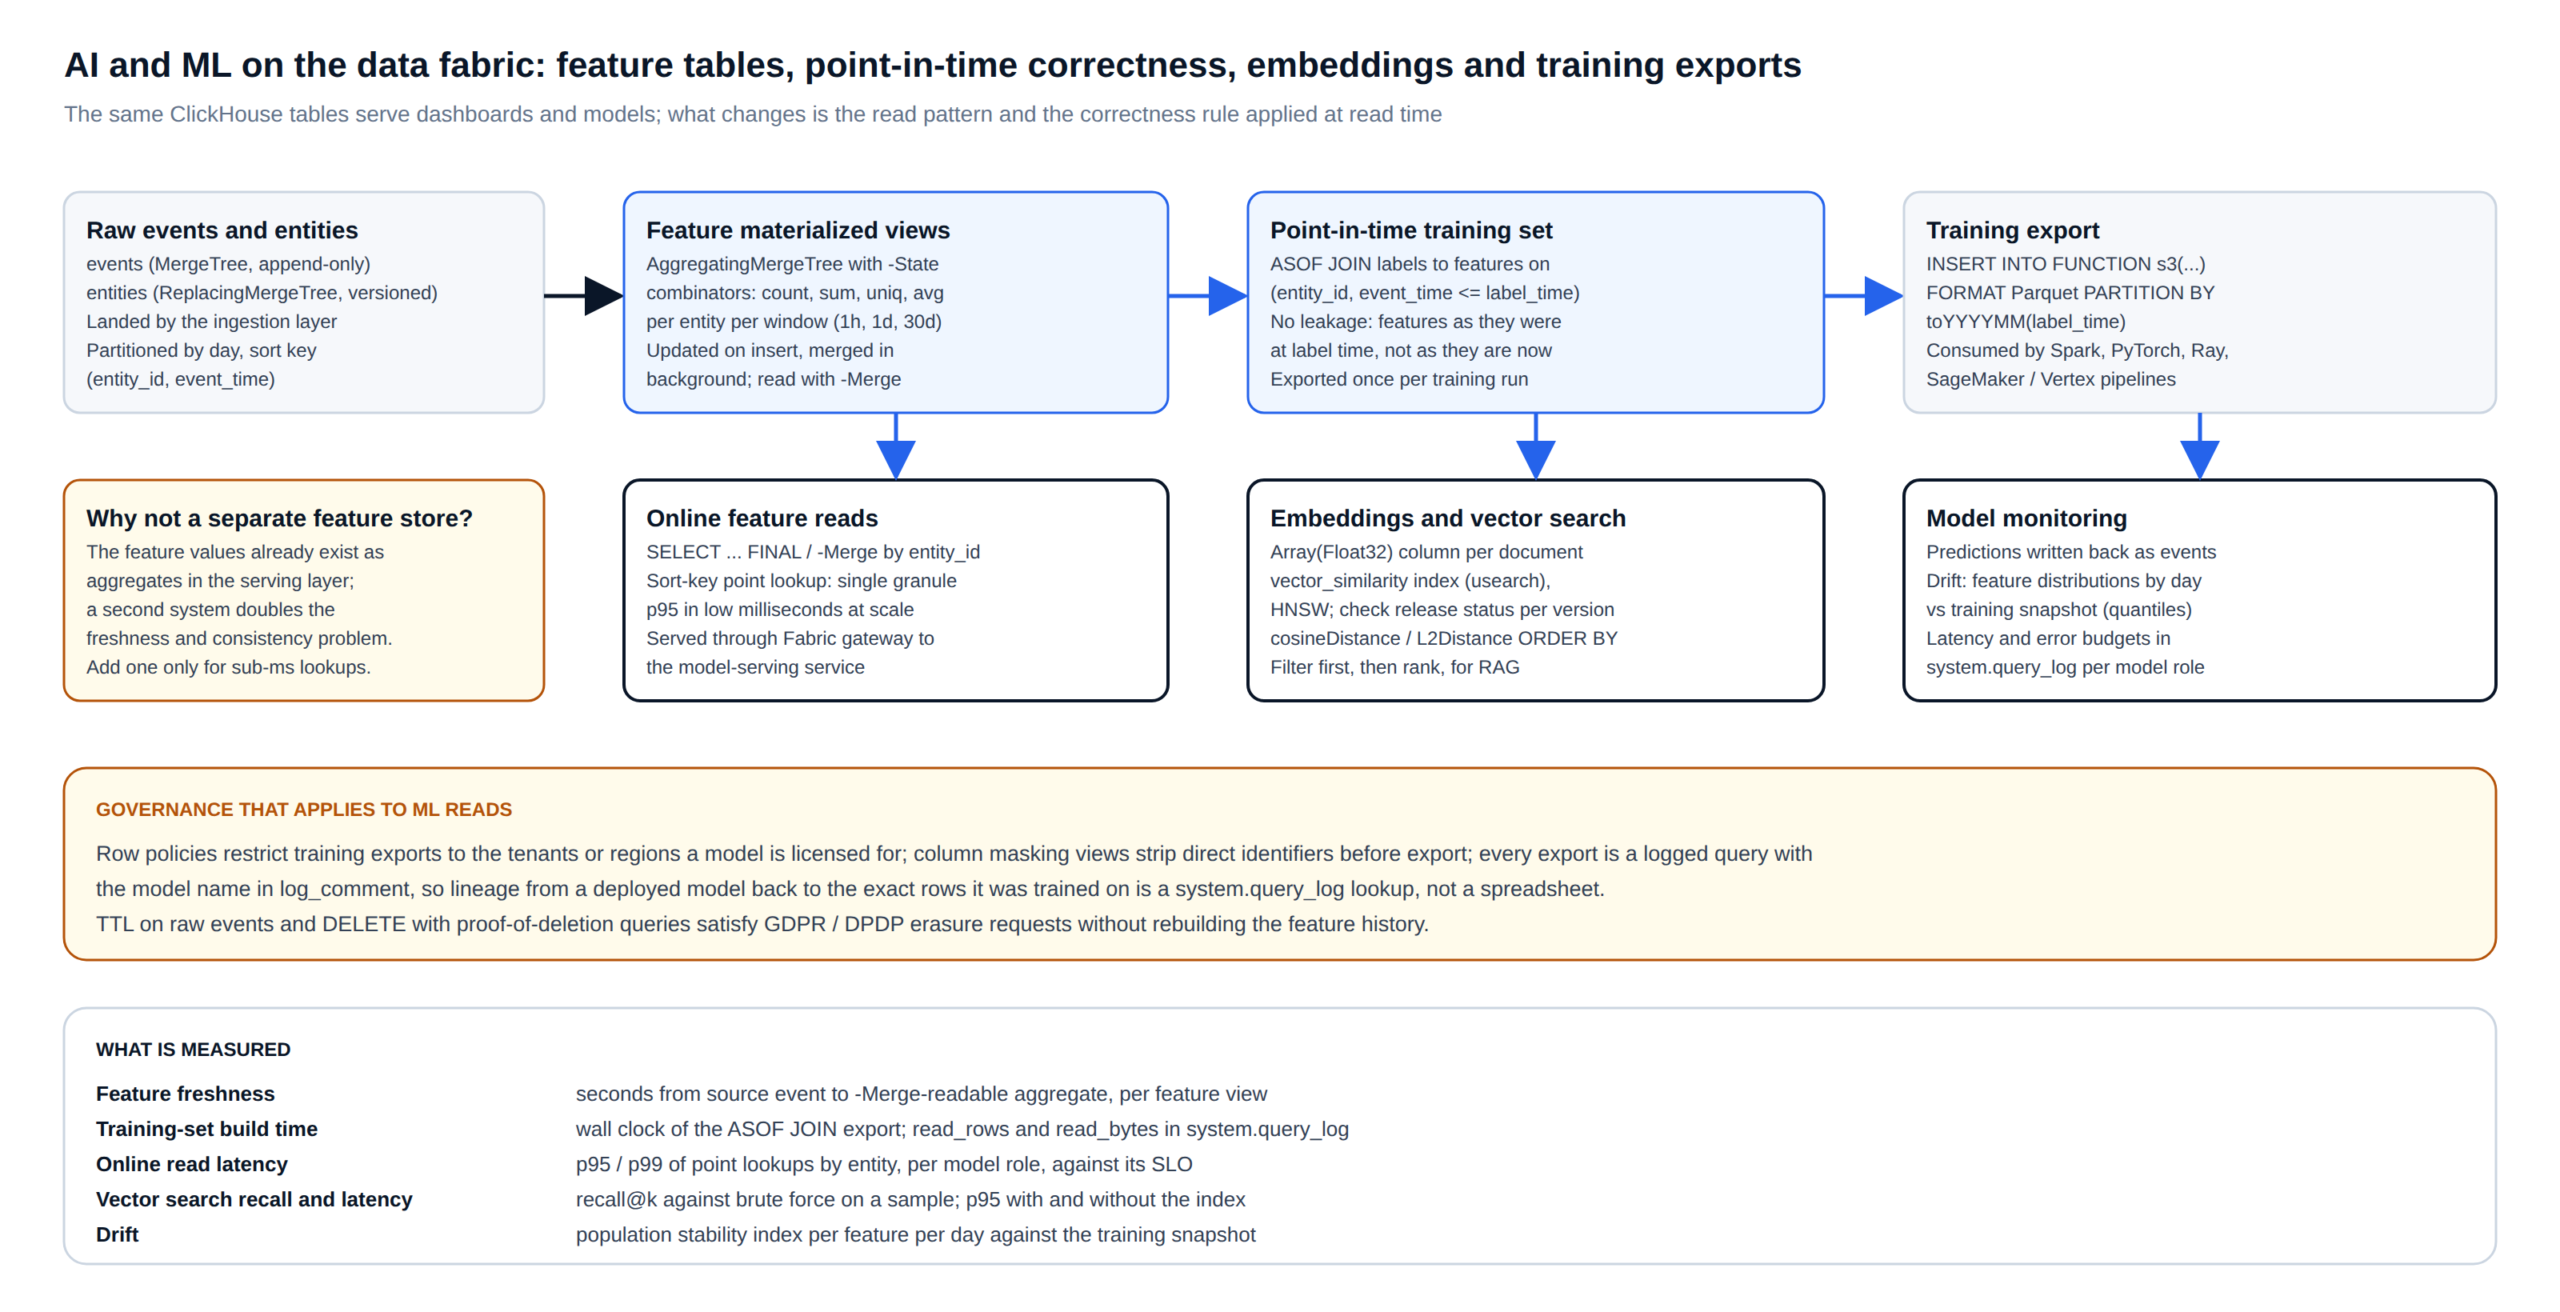
The same tables that serve dashboards serve models; what changes is the read pattern and the correctness rule. The platform provides four things machine learning teams otherwise build themselves: feature values that are fresh because they are computed by materialized views on insert, training sets that are leakage-free because they are assembled with point-in-time joins, embeddings stored next to the rows they describe with vector search over them, and exports to the formats training frameworks read.
-- Feature view: per-entity daily aggregates kept as mergeable states
CREATE TABLE fabric.features_daily ON CLUSTER '{cluster}'
(
    tenant_id   UInt32,
    entity_id   UInt64,
    day         Date,
    events      AggregateFunction(count),
    purchases   AggregateFunction(sum, Decimal(18, 2)),
    distinct_types AggregateFunction(uniq, String)
)
ENGINE = ReplicatedAggregatingMergeTree('/clickhouse/tables/{shard}/fabric/features_daily', '{replica}')
PARTITION BY toYYYYMM(day)
ORDER BY (tenant_id, entity_id, day);

CREATE MATERIALIZED VIEW fabric.features_daily_mv ON CLUSTER '{cluster}'
TO fabric.features_daily AS
SELECT tenant_id, entity_id, toDate(event_time) AS day,
       countState()                          AS events,
       sumState(toDecimal64(JSONExtractFloat(payload, 'amount'), 2)) AS purchases,
       uniqState(event_type)                 AS distinct_types
FROM fabric.events
GROUP BY tenant_id, entity_id, day;

-- Point-in-time training set: features as they were at label time
SELECT l.entity_id, l.label_time, l.label,
       countMerge(f.events) AS events_30d
FROM fabric.labels AS l
ASOF LEFT JOIN
(
    SELECT entity_id, day, events
    FROM fabric.features_daily
) AS f
ON l.entity_id = f.entity_id AND f.day <= toDate(l.label_time)
GROUP BY l.entity_id, l.label_time, l.label;

-- Export for training, partitioned, read by Spark / PyTorch / Ray
INSERT INTO FUNCTION s3('https://${ML_BUCKET}.s3.amazonaws.com/training/churn/{_partition_id}.parquet', 'Parquet')
PARTITION BY toYYYYMM(label_time)
SELECT * FROM fabric.training_churn_v7
SETTINGS log_comment = 'model=churn_v7 export';
Embeddings are stored as Array(Float32) columns alongside the rows they describe, and similarity queries order by cosineDistance or L2Distance. The vector similarity index (HNSW via usearch) accelerates those queries; it has been available behind a feature setting since the 24.x releases and its status should be confirmed for the LTS version deployed. The practical rule for retrieval-augmented generation is to filter on the sort key first (tenant, document type, date) and rank only the survivors, which keeps recall high and latency predictable. Every training export carries the model name in log_comment, so lineage from a deployed model back to the exact rows it was trained on is a lookup in system.query_log.
ChistaDATA does not deploy a separate feature store by default. The feature values already exist as aggregate states in the serving layer, and a second system doubles the freshness and consistency problem; one is added only when online reads need sub-millisecond latency that ClickHouse’s point lookups, typically low single-digit milliseconds at scale, do not meet. Model monitoring closes the loop: predictions are written back as events, and feature distributions are compared daily against the training snapshot with quantile functions to detect drift.
Observability
How the data fabric measures itself
Every layer exports its health through ClickHouse’s own system tables and the Prometheus endpoint, rendered in Grafana and alerted against SLOs with error budgets. The metrics are per dataset, because a platform that is “99.9% healthy” overall can still be serving one stale dashboard to the board. The table below lists what is measured at each layer and where the number comes from.
| Layer | What is measured | Source of truth |
|---|---|---|
| Ingestion | Freshness lag per dataset against its contract; consumer lag; dead-letter rate; partition reload success | system.kafka_consumers, connector metrics, orchestrator run logs |
| Serving core | p95 and p99 per query fingerprint; read bytes per query; parts per partition; merge backlog; replication delay; Keeper latency | system.query_log, system.parts, system.merges, system.replication_queue, Keeper 4lw commands |
| Storage | Bytes per tier per dataset; cache hit ratio; S3 request rate and cost; TTL moves completed | system.parts.disk_name, system.part_log, cloud billing export |
| Semantic | Dictionary refresh success and age; gateway route share and rejected statements | system.dictionaries, Fabric gateway query log |
| Governance | Quota consumption per role; failed authentications; policy coverage (tables without an owner or classification) | system.quota_usage, system.session_log, catalog schema |
| Machine learning | Feature freshness; training-set build time; online read latency per model; vector recall@k; drift per feature | system.query_log filtered by log_comment, drift tables |
-- Data fabric serving SLO check: p95 per fingerprint over the last hour, worst first
SELECT
    normalizedQueryHash(query)               AS fingerprint,
    count()                                  AS runs,
    quantile(0.95)(query_duration_ms)        AS p95_ms,
    formatReadableSize(avg(read_bytes))      AS avg_read,
    any(substring(query, 1, 90))             AS sample
FROM system.query_log
WHERE type = 'QueryFinish'
  AND event_time > now() - INTERVAL 1 HOUR
  AND user NOT IN ('default', 'monitoring')
GROUP BY fingerprint
HAVING runs >= 10
ORDER BY p95_ms DESC
LIMIT 20;
Industry patterns
Where a ClickHouse data fabric fits, by industry
The architecture is the same across industries; what changes is which datasets are hot, which consumers are latency-critical, and which governance rules dominate. The patterns below are reference designs, not client claims, and each is sized during the assessment against the organisation’s own volumes.
Financial services
Transaction and market events through the Kafka engine, per-entity risk features as aggregate states, row policies per legal entity, seven-year retention on the cold tier with proof-of-deletion queries, and model exports with full lineage for audit.
E-commerce and SaaS
Clickstream and order events, customer-facing embedded analytics served through the gateway with per-tenant row policies, session and funnel features refreshed on insert, and recommendation embeddings queried with filter-then-rank retrieval.
Industrial and IoT
High-rate telemetry with DoubleDelta and Gorilla codecs, daily partitions tiered to object storage, predictive-maintenance features per asset, and federation over the historian’s Parquet exports rather than a second copy.
Healthcare and life sciences
Device and clinical event streams with column-masked views for research access, HIPAA evidence from system tables, and genomic or trial datasets queried in place on Iceberg with only the derived features copied into the serving tier.
Telecom and AdTech
Billions of events a day through multiple Kafka consumers per replica, projections for the two dominant query shapes, sampling for exploratory analysis, and quota-governed self-service access for hundreds of analysts.
Public sector and GCCs
Multi-department fabrics with strict data residency: one cluster per region, dictionaries for shared reference data, cross-region reads only through explicit federation, and a single governance model audited centrally.
Delivery
How ChistaDATA delivers a data fabric
Every engagement follows the same four phases, each with an exit gate the customer signs off. The elapsed time for a first production dataset set is typically eight to twelve weeks; most of that is measurement and validation, not engineering.
| Phase | What happens | Exit gate |
|---|---|---|
| 1 · Assess | Inventory of sources, consumers and their latency needs; query fingerprints and volumes from existing systems; retention and compliance obligations; a written contract per candidate dataset | Baseline report with per-dataset freshness and latency targets, signed off |
| 2 · Design | Ingestion path per dataset; physical ClickHouse design (sort keys, partitions, codecs, TTL, projections); Kubernetes topology and storage policy; governance roles and policies; observability SLOs | DDL and CRDs reviewed against the top twenty fingerprints with EXPLAIN; DR plan with RPO and RTO stated |
| 3 · Build and validate | Cluster deployed by operator; pipelines running in parallel with existing systems; reconciliation of counts and checksums per dataset; load and failover tests; backup and timed restore | Zero reconciliation mismatches for seven days; SLOs met under production-shaped load; restore drill within RTO |
| 4 · Operate | Cutover by dataset; 24×7 consultative support with a 15-minute Severity 1 response; quarterly health checks, upgrade planning across LTS releases, and failover drills | Monthly SLO report; error budgets respected; capacity plan reviewed quarterly |
ChistaDATA provides the phases as ClickHouse consulting for assessment and design, platform engineering for the build, and either 24×7 ClickHouse support for a customer-operated data fabric or ClickHouse managed services where ChistaDATA operates it. Migrations from Redshift, Snowflake, BigQuery, Druid, Elasticsearch or a legacy warehouse into the data fabric follow the ClickHouse migration method, one dataset at a time behind the same reconciliation gates.
FAQ
Data fabric questions we hear most often
Is a data fabric the same as a data lakehouse or a data mesh?
No. A lakehouse is a storage architecture (open table formats on object storage with a query engine); a data mesh is an organisational model (domain ownership of data products). A data fabric is the integration and serving layer that either can run on. In ChistaDATA’s design the lakehouse remains the long-term store for cold data and the data fabric serves the hot, governed, sub-second layer above it.
Why ClickHouse as the serving core rather than a cloud warehouse?
Because the consumers that justify a data fabric need sub-second answers at high concurrency over event-scale data, and they need it at predictable cost in the organisation’s own account. ClickHouse delivers that on open-source software with no proprietary storage format; a cloud warehouse can be a fine batch analytics engine, but it is rarely the right online serving tier. Where a warehouse already exists, the data fabric reads from it or feeds it rather than replacing it.
Does this data fabric require ClickHouse Cloud or a vendor licence?
No. The serving core is 100% open-source ClickHouse, deployed by an open-source operator on your Kubernetes, with your object storage. ChistaDATA’s role is engineering, support and, if you choose, operations; there is no proprietary layer between you and your data and nothing that prevents you from taking the platform in-house.
How fresh is data in the data fabric?
It depends on the path chosen per dataset: seconds through the Kafka engine or Connect sink, minutes to hours through batch loads, live for federated reads. Freshness is a declared contract per dataset, measured continuously, and alerted on when it is missed; the assessment phase sets the targets from the consumers’ real needs rather than from a blanket promise.
Can the data fabric support machine learning without a separate feature store?
In most estates, yes. Feature values are computed on insert by materialized views into aggregate-state tables, training sets are assembled with point-in-time joins, and online reads are sort-key point lookups. A separate feature store is added only when a model needs sub-millisecond lookups that the serving tier’s low-millisecond latency does not meet.
What does ChistaDATA operate after go-live?
Whatever the customer chooses. With 24×7 consultative support, the customer’s team operates the data fabric and ChistaDATA responds to incidents with a 15-minute Severity 1 SLA and runs quarterly health checks and drills. With managed services, ChistaDATA operates the platform end to end: upgrades across LTS releases, capacity, backups, DR drills and SLO reporting.
Next step
Start with the assessment, not the platform
A data fabric assessment from ChistaDATA inventories your sources and consumers, measures the query fingerprints and volumes that will drive the design, and produces per-dataset freshness and latency targets you can hold the platform to. If the numbers say a ClickHouse data fabric is the right architecture, the same engineers design it, build it in your account and stay on as 24×7 support or as the operating team. Wherever your data lives, on-premises, in your VPC or across clouds, the goal is the same: one governed, measured, sub-second serving layer for analytics, artificial intelligence and machine learning.
Further reading: ClickHouse Kafka engine · ClickHouse external and tiered storage · Altinity clickhouse-operator · ClickHouse row policies