ChistaDATA · ClickHouse performance engineering · ClickHouse 26.9 · October 2026
At 10:59:40 a GROUP BY started on our lab server. At 11:01:58 it died with Code 241, memory limit exceeded, after reading 213 million rows. The query log kept a single number: 2.67 GiB. ClickHouse performance observability is about the evidence that number leaves out: how memory grew second by second, which function used the CPU, which processor sat idle, and which granules never needed to be read.
This guide is the method we use on customer clusters, run end to end on ClickHouse 26.9.2.8, the current release. It covers nine signals, each a system table or endpoint, with the SQL we run, the output it produced on a one-billion-row table, and what we concluded. Every figure is from our own lab. Every feature claim links to the ClickHouse documentation on clickhouse.com.
The idea
What ClickHouse performance observability means in 26.9
ClickHouse monitoring tells you that something is wrong: p95 is up, memory is high, a replica is behind. ClickHouse performance observability tells you why. It means you can follow one query from parse to result and point at the stage that cost the time, the memory or the I/O, without re-running it on production.
ClickHouse makes this possible because it records its own work in system tables. Every query, every thread, every processor in the pipeline, every part written or merged, and a sampled stack trace every few milliseconds can be written to MergeTree tables in the system database. You query them with the same SQL you use for your data. Nothing has to be installed, and the history survives the incident.
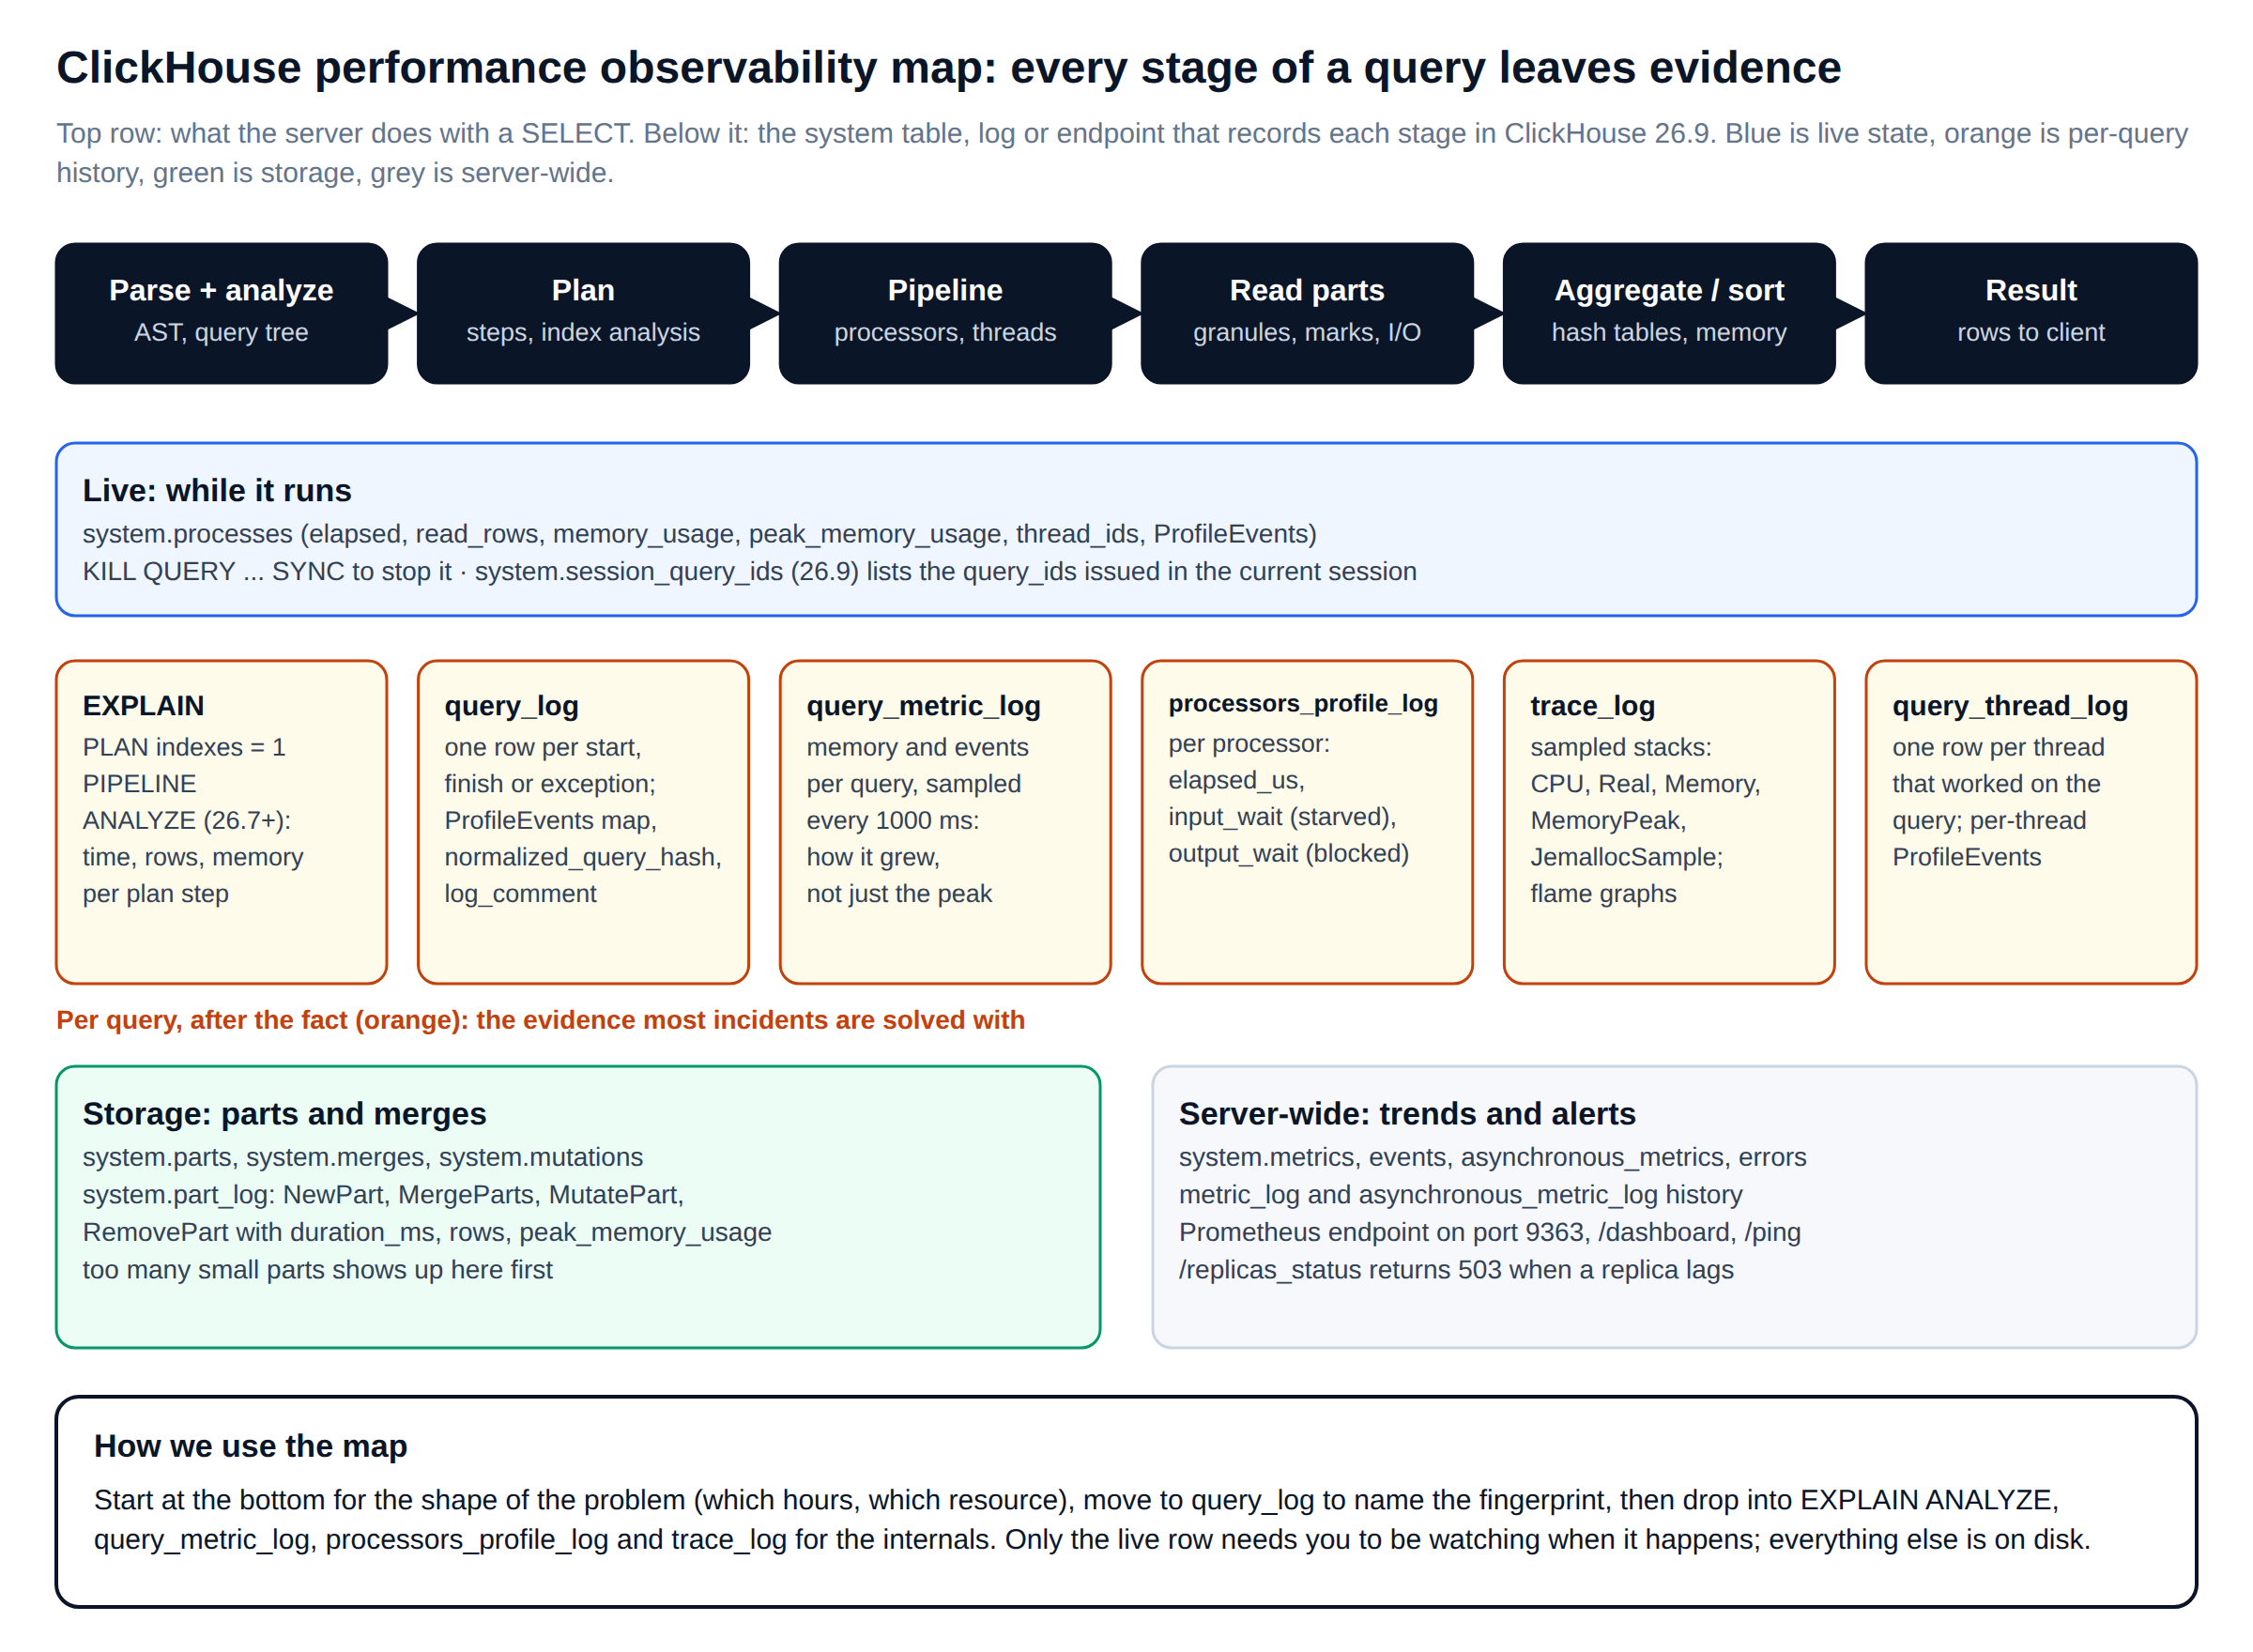
The trick is knowing which table answers which question, and in what order to open them. Figure 1 is the map we work from. The blue row is only visible while a query runs. The orange row is per-query history, where most incidents are solved. Green covers storage and grey covers the whole server.
Latest release
What changed for ClickHouse monitoring in 26.7, 26.8 and 26.9
Three releases in a row added observability features. ClickHouse 26.9 shipped on 23 September 2026 with 56 new features, 135 performance optimisations and 464 bug fixes, according to the 26.9 release post. These are the changes that matter for ClickHouse performance work.
| Release | Change | Why we care |
|---|---|---|
| 26.7 | EXPLAIN ANALYZE runs the query, discards the result and annotates the plan | Time, rows, bytes and parallelism per plan step, without parsing logs |
| 26.8 | system.user_query_log | Lets users see their own query history without access to system.query_log |
| 26.8 | Column statistics built during INSERT | The optimizer has statistics as soon as data lands |
| 26.9 | system.jemalloc_sampled_allocations | Sampled live allocations with stack, size, age and arena, to find memory that is held, not just peaks |
| 26.9 | system.session_query_ids | The query IDs issued in the current session, so you can jump straight to their log rows |
| 26.9 | interface and http_method became Enum8 in query_log, query_thread_log and processes | Cheaper to filter and store; check any tooling that compares them as integers |
| 26.9 | Faster flushing of opentelemetry_span_log, embedded SQL console at /ui | Traces show up sooner; a browser console ships with the server |
Sources are the ClickHouse changelog and the release posts for 26.8 and 26.7. Confirm your own version with SELECT version() before you use any of them. Older servers will reject the syntax rather than ignore it.
Before the incident
Turn the evidence on: the ClickHouse observability config we deploy
The default config.xml already writes query_log and several other logs. What it rarely has is retention. With no TTL, system logs grow until somebody notices the disk. We drop the file below into config.d/ on every server we look after. Each log is partitioned by day so the TTL removes whole parts instead of running a mutation.
<!-- /etc/clickhouse-server/config.d/observability.xml
     ClickHouse performance observability config, tested on ClickHouse 26.9.2.8. Requires a server restart.
     If a log's schema or engine changes, ClickHouse renames the old table
     (for example query_log_0) and creates a new one: history is kept, not lost. -->
<clickhouse>
    <!-- Per-query history: keep 30 days, one partition per day -->
    <query_log>
        <database>system</database>
        <table>query_log</table>
        <partition_by>event_date</partition_by>
        <ttl>event_date + INTERVAL 30 DAY DELETE</ttl>
        <flush_interval_milliseconds>7500</flush_interval_milliseconds>
    </query_log>

    <!-- Sampled stacks: the biggest log, 7 days covers an incident review -->
    <trace_log>
        <database>system</database>
        <table>trace_log</table>
        <partition_by>event_date</partition_by>
        <ttl>event_date + INTERVAL 7 DAY DELETE</ttl>
        <flush_interval_milliseconds>7500</flush_interval_milliseconds>
    </trace_log>

    <!-- Per-query memory and ProfileEvents over time -->
    <query_metric_log>
        <database>system</database>
        <table>query_metric_log</table>
        <partition_by>event_date</partition_by>
        <ttl>event_date + INTERVAL 14 DAY DELETE</ttl>
        <flush_interval_milliseconds>7500</flush_interval_milliseconds>
    </query_metric_log>

    <!-- Per-processor timings; filled only when log_processors_profiles = 1 -->
    <processors_profile_log>
        <database>system</database>
        <table>processors_profile_log</table>
        <partition_by>event_date</partition_by>
        <ttl>event_date + INTERVAL 7 DAY DELETE</ttl>
        <flush_interval_milliseconds>7500</flush_interval_milliseconds>
    </processors_profile_log>

    <!-- Parts written, merged, mutated and removed -->
    <part_log>
        <database>system</database>
        <table>part_log</table>
        <partition_by>event_date</partition_by>
        <ttl>event_date + INTERVAL 30 DAY DELETE</ttl>
        <flush_interval_milliseconds>7500</flush_interval_milliseconds>
    </part_log>

    <!-- One row per second of system.metrics and system.events -->
    <metric_log>
        <database>system</database>
        <table>metric_log</table>
        <collect_interval_milliseconds>1000</collect_interval_milliseconds>
        <ttl>event_date + INTERVAL 30 DAY DELETE</ttl>
        <flush_interval_milliseconds>7500</flush_interval_milliseconds>
    </metric_log>

    <!-- Prometheus scrape endpoint; 9363 is the documented default port -->
    <prometheus>
        <port>9363</port>
        <endpoint>/metrics</endpoint>
        <metrics>true</metrics>
        <asynchronous_metrics>true</asynchronous_metrics>
        <events>true</events>
        <errors>true</errors>
    </prometheus>
</clickhouse>
After the restart, check that the TTLs were applied before you trust them. On our lab server the six logs above showed their TTL; asynchronous_metric_log, query_thread_log and text_log showed none, which is the reminder to add them too.
-- ClickHouse monitoring: verify retention on every system log that has one
SELECT
    name,
    extract(engine_full, 'TTL [^S]*') AS ttl_clause
FROM system.tables
WHERE database = 'system'
  AND name LIKE '%\_log'
ORDER BY name;
Two logs are controlled by query settings, not server config. processors_profile_log stays empty unless log_processors_profiles is on, and query_thread_log needs log_query_threads. The sampling profiler is controlled by query_profiler_real_time_period_ns and query_profiler_cpu_time_period_ns. The documented default is one sample per second, as described in the sampling query profiler guide.
<!-- users.d/observability.xml: ClickHouse performance observability settings for application users -->
<clickhouse>
    <profiles>
        <default>
            <log_queries>1</log_queries>
            <!-- per-processor timings: cheap, and they separate CPU-bound from I/O-bound -->
            <log_processors_profiles>1</log_processors_profiles>
            <!-- one row per thread per query: switch on per session when needed -->
            <log_query_threads>0</log_query_threads>
            <!-- tag every query with the service that sent it -->
            <log_comment></log_comment>
        </default>
    </profiles>
</clickhouse>
Raise the profiler rate for one query, never for a whole server, when you need detail. That is what we did for the failing query in this guide: 10 ms timers, set inline, with a log_comment so every log row is easy to find later.
-- ClickHouse performance lab: the failing query, profiled at 100 samples per second per thread
SELECT
    country,
    device,
    quantileTDigest(0.99)(latency_ms) AS p99,
    uniqExact(user_id)                AS users
FROM lab.events
WHERE event_date >= '2026-05-01'
GROUP BY country, device
ORDER BY p99 DESC
LIMIT 10
SETTINGS
    query_profiler_cpu_time_period_ns  = 10000000,   -- 10 ms of CPU time
    query_profiler_real_time_period_ns = 10000000,   -- 10 ms of wall time
    log_comment = 'obs:heavy';                       -- searchable in every log
Where to start
A ClickHouse performance triage tree: symptom first
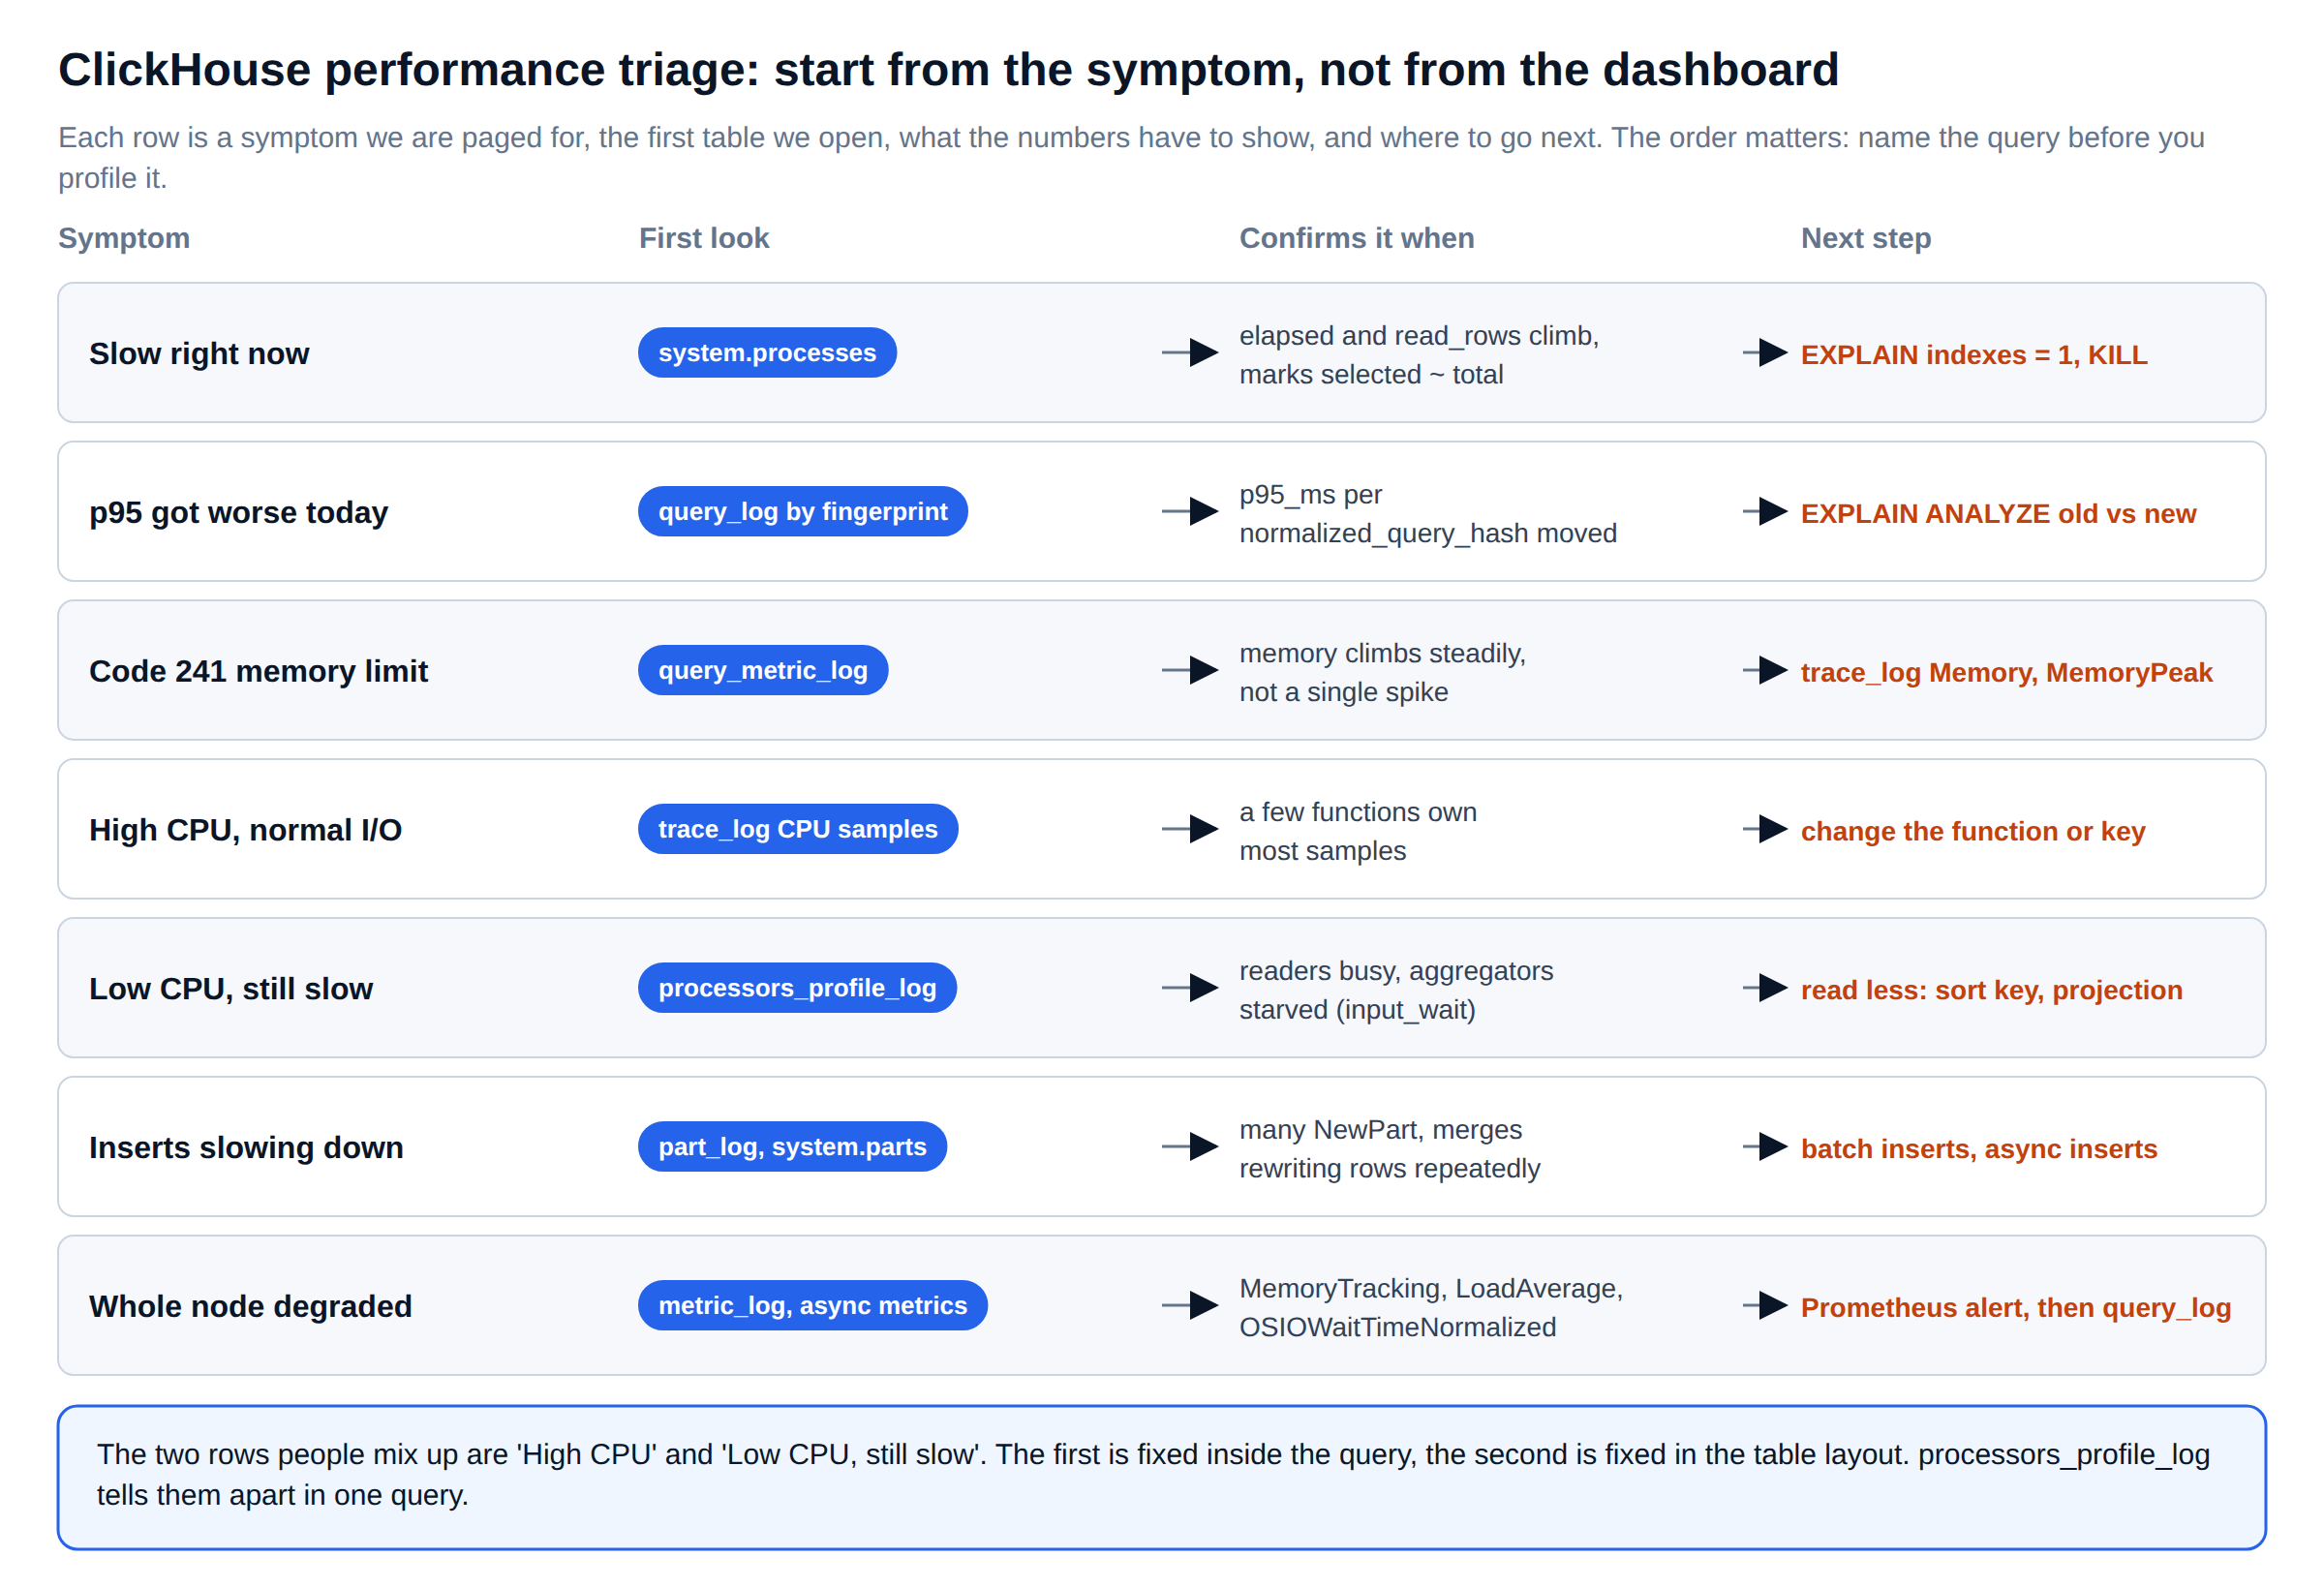
The most common mistake we see is opening a dashboard and scrolling. Dashboards show the shape of a problem; they rarely name the query. We start from the symptom and open one table, then go one level deeper. Figure 2 is the order we follow. The rest of this guide walks through each signal on the same lab table.
The ClickHouse performance lab is deliberately small so that its limits show. It is a 2 vCPU node with about 7 GiB of RAM and a server memory limit of 2.99 GiB, running ClickHouse 26.9.2.8. The table lab.events holds one billion rows, ordered by (tenant_id, event_time) and partitioned by month, with 20,146 granules in each monthly partition.
Signal 1 · live
system.processes: ClickHouse performance while the query is still running
When a page arrives for a query that is slow right now, system.processes is the only table with an answer. It holds one row per running query, with elapsed time, rows and bytes read so far, current and peak memory, the thread IDs working on it and a live ProfileEvents map. The columns are listed in the system.processes reference.
-- ClickHouse performance, live: running queries, longest first, with the counters that explain them
SELECT
    query_id,
    user,
    round(elapsed, 2)                                    AS elapsed_s,
    formatReadableQuantity(read_rows)                    AS rows_read,
    formatReadableSize(read_bytes)                       AS bytes_read,
    formatReadableSize(memory_usage)                     AS mem_now,
    formatReadableSize(peak_memory_usage)                AS mem_peak,
    length(thread_ids)                                   AS threads,
    ProfileEvents['SelectedMarks']                       AS marks_selected,  -- granules planned
    round(ProfileEvents['OSCPUVirtualTimeMicroseconds'] / 1e6, 2) AS cpu_s,
    is_cancelled,
    substring(query, 1, 50)                              AS query_head
FROM system.processes
WHERE is_initial_query                       -- skip shard sub-queries on clusters
  AND query NOT LIKE '%system.processes%'    -- skip this query itself
ORDER BY elapsed DESC
FORMAT Vertical;
Four seconds into a full-table GROUP BY on our lab node it printed this:
query_id:       obs_live_3
elapsed_s:      4.05
rows_read:      4.85 million
bytes_read:     37.00 MiB
mem_now:        63.37 MiB
mem_peak:       69.26 MiB
threads:        28
marks_selected: 122071
cpu_s:          0.93
The number we read first is marks_selected. It is fixed once planning ends, and 122,071 is every granule in the table. Index analysis skipped nothing, so this query will read the whole table whatever else happens. Rows read divided by elapsed time gives the scan rate, and from that you can estimate how long the query will run.
If it has to stop, KILL QUERY with SYNC waits until the query has actually stopped and released its memory. Always check the target first, because the WHERE clause can match more than one query.
-- 1. Verify the target: exactly one row expected
SELECT query_id, user, elapsed, substring(query, 1, 80)
FROM system.processes
WHERE query_id = 'obs_live_3';

-- 2. Cancel and wait for the threads to finish
KILL QUERY WHERE query_id = 'obs_live_3' SYNC;
-- returned: kill_status = finished

-- 3. Validate: the row is gone and the cancellation was counted
SELECT count() FROM system.processes WHERE query_id = 'obs_live_3';      -- 0
SELECT value FROM system.errors WHERE name = 'QUERY_WAS_CANCELLED';
Signal 2 · history
system.query_log: name the query fingerprint behind the ClickHouse performance problem
system.query_log holds a row when a query starts and another when it finishes or fails. The type is one of QueryStart, QueryFinish, ExceptionBeforeStart or ExceptionWhileProcessing. Each finished row carries the full ProfileEvents map, the settings that were changed, and normalized_query_hash, which is the same for queries that differ only in literals. The query_log reference lists every column.
Grouping by that hash turns thousands of rows into a short list of query shapes, which is where ClickHouse performance work should start. This is the first query we run on any ClickHouse performance engagement:
-- ClickHouse performance by fingerprint: top query shapes by CPU, last 7 days, failures included
SELECT
    normalized_query_hash                                               AS fingerprint,
    count()                                                             AS executions,
    countIf(type = 'ExceptionWhileProcessing')                          AS failures,
    round(quantile(0.95)(query_duration_ms))                            AS p95_ms,
    round(sum(ProfileEvents['OSCPUVirtualTimeMicroseconds']) / 1e6, 1)  AS cpu_s,
    round(sum(ProfileEvents['DiskReadElapsedMicroseconds']) / 1e6, 1)   AS disk_wait_s,
    sum(ProfileEvents['SelectedMarks'])                                 AS marks,
    formatReadableSize(max(memory_usage))                               AS peak_mem,
    substring(any(query), 1, 60)                                        AS example
FROM system.query_log
WHERE event_date >= today() - 7
  AND type IN ('QueryFinish', 'ExceptionWhileProcessing')   -- failed queries cost CPU too
  AND query_kind = 'Select'
GROUP BY fingerprint
ORDER BY cpu_s DESC
LIMIT 20;
The top two rows on our lab server were the failing query and its rewrite:
| Fingerprint | Failures | Duration | CPU | Disk wait | Marks | Peak memory |
|---|---|---|---|---|---|---|
| uniqExact version | 1 | 137,677 ms | 50.3 s | 212.3 s | 41,071 | 2.67 GiB |
| uniq version | 0 | 85,053 ms | 42.5 s | 116.1 s | 41,071 | 175.85 MiB |
Two things stand out. Disk wait is larger than CPU time, which is possible because it is summed across reading threads. And the failed query counted 50 CPU-seconds even though it returned nothing. A filter on QueryFinish alone would have hidden the most expensive query on the server. Include exceptions in every ranking.
For the error itself, system.errors keeps a counter per error code with the last message and time. It answers “is this new?” without searching logs. Ours showed MEMORY_LIMIT_EXCEEDED, code 241, three times, last at 11:01:58.
Signal 3 · the plan
EXPLAIN ANALYZE: see where ClickHouse performance went, step by step
Since 26.7, EXPLAIN ANALYZE runs the query, throws the result away and prints the plan with what actually happened at each step: rows and bytes in and out, time and its share of the total, and average and maximum parallelism. The EXPLAIN reference describes every variant. Because it really executes, run it on a replica that is not serving production traffic.
We used it on a smaller query: the error rate for one user over one month. We turned off the query condition cache so that a repeat run could not reuse the filter results of an earlier one.
-- ClickHouse performance before: user_id is not in the sort key (tenant_id, event_time)
EXPLAIN ANALYZE
SELECT countIf(http_status >= 500) / count() AS error_rate
FROM lab.events
WHERE user_id = 4218139
  AND event_date >= '2026-06-01'
SETTINGS use_query_condition_cache = 0;   -- measure the scan, not the cache
Query summary:
Time: 360.77 ms (planning 3.45 ms · execution 357.32 ms)
Read: 165.03 million rows, 660.27 MB (461.86 million rows/s., 1.85 GB/s.)
Peak memory: 78.06 KiB
...
└──ReadFromMergeTree (lab.events)
Parts: 1 | Granules: 20146
Prewhere filter column: event_date >= '2026-06-01' AND user_id = 4218139
Indexes:
Min-Max Granules: 20146/122071
Partition Granules: 20146/20146
PrimaryKey
Condition: true
Granules: 20146/20146
I/O: rows 0 → 13 · 0 B → 26 B
time 356.32 ms (99.7%) · parallelism 1.98/2The plan explains the problem completely. The partition and min-max indexes kept one month, then the primary key line reads Condition: true. It had nothing to work with and kept all 20,146 granules. ReadFromMergeTree took 99.7% of the time, with both cores busy. In the application, every user belongs to a tenant, and the tenant is the first column of the sort key.
-- ClickHouse performance after: the leading sort-key column lets the primary index skip
EXPLAIN ANALYZE
SELECT countIf(http_status >= 500) / count() AS error_rate
FROM lab.events
WHERE tenant_id = 42                 -- known to the application
  AND user_id = 4218139
  AND event_date >= '2026-06-01'
SETTINGS use_query_condition_cache = 0;
Query summary:
Time: 6.13 ms (planning 2.63 ms · execution 3.50 ms)
Read: 344.06 thousand rows, 1.60 MB (98.24 million rows/s., 455.99 MB/s.)
Peak memory: 54.38 KiB
...
PrimaryKey
Keys:
tenant_id
Condition: (tenant_id in [42, 42])
Granules: 42/20146
Search Algorithm: binary search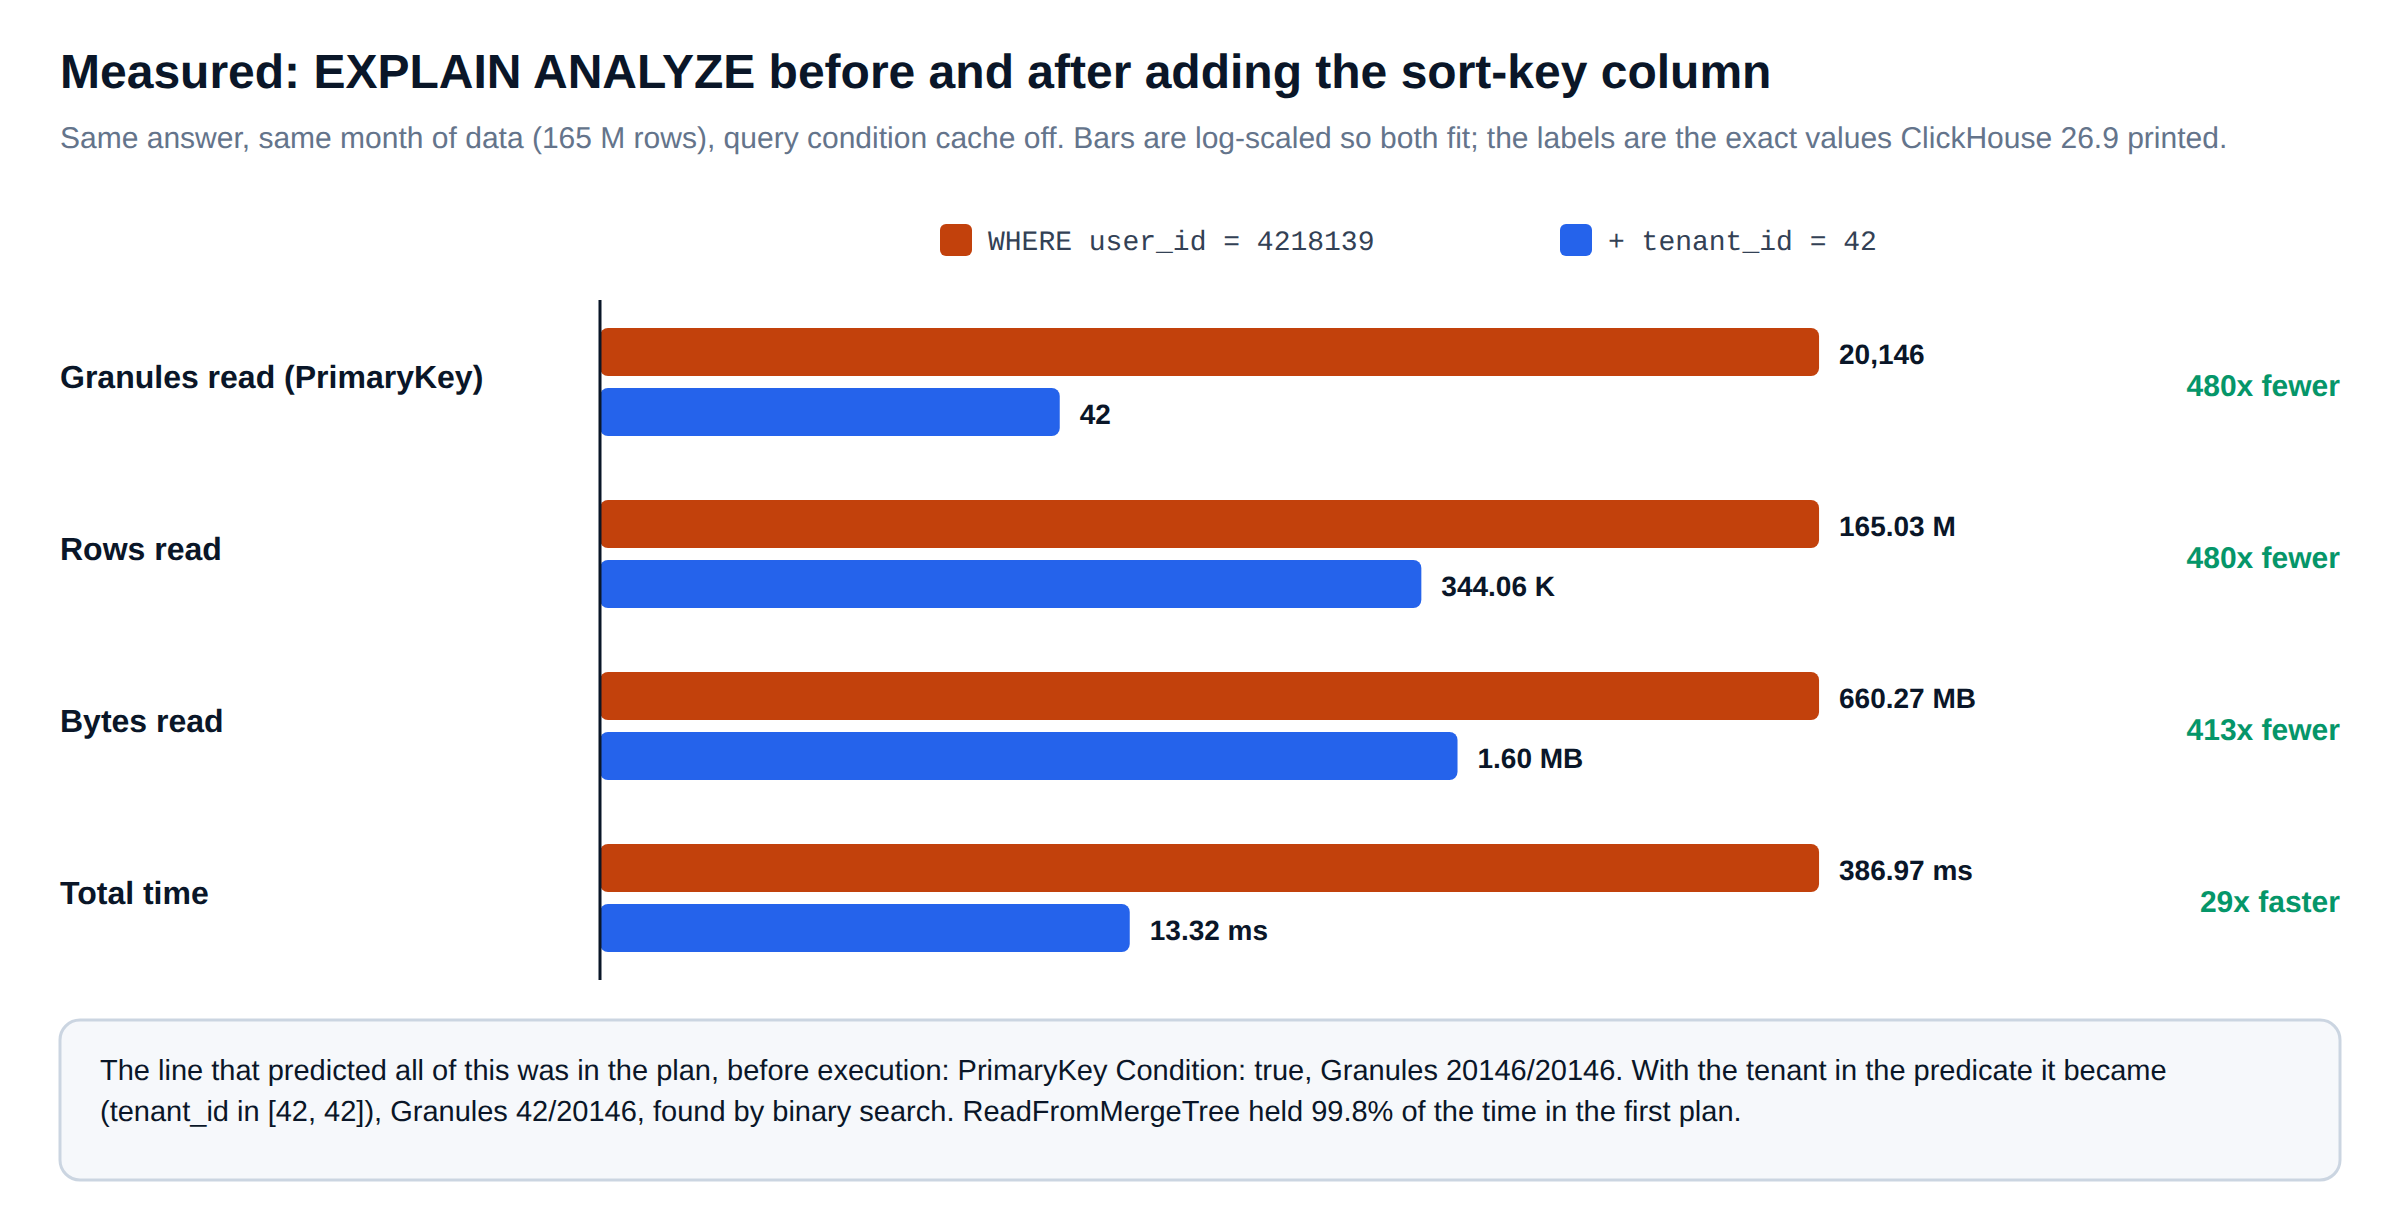
The figure shows our first run, at 386.97 ms against 13.32 ms. The second run, printed above, gave 360.77 ms against 6.13 ms. Timings move with cache state and noise from other processes. Granule counts do not. That is why we compare plans by granules and rows, and treat milliseconds as supporting evidence.
You do not need to execute anything to see the index line. EXPLAIN indexes = 1 prints the same Min-Max, Partition and PrimaryKey sections from planning alone. It is safe on a busy primary and should be the first thing you check when marks_selected in system.processes looks too high.
Signal 4 · memory over time
system.query_metric_log: how ClickHouse query memory grew, second by second
query_log tells you the peak. system.query_metric_log tells you how the query got there. It samples memory and every ProfileEvent for each running query at query_metric_log_interval, which is 1000 ms by default, according to the query_metric_log reference. The failing query left 138 samples.
-- ClickHouse performance observability: memory growth of one query, in 15-second buckets
SELECT
    toStartOfInterval(event_time, INTERVAL 15 SECOND)                AS bucket,
    formatReadableSize(max(memory_usage))                             AS mem,
    formatReadableSize(max(peak_memory_usage))                        AS peak,
    sum(ProfileEvent_SelectedRows)                                    AS rows_in_bucket,
    round(sum(ProfileEvent_OSCPUVirtualTimeMicroseconds) / 1e6, 1)    AS cpu_s
FROM system.query_metric_log
WHERE query_id = 'obs_heavy_1'
  AND event_date = today()
GROUP BY bucket
ORDER BY bucket;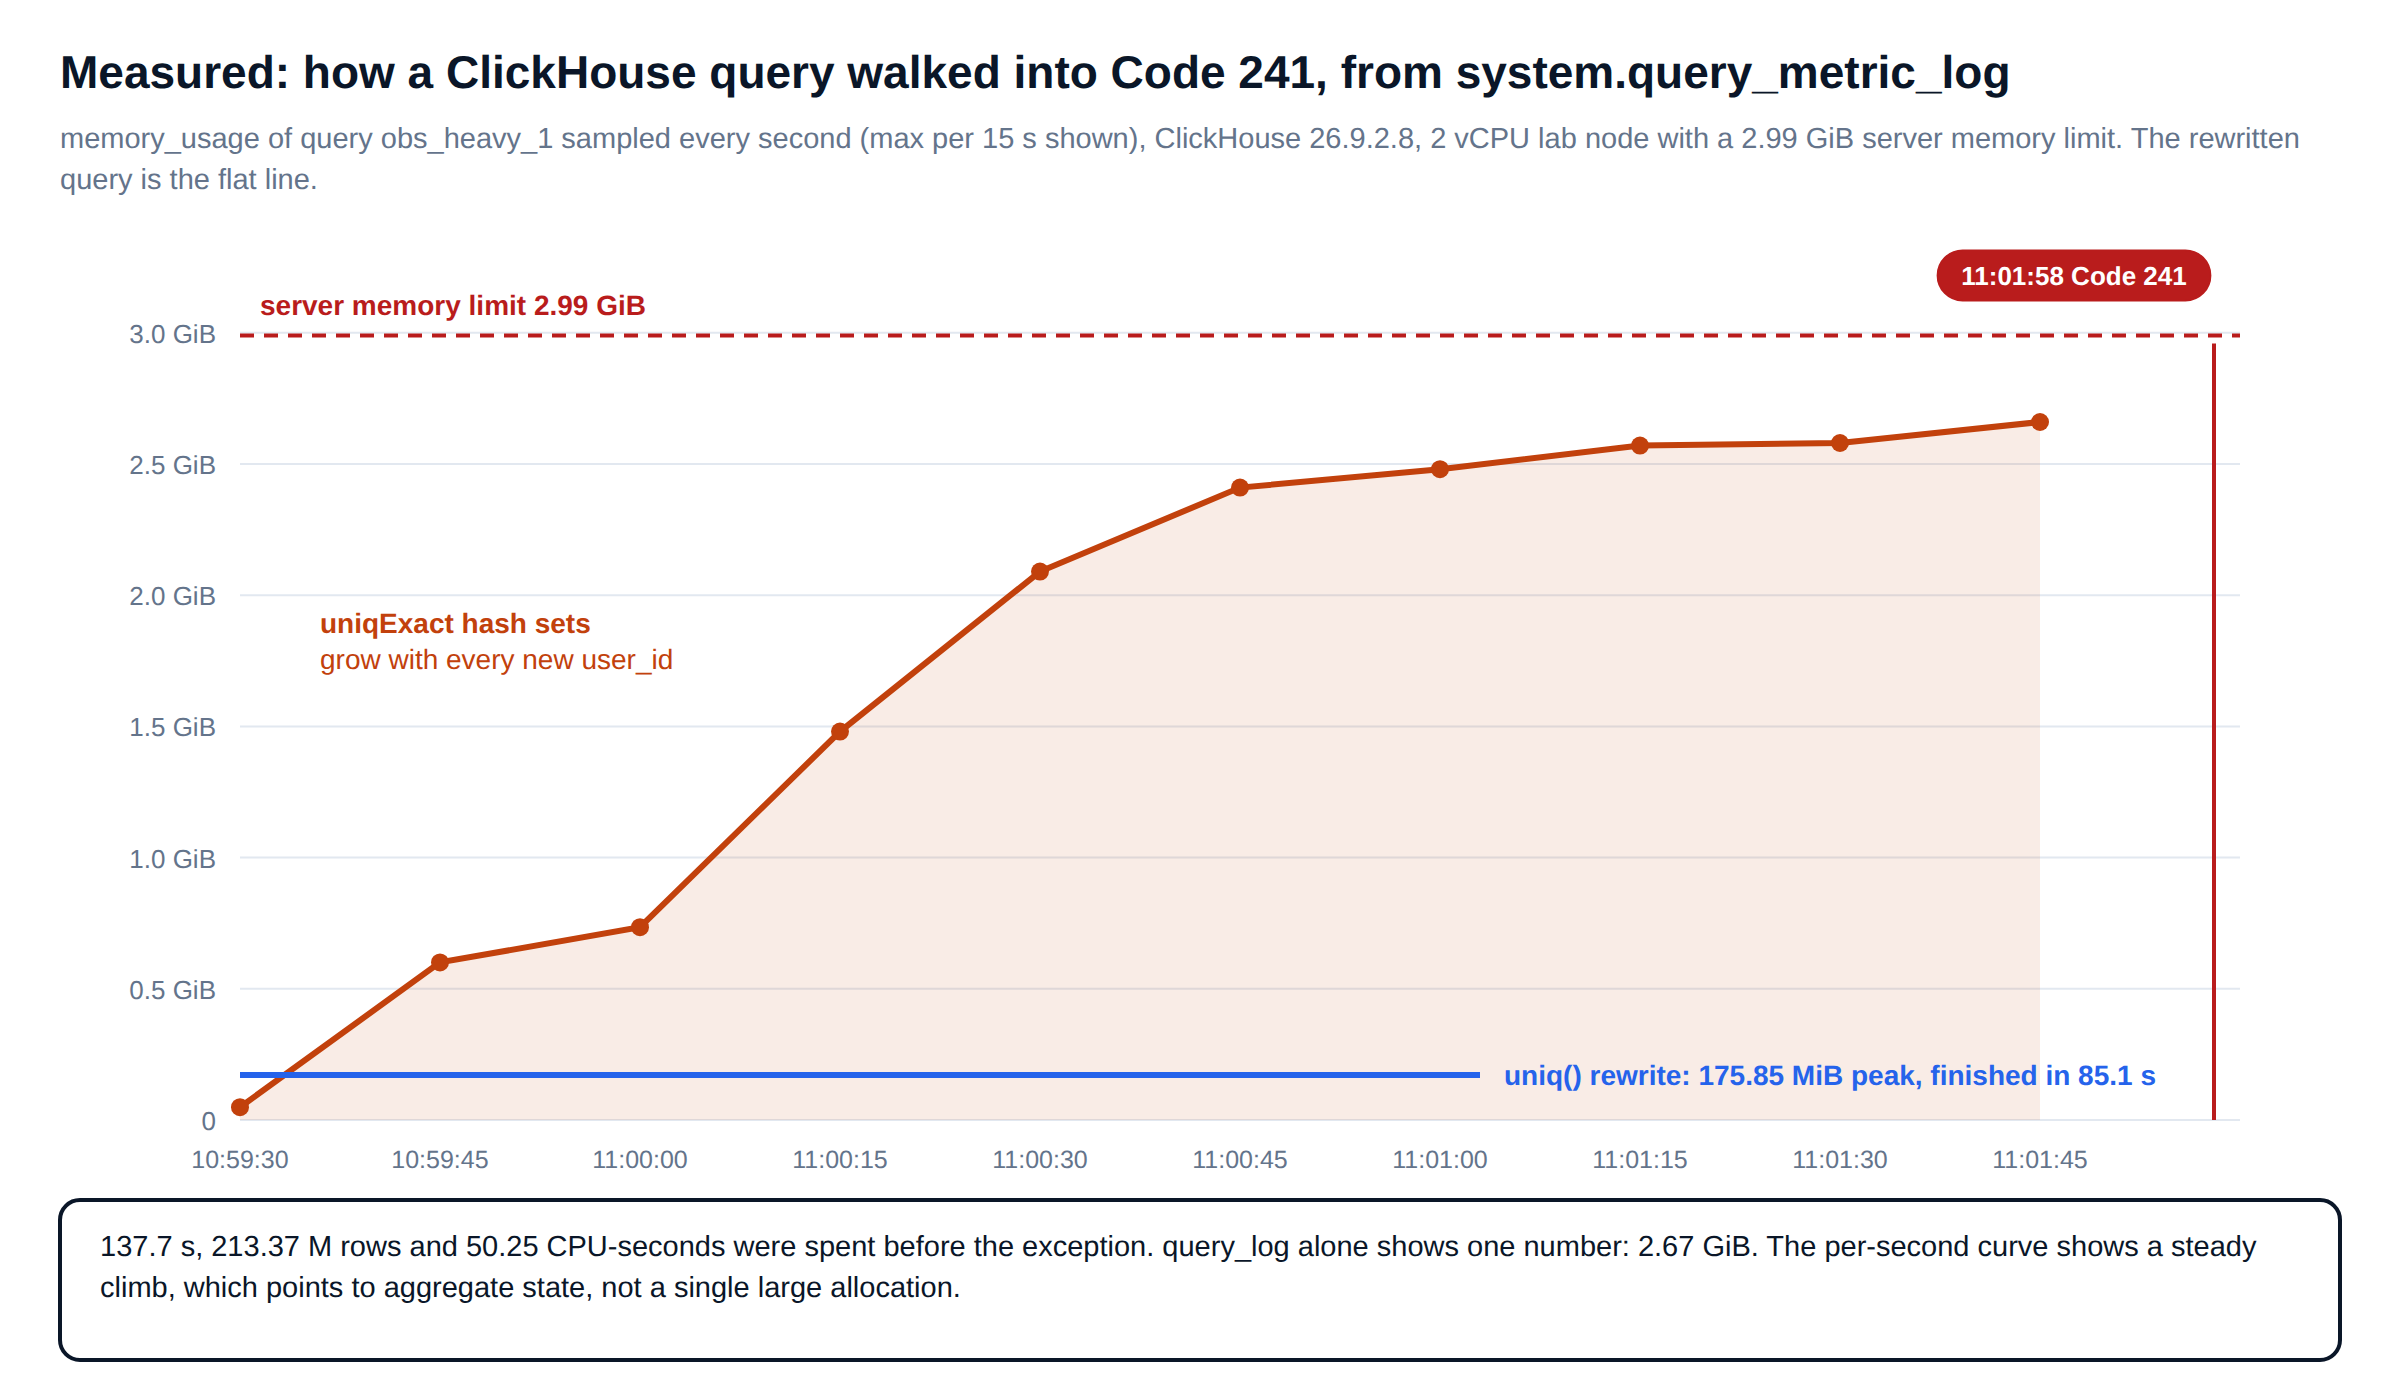
The rows read per bucket stayed flat at 20 to 26 million while memory kept rising. That pattern means memory grew with the data, not with time. If it had been a sort or a join building its right side, we would expect a jump at one point. A steady climb under a steady input rate points to aggregate state, so the next question was which aggregate. That needs stack traces.
Signal 5 · internals
system.trace_log: which ClickHouse function used the CPU and the memory
The sampling profiler writes a stack trace to system.trace_log on every timer tick, for every thread of the query. Each row has a trace_type: Real for wall-clock samples, CPU for on-CPU samples, Memory for allocations crossing memory_profiler_step, MemoryPeak for new peaks, and JemallocSample for the jemalloc profiler. The trace_log reference lists all of them.
At 10 ms the failing query produced 55,529 Real, 4,803 CPU, 680 Memory and 678 MemoryPeak samples. The addresses are turned into names by the introspection functions, which need allow_introspection_functions. Grant that to the people who run incident reviews, not to application users.
-- ClickHouse performance observability: share of on-CPU samples by leaf function
SELECT
    substring(demangle(addressToSymbol(trace[1])), 1, 80)  AS leaf_function,  -- trace[1] = innermost frame
    count()                                                AS samples,
    round(100 * samples / sum(samples) OVER (), 1)         AS pct
FROM system.trace_log
WHERE query_id = 'obs_heavy_1'
  AND trace_type = 'CPU'
  AND event_date = today()
GROUP BY leaf_function
ORDER BY samples DESC
LIMIT 8
SETTINGS allow_introspection_functions = 1;
36.4% of CPU samples landed in a single function: the batch insert of AggregateFunctionUniq over AggregateFunctionUniqExactData, which is uniqExact adding user IDs to its hash sets. The t-digest for the p99 came next with radix sort and compress at 8.5% and 6.6%. After that came key serialisation for the two-level hash table that groups by two string columns.
CPU tells you what was busy. For a memory failure, you need to know who allocated. Memory samples record the stack at allocation time, but the top frames always belong to the allocator. This query skips those frames and credits each sample to the first frame from the engine itself:
-- ClickHouse performance observability: credit each Memory sample to the first non-allocator frame
WITH arrayMap(x -> demangle(addressToSymbol(x)), trace) AS frames
SELECT
    substring(arrayFirst(f -> f NOT ILIKE '%MemoryTracker%'
                          AND f NOT ILIKE '%Allocator%'
                          AND f NOT ILIKE '%operator new%'
                          AND f NOT ILIKE '%PODArray%'
                          AND f != '', frames), 1, 70)   AS first_engine_frame,
    count()                                             AS allocations,
    formatReadableSize(sum(size))                       AS bytes
FROM system.trace_log
WHERE query_id = 'obs_heavy_1'
  AND trace_type = 'Memory'
  AND size > 0                    -- allocations only; frees are negative
  AND event_date = today()
GROUP BY first_engine_frame
ORDER BY sum(size) DESC
LIMIT 5
SETTINGS allow_introspection_functions = 1;
first_engine_frame allocations bytes
DB::IAggregateFunctionHelper<DB::AggregateFunctionUniq<... 490 1.73 GiB
DB::AggregatingTransform::work() 188 680.31 MiB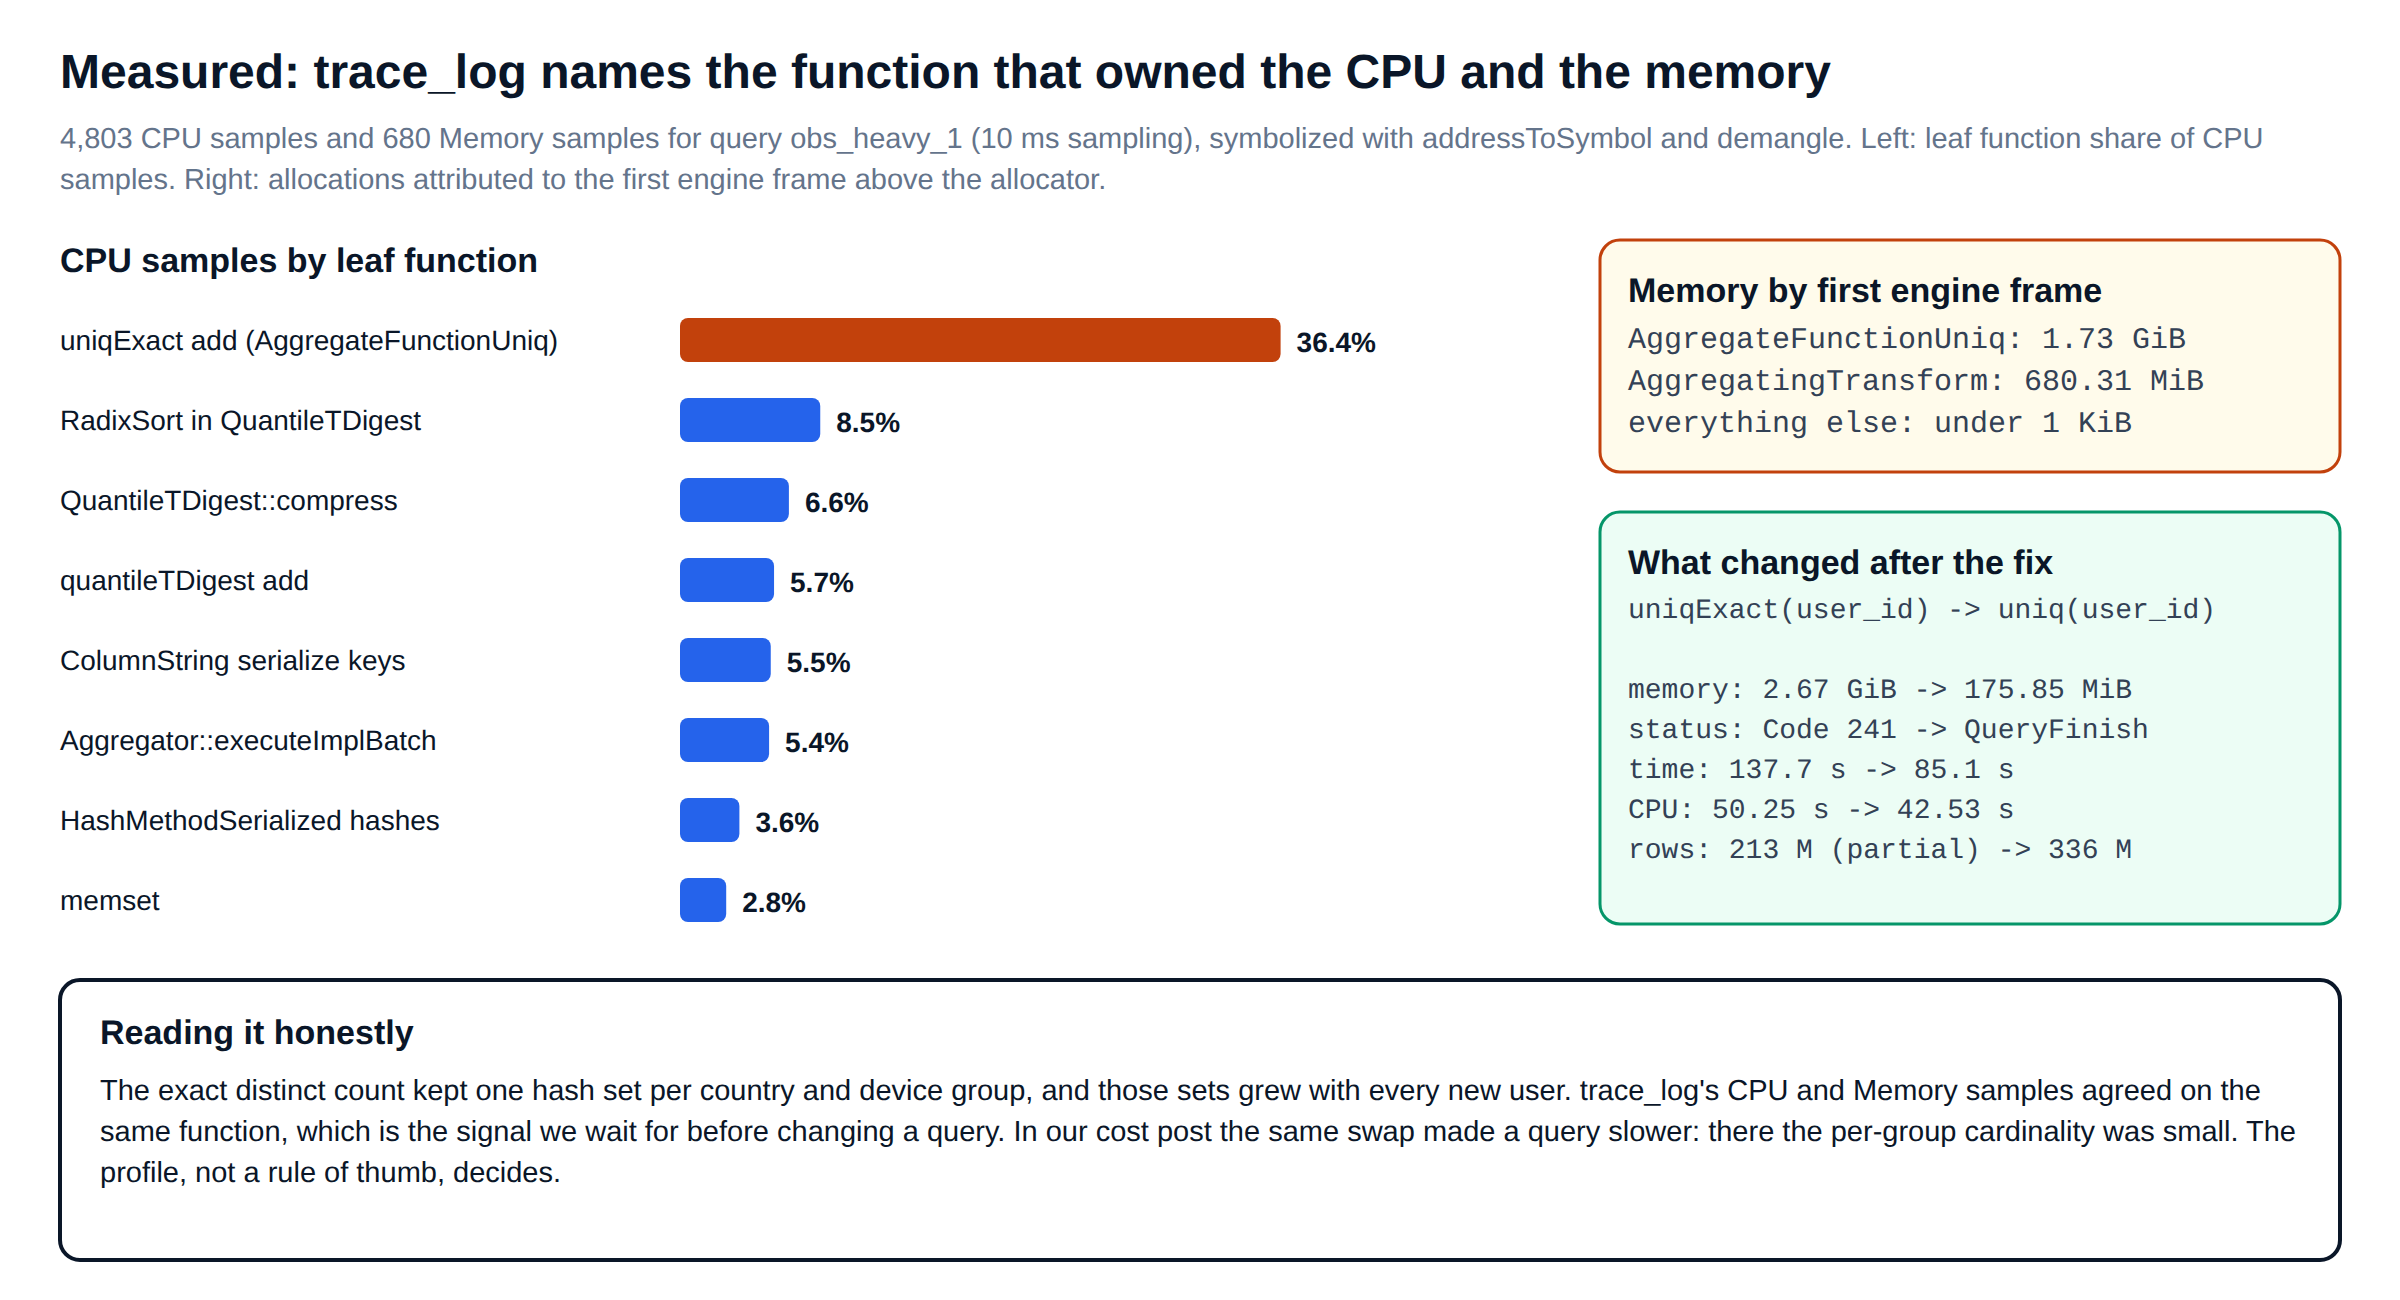
CPU and memory pointed at the same function, so we changed it. uniqExact keeps every distinct value in a hash set per group. uniq keeps an adaptive sample with a bounded size. Its result is approximate, so this is a product decision as well as an engineering one. The dashboard showed user counts rounded to thousands, so approximate was acceptable. With the change, the query finished in 85.1 seconds and peaked at 175.85 MiB instead of failing at 2.67 GiB.
For a visual, fold whole stacks into the collapsed format that flame graph renderers read, one line per unique stack with a sample count:
-- ClickHouse performance flame graph: collapsed stacks, root first, frames joined by ';'
SELECT
    arrayStringConcat(
        arrayReverse(arrayMap(x -> demangle(addressToSymbol(x)), trace)),
        ';')                                   AS stack,
    count()                                    AS samples
FROM system.trace_log
WHERE query_id = 'obs_heavy_1'
  AND trace_type = 'CPU'
  AND event_date = today()
GROUP BY trace
ORDER BY samples DESC
SETTINGS allow_introspection_functions = 1
INTO OUTFILE 'obs_heavy_1.folded' FORMAT TSV;   -- clickhouse-client writes it locally
For the failing query this wrote 899 unique stacks covering all 4,803 CPU samples. Any renderer that reads the collapsed-stack format turns that file into an interactive flame graph. The widest tower in ours was the uniqExact path described above.
Signal 6 · the pipeline
system.processors_profile_log: is the query CPU-bound or starved for data?
The fixed query still took 85 seconds, and trace_log alone could not explain that ClickHouse performance. A ClickHouse query runs as a pipeline of processors. EXPLAIN PIPELINE shows that pipeline before execution. On our 2 vCPU node it had two readers, two aggregators and a merge-sort at the end:
-- ClickHouse performance: the processor graph, before execution
EXPLAIN PIPELINE
SELECT country, device, quantileTDigest(0.99)(latency_ms) AS p99, uniq(user_id) AS users
FROM lab.events
WHERE event_date >= '2026-05-01'
GROUP BY country, device
ORDER BY p99 DESC
LIMIT 10;

-- (Aggregating)
-- Resize 2 → 2
--   AggregatingTransform × 2
--     ...
--       (ReadFromMergeTree)
--       MergeTreeSelect(pool: ReadPool, algorithm: Thread) × 2 0 → 1
system.processors_profile_log records what each processor did during the run. For each one it stores time spent working, time waiting for input (starved), and time waiting for the next processor to take its output (blocked). Comparing those three numbers separates a slow computation from a slow source.
-- ClickHouse performance observability: busy, starved and blocked time per processor type
SELECT
    name                                           AS processor,
    count()                                        AS instances,
    round(sum(elapsed_us) / 1e6, 2)                AS busy_s,
    round(sum(input_wait_elapsed_us) / 1e6, 2)     AS starved_s,   -- waiting for upstream
    round(sum(output_wait_elapsed_us) / 1e6, 2)    AS blocked_s,   -- waiting for downstream
    formatReadableQuantity(sum(input_rows))        AS rows_in
FROM system.processors_profile_log
WHERE query_id = 'obs_heavy_2'
  AND event_date = today()
GROUP BY processor
ORDER BY busy_s DESC
LIMIT 5;| Processor | Instances | Busy | Starved | Blocked | Rows in |
|---|---|---|---|---|---|
| MergeTreeSelect (reader) | 2 | 122.03 s | 0 | 47.58 s | n/a |
| AggregatingTransform | 2 | 47.42 s | 122.20 s | 0.19 s | 336.45 million |
| ConvertingAggregatedToChunksWithMergingSource | 2 | 0.39 s | 0 | 0 | n/a |
The aggregators were busy for 47 seconds and spent 122 seconds waiting for input. The readers were busy for 122 seconds. After the fix, aggregation was no longer the bottleneck. Reading and decompressing 41,071 granules on a slow lab disk was. In query_log, disk wait (116 s) was again larger than CPU (42.5 s). Faster aggregate functions will not help this query any more. Reading less will: a tenant in the filter, a projection, or a pre-aggregated table.
system.query_thread_log breaks the same query down by thread. Be careful with it: one 85-second query wrote 1,666 thread rows on our lab node. That is why our profile keeps log_query_threads off and turns it on per session.
Signal 7 · storage
system.part_log: ClickHouse insert performance and merge pressure
Not every ClickHouse performance problem is a SELECT, and not all ClickHouse monitoring is about queries. Small, frequent inserts create many parts, and background merges then rewrite those rows again and again. system.part_log records each event with its type (NewPart, MergePartsStart, MergeParts, MutatePart, MovePart, RemovePart and others), duration, rows, merge reason and peak memory. The event types are documented in the part_log reference.
To show the pattern, we ran 40 inserts of 5,000 rows each into a fresh MergeTree table, then grouped part_log by event:
-- ClickHouse monitoring for inserts: part and merge activity for one table today
SELECT
    event_type,
    merge_reason,
    count()                                      AS events,
    round(avg(duration_ms), 1)                   AS avg_ms,
    max(duration_ms)                             AS max_ms,
    formatReadableQuantity(sum(rows))            AS rows_touched,
    formatReadableSize(max(peak_memory_usage))   AS peak_mem
FROM system.part_log
WHERE database = 'lab'
  AND table = 'ingest_demo'
  AND event_date = today()
GROUP BY event_type, merge_reason
ORDER BY events DESC;| Event | Reason | Events | Avg ms | Max ms | Rows touched |
|---|---|---|---|---|---|
| NewPart | NotAMerge | 40 | 1.7 | 5 | 200 thousand |
| MergeParts | RegularMerge | 7 | 27.9 | 69 | 740 thousand |
200,000 rows were inserted, and merges rewrote 740,000 rows: 3.7 times the inserted volume, and this is a table with no queries at all. At production insert rates the same ratio becomes merge CPU and disk writes that compete with SELECTs. When the NewPart count per minute climbs, batch on the client side or use asynchronous inserts. Watch MaxPartCountForPartition in system.asynchronous_metrics; it is exported to Prometheus as well.
Signal 8 · the server
metric_log and asynchronous_metric_log: ClickHouse monitoring for the whole node
system.metric_log stores the history of system.metrics (current values such as running queries and tracked memory) and system.events (counters), one row per collection interval. system.asynchronous_metric_log does the same for values computed in the background, such as load average, resident memory and jemalloc statistics. The monitoring guide describes all three sources.
-- ClickHouse monitoring: the node during the failing query, in 30-second buckets
SELECT
    toStartOfInterval(event_time, INTERVAL 30 SECOND)                AS t,
    round(avg(CurrentMetric_MemoryTracking) / 1048576)               AS tracked_mib,
    max(CurrentMetric_Query)                                         AS running_queries,
    round(avg(ProfileEvent_OSCPUVirtualTimeMicroseconds) / 1e6, 2)   AS busy_vcpus,
    round(avg(ProfileEvent_SelectedRows) / 1e6, 2)                   AS mrows_per_s
FROM system.metric_log
WHERE event_time BETWEEN '2026-10-03 10:59:30' AND '2026-10-03 11:02:00'
GROUP BY t
ORDER BY t;

-- ClickHouse monitoring: background metrics over the same window
SELECT metric, round(avg(value), 2) AS avg_value
FROM system.asynchronous_metric_log
WHERE event_time BETWEEN '2026-10-03 11:00:00' AND '2026-10-03 11:01:50'
  AND metric IN ('LoadAverage1', 'OSUserTimeNormalized', 'OSIOWaitTimeNormalized',
                 'MemoryResident', 'jemalloc.allocated', 'jemalloc.resident')
GROUP BY metric;
Tracked memory went from 297 MiB to 2,769 MiB while one query was running. The node averaged about 0.6 busy vCPUs out of 2, with a load average of 2.42 and OSIOWaitTimeNormalized at 0.42. The CPU was not saturated; threads were waiting on I/O. Resident memory averaged 3.35 GB against 2.42 GB allocated by jemalloc. That gap is memory the allocator holds but the server is not using, and it is what the 26.9 profiler, described below, helps explain.
Signal 9 · alerting
The Prometheus endpoint: ClickHouse performance monitoring outside the server
System tables are for investigation. ClickHouse monitoring alerts belong outside the server, so they still work when the server is unwell. The <prometheus> block in our config exposes metrics, events, asynchronous metrics and error counters on port 9363, as described in the Prometheus metrics documentation. On our lab node one scrape returned 9,488 lines.
# ClickHouse monitoring: one scrape, filtered to the series we alert on
curl -s http://127.0.0.1:9363/metrics | grep -E '^ClickHouse(Metrics_Query|Metrics_MemoryTracking|ErrorMetric_MEMORY_LIMIT_EXCEEDED|AsyncMetrics_MaxPartCountForPartition) '

# ClickHouseMetrics_Query 0
# ClickHouseMetrics_MemoryTracking 513855163
# ClickHouseErrorMetric_MEMORY_LIMIT_EXCEEDED 3
# ClickHouseAsyncMetrics_MaxPartCountForPartition 6
These are the ClickHouse monitoring rules we start every customer with. The thresholds are starting points to tune against your own baseline, not universal numbers.
# prometheus/rules/clickhouse.yml: ClickHouse monitoring alerts (starting thresholds; tune per cluster)
groups:
  - name: clickhouse-performance
    rules:
      # Any query hitting the memory limit is a page: work was thrown away
      - alert: ClickHouseMemoryLimitExceeded
        expr: increase(ClickHouseErrorMetric_MEMORY_LIMIT_EXCEEDED[10m]) > 0
        labels: { severity: page }

      # Tracked memory above 80% of the server limit for 5 minutes
      - alert: ClickHouseMemoryPressure
        expr: ClickHouseMetrics_MemoryTracking / ${CH_MAX_SERVER_MEMORY_BYTES} > 0.8
        for: 5m
        labels: { severity: ticket }

      # Parts piling up in one partition: inserts outrunning merges
      - alert: ClickHouseTooManyParts
        expr: ClickHouseAsyncMetrics_MaxPartCountForPartition > 300
        for: 10m
        labels: { severity: ticket }

      # Replica lag; the same signal /replicas_status turns into HTTP 503
      - alert: ClickHouseReplicaDelay
        expr: ClickHouseAsyncMetrics_ReplicasMaxAbsoluteDelay > 300
        for: 5m
        labels: { severity: ticket }
Error counters reset when the server restarts, so always use increase() or rate(), never the raw value. We saw the reset ourselves: the counter read 3 before a config restart and 0 after it. For load balancers, /ping answers when the server is up, and /replicas_status returns 503 when a replica is too far behind. The built-in /dashboard page plots the main metrics without any extra setup.
New in 26.9
Allocation profiling with system.jemalloc_sampled_allocations
The resident-versus-allocated gap from signal 8 is hard to explain with trace_log. trace_log records allocations as they happen. It does not show what is still held. ClickHouse 26.9 adds system.jemalloc_sampled_allocations, which lists the allocations jemalloc has sampled and that are still live. On our 26.9.2.8 build it has these columns:
-- ClickHouse performance observability in 26.9: live sampled allocations
DESCRIBE system.jemalloc_sampled_allocations;

-- trace            Array(UInt64)   stack at allocation time
-- age_ns           UInt64          how long the block has been held
-- size / usize     UInt64          requested and usable size
-- size_class       UInt16
-- arena            UInt32
-- thr_uid          UInt64
-- sample_interval  UInt64
-- alloc_time       DateTime
-- weight           Float64         sampling weight for estimating totals
Sampling depends on the jemalloc profiler, which is off by default. The allocation profiling guide covers the server switches (jemalloc_enable_global_profiler, jemalloc_collect_global_profile_samples_in_trace_log) and the per-query settings. On our lab server, with the profiler off, the table returned zero rows, as expected. We have not yet run it on a production fragmentation case, so we leave the analysis queries for a follow-up rather than publish ones we have not tested on real data.
Honest notes
What did not work, and what caught us out
A repeat run of the bad query looked cheap until we noticed the query condition cache was reusing filter results. Benchmarks and EXPLAIN ANALYZE comparisons now always set use_query_condition_cache = 0. OSIOWaitMicroseconds in metric_log stayed at zero: the server log said delay accounting was disabled in the kernel. The normalised I/O wait in asynchronous metrics still worked. Our first processors_profile_log query used a column called processor_name; in 26.9 the column is name.
Two more lessons from the lab are worth keeping. Changing a system log’s configuration renamed the existing tables to query_log_0, trace_log_0 and so on. Incident queries written against system.query_log silently missed the older rows until we pointed them at the renamed tables. If you run a retention change during an incident, check system.tables for numbered copies.
Also, the fix in this guide, uniq instead of uniqExact, made a different query slower in our ClickHouse Cloud cost measurements. There, each group had few distinct users and the exact hash set was cheap. Here, each country and device group had millions of distinct users. The profile decides, not the rule of thumb. That is the whole case for ClickHouse performance observability.
Runbook
The ClickHouse performance observability checklist we hand to on-call
| Step | Run | Move on when |
|---|---|---|
| 1. Is it happening now? | system.processes, sorted by elapsed | You have a query_id, or nothing is running |
| 2. Which shape? | query_log by normalized_query_hash, exceptions included | One or two fingerprints explain the symptom |
| 3. Does the plan skip data? | EXPLAIN indexes = 1, then EXPLAIN ANALYZE on a non-serving replica | PrimaryKey granules are a small share of the total |
| 4. Memory failure? | query_metric_log timeline, trace_log Memory samples | One function owns the growth |
| 5. CPU-bound? | trace_log CPU leaf functions, collapsed stacks | Top functions match a part of the query you can change |
| 6. Starved instead? | processors_profile_log busy vs starved vs blocked | You know whether to fix the query or the table layout |
| 7. Inserts involved? | part_log NewPart rate and merge rows | Merge rows stay close to insert rows |
| 8. Verify the fix | Same fingerprint query, before and after | Memory, CPU and marks are down on the same data |
Every ClickHouse performance change that comes out of this list goes to staging first, with the old query or setting kept as the rollback. That includes adding a projection, changing an aggregate function or raising a memory limit. We size Prometheus alerts against two weeks of each cluster’s own history before we turn them into pages.
FAQ
ClickHouse performance observability: common questions
Which system table should I check first for a slow ClickHouse query?
If the query is still running, check system.processes and look at ProfileEvents['SelectedMarks']. If it has finished, group system.query_log by normalized_query_hash and include ExceptionWhileProcessing rows. Then use EXPLAIN indexes = 1 on the top fingerprint.
How do I find out why a ClickHouse query exceeded the memory limit (Code 241)?
Use system.query_metric_log to see how memory grew during the query. Then group system.trace_log Memory samples by the first non-allocator frame. In our lab that pointed straight at uniqExact, which held 1.73 GiB.
Is EXPLAIN ANALYZE safe to run on production ClickHouse?
It executes the query fully and only throws the result away, so it uses the same ClickHouse performance budget as the query itself. Run it on a replica that is not serving traffic. EXPLAIN indexes = 1 only plans the query and is safe anywhere.
Does the ClickHouse query profiler slow the server down?
At the documented default of one sample per second it is light, and it is the cheapest ClickHouse performance observability you can leave on. At 10 ms our failing query wrote 55,529 Real-time samples by itself. Raise the rate per query with a SETTINGS clause, and keep a TTL on trace_log.
What should I alert on for ClickHouse monitoring?
Start with the increase of ClickHouseErrorMetric_MEMORY_LIMIT_EXCEEDED, tracked memory against the server limit, MaxPartCountForPartition and replica delay. Use the Prometheus endpoint on port 9363 for ClickHouse monitoring, and tune thresholds against your own baseline.
Further reading
Related ChistaDATA guides and sources
From our blog: advanced ClickHouse troubleshooting, how ClickHouse query execution works and why ClickHouse is so fast.
ClickHouse documentation used for this guide: query_log, query_metric_log, trace_log, processes, part_log, sampling query profiler, EXPLAIN, monitoring, Prometheus metrics, allocation profiling and the changelog.
Test every query, setting and alert in this guide on a staging copy of your own workload before applying it to production, and keep a tested backup and restore path in place while you change anything on a live cluster.
Measurements: ChistaDATA lab, 2 vCPU, about 7 GiB RAM, 2.99 GiB server memory limit, ClickHouse 26.9.2.8, 1,000,000,000-row MergeTree table ordered by (tenant_id, event_time), October 2026. Timings vary between runs; granule and row counts do not. Release facts are from clickhouse.com.
ChistaDATA
Want this run on your own ClickHouse cluster?
ChistaDATA engineers run ClickHouse performance reviews on production clusters. That covers observability config with retention, fingerprint attribution, EXPLAIN ANALYZE and trace_log profiling of the worst queries, measured before-and-after fixes, and Prometheus alerting tuned to your own baseline. We work on 100% open-source ClickHouse, with 24×7×365 coverage and a 15-minute Severity 1 response.
Book a ClickHouse performance review Managed ClickHouse operations
Running ClickHouse in production? ChistaDATA provides ClickHouse consulting for architecture, performance and migrations, and 24×7 ClickHouse support with a 15-minute S1 response. For day-to-day operations see ClickHouse DBA services and ClickHouse managed services.
