ChistaDATA · ClickHouse release engineering · September 2026
ClickHouse 26.8 LTS: The Advanced Features That Change Real-Time Analytics Performance
ClickHouse 26.8 LTS shipped on 10 September 2026 with 98 new features, 128 performance optimisations and 556 bug fixes. For real-time analytics applications, nine of them change how a pipeline should be designed, not just how fast it runs.
This is our engineering read of ClickHouse 26.8 for teams running real-time analytics in production: the cost-based distributed optimizer, the reworked parallel GROUP BY, statistics-driven joins, lazy materialisation on Parquet, Iceberg writes, the streaming HTTP API, background queries, atomic materialized-view population and pipelined SQL. Each section states what changed, why it matters for latency or freshness, the SQL to use it, and what to re-baseline before you upgrade.
01
Query engine
- Cost-based distributed optimizer
- Adaptive parallel GROUP BY
- Statistics built on INSERT, IEJoin
- Fused GROUP BY + ORDER BY LIMIT
02
Ingestion and storage
- Atomic POPULATE for materialized views
- Async inserts on by default (26.3+)
- Lightweight UPDATE, patch parts (25.7+)
- Iceberg writes: S3 Tables, Horizon, Puffin
03
Object storage
- Parquet lazy materialisation
- Parquet dictionary filter push-down
- GeoParquet spatial pruning
- Iceberg manifest prefetching
04
Serving and operations
- Streaming HTTP API: CREATE HANDLER
- Background queries survive disconnects
- Pipelined SQL and query-to-JSON
- system.user_query_log, VALID FOR users
Feature map
Where ClickHouse 26.8 changes a real-time analytics pipeline
A real-time analytics pipeline has four planes: ingest, store, query and serve. The diagram places each ClickHouse 26.8 feature on the plane it affects, with the version it arrived in. The LTS line consolidates everything shipped since 26.3, so an upgrade from 25.8 LTS picks up all of it at once.
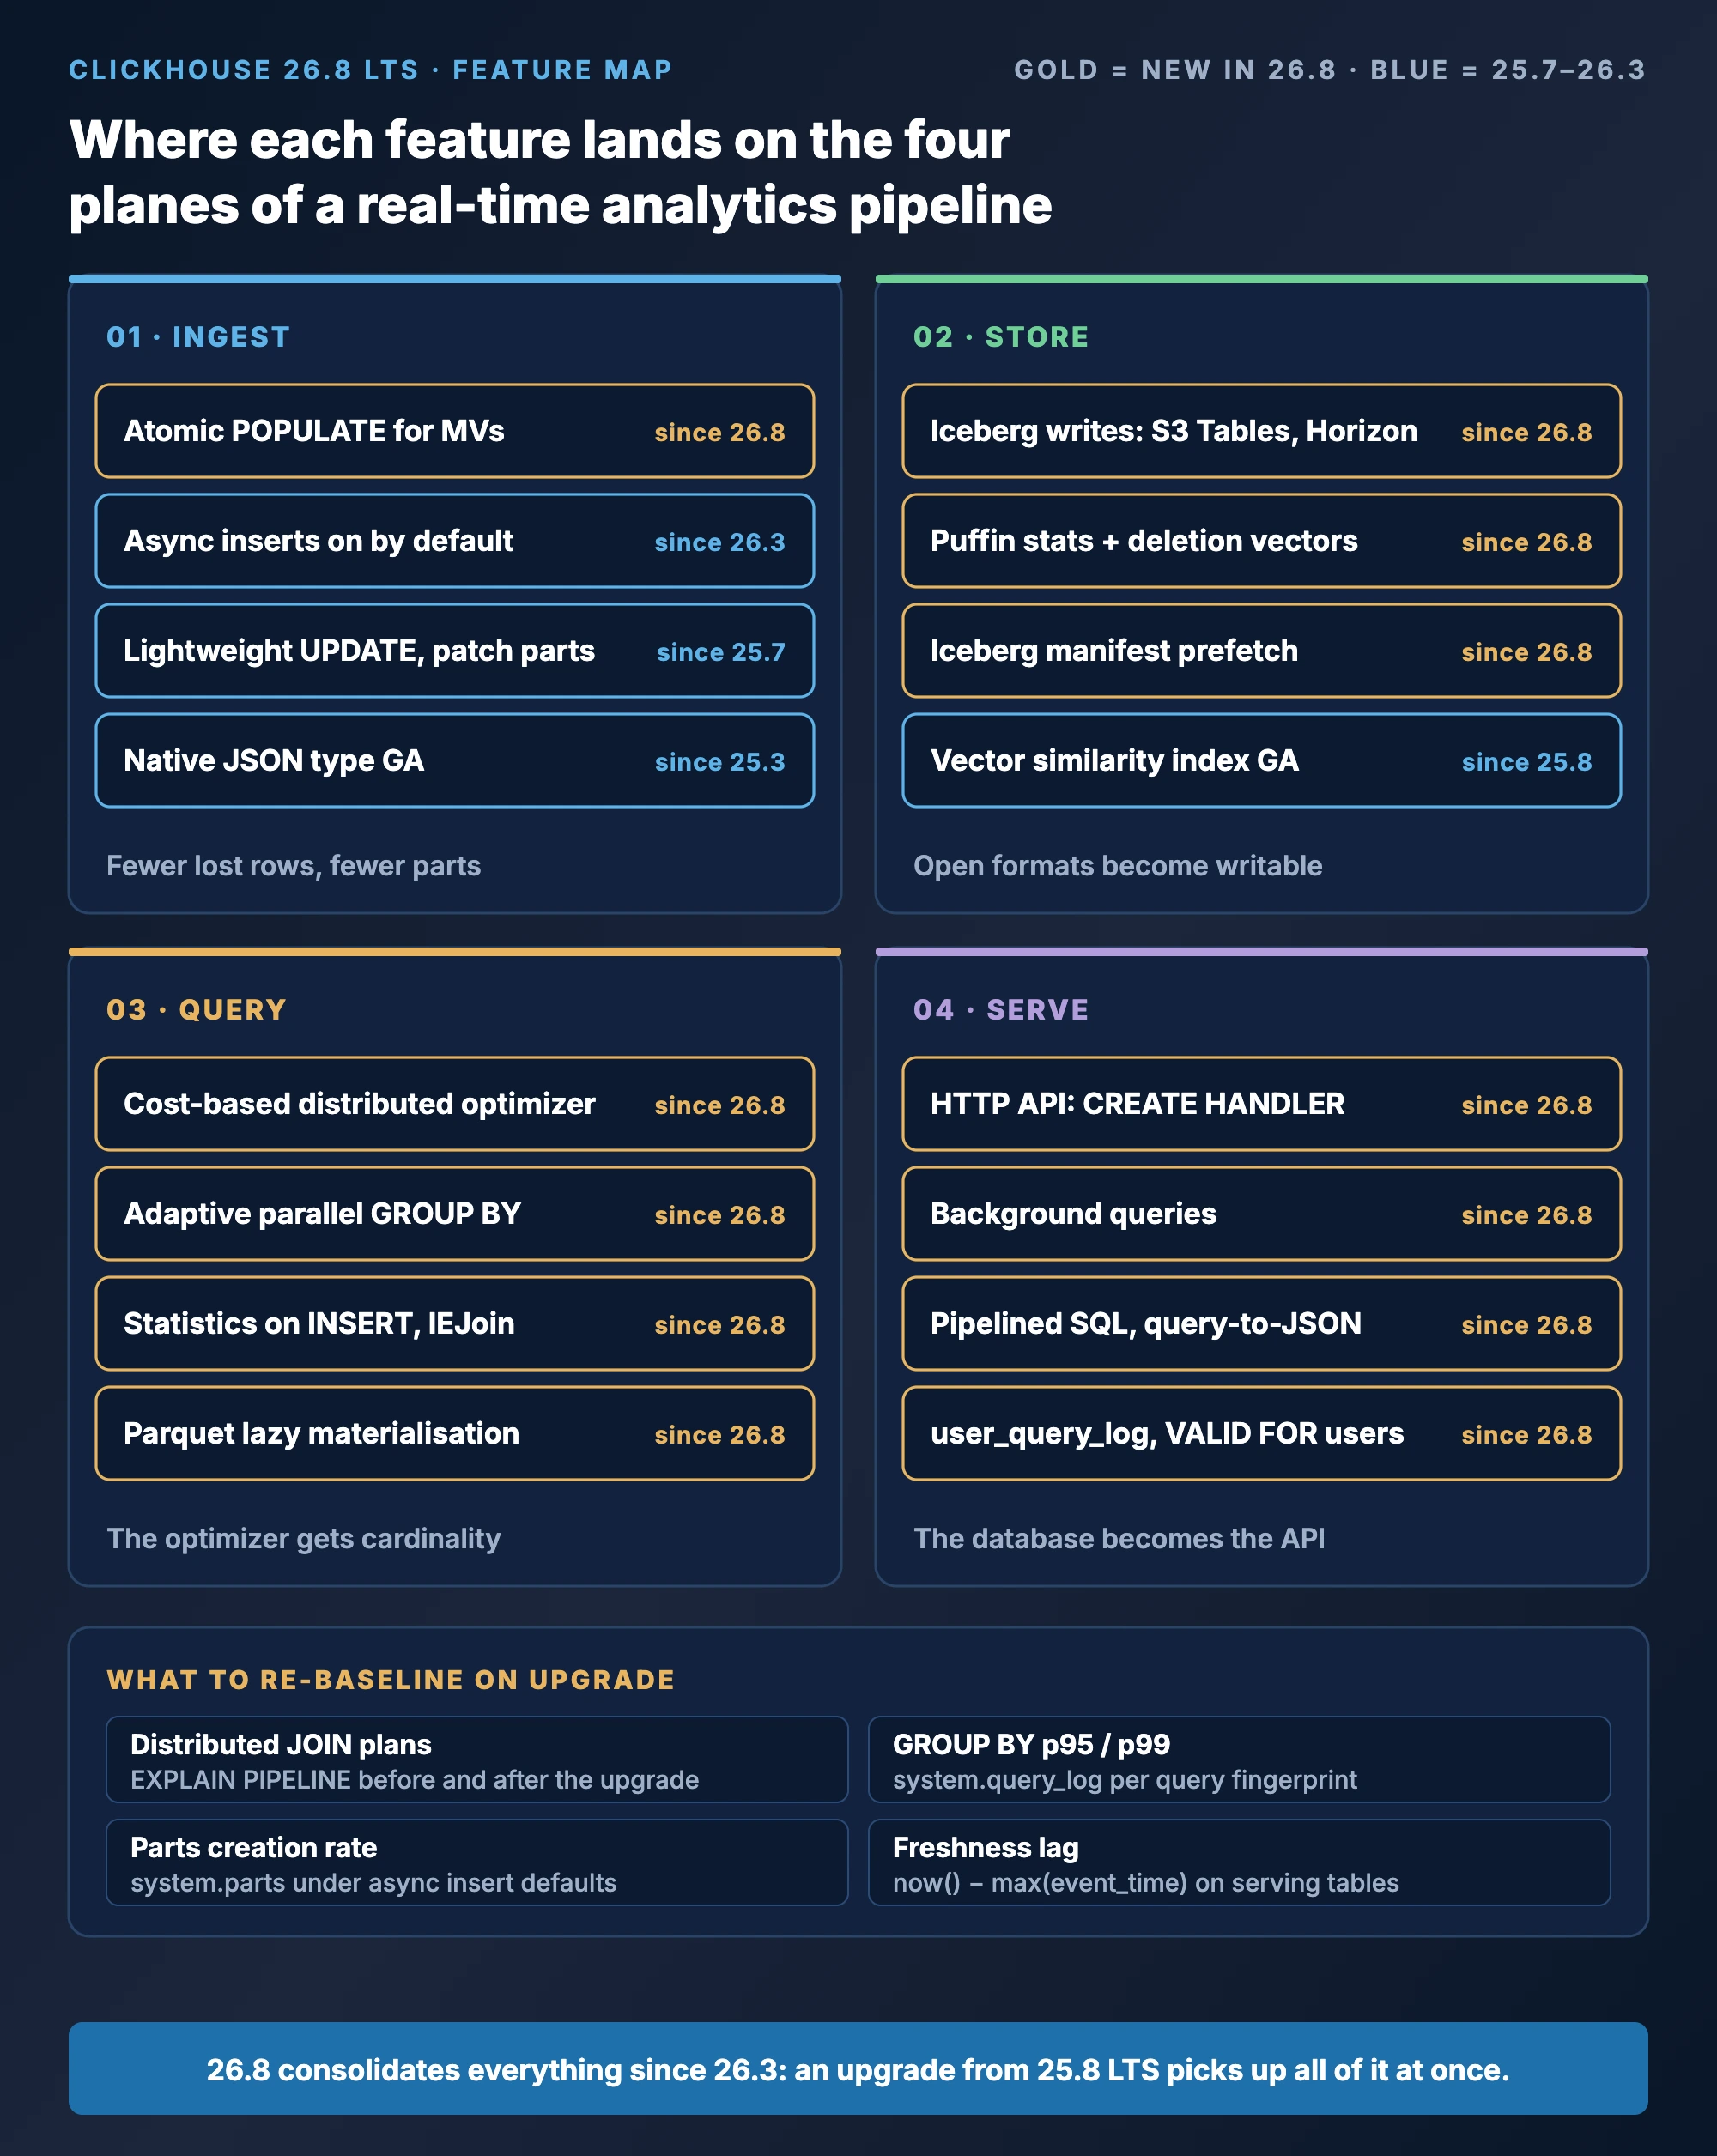
INGEST
Fewer lost rows, fewer parts
Atomic POPULATE closes a race in materialized-view backfills. Async inserts, on by default since 26.3, batch small writes server-side and keep parts counts down.
STORE
Open formats become writable
Iceberg tables behind S3 Tables and Snowflake Horizon catalogs can be created and inserted into. Puffin exposes statistics and deletion vectors.
QUERY
The optimizer gets cardinality
Column statistics are built on INSERT, a cost-based optimizer plans distributed joins, and GROUP BY merges in parallel instead of on one thread.
SERVE
The database becomes the API
CREATE HANDLER exposes parameterised, streamed endpoints from ClickHouse itself, and background queries keep long exports alive after the client disconnects.
Query engine · new in 26.8
The cost-based distributed optimizer
Until ClickHouse 26.8, the shape of a distributed query was largely decided by how you wrote it. Which table was on the right side of the JOIN, whether the join ran on the initiator or on every shard, and how much data moved across the network were consequences of syntax and a handful of settings such as distributed_product_mode. That is workable when a senior engineer writes every query; it is fragile when a BI tool or an application generates them.
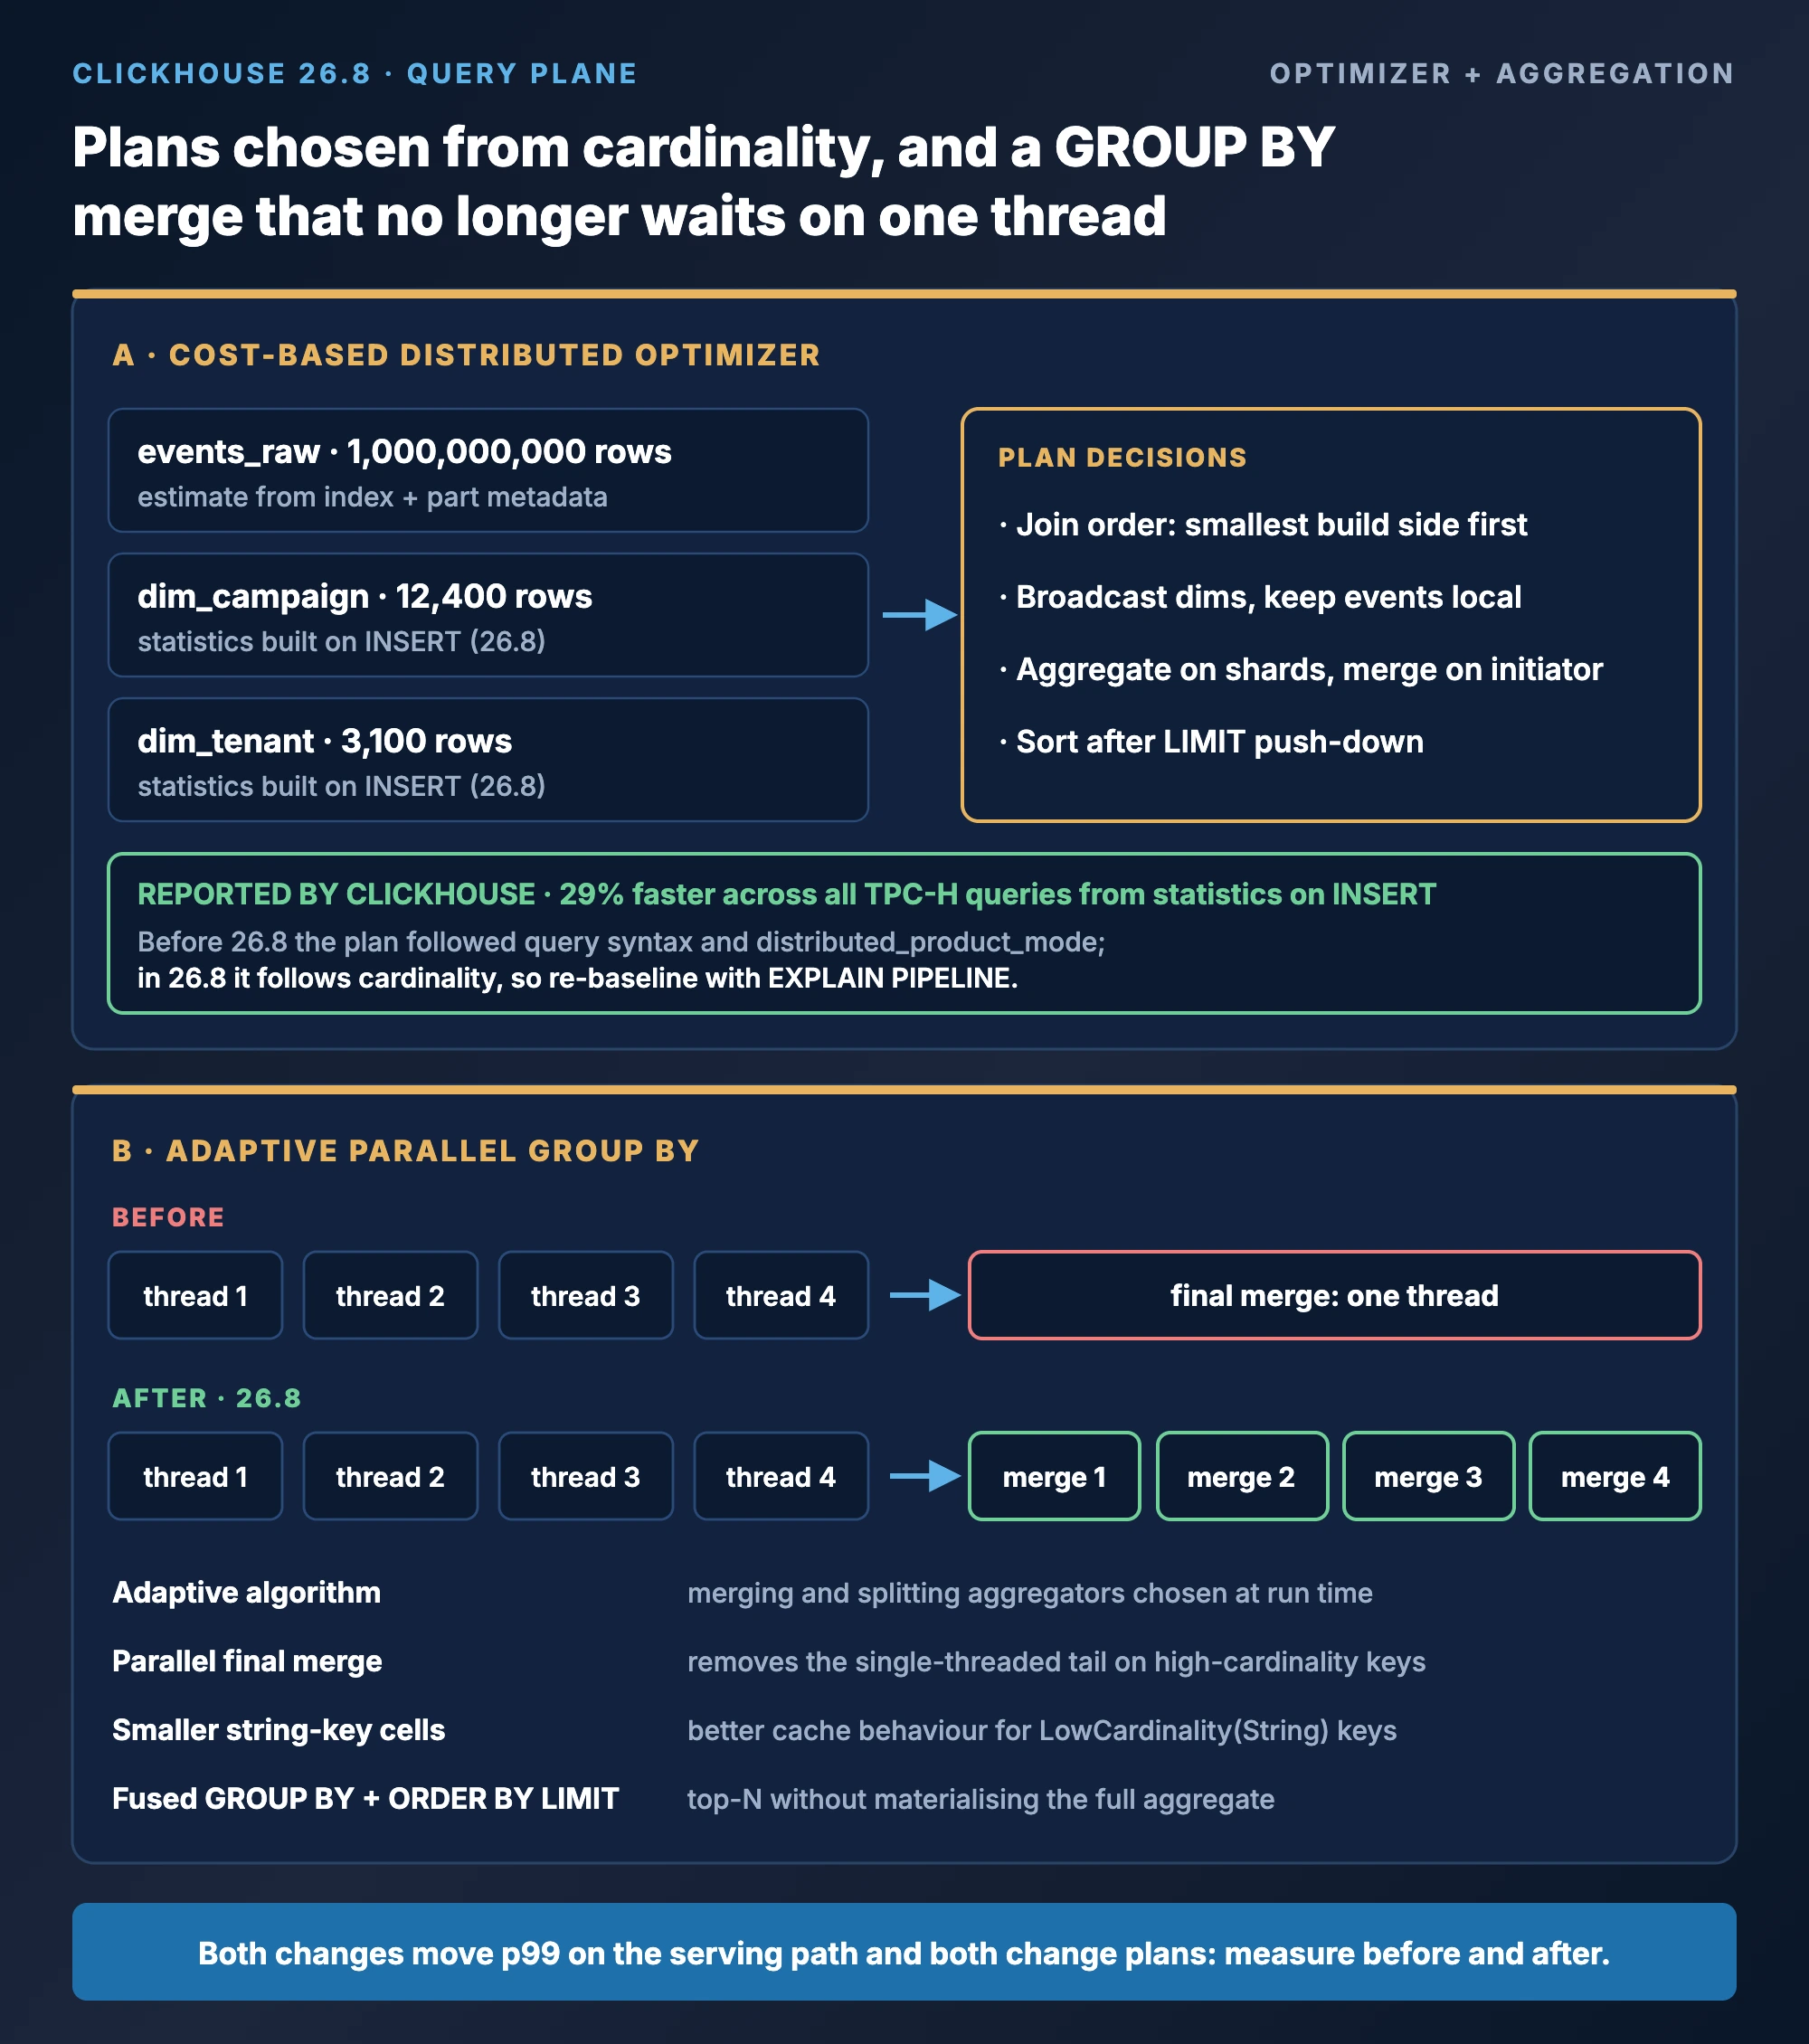
ClickHouse 26.8 introduces a cost-based optimizer for distributed queries. It uses cardinality estimates to decide the order of joins, where aggregation and sorting run, and how data moves between shards. The estimates come from column statistics, which since 26.8 are built automatically on INSERT for small tables, and from the existing sparse index and part metadata for large ones.
For real-time analytics this matters most on the serving path. Dashboards that join a large event table to several dimension tables across shards are the queries whose p99 drifts as data grows. A plan chosen from cardinality rather than syntax keeps that p99 stable without a rewrite every quarter.
EXPLAIN PIPELINE and system.query_log latencies for the top serving queries on the old version, upgrade a replica, and compare before routing traffic. This is standard ChistaDATA upgrade procedure; on 26.8 it is essential.Query engine · new in 26.8
Adaptive parallel GROUP BY: removing the last single-threaded step
GROUP BY is the operation real-time analytics runs most. Every dashboard tile, every rollup and every alert rule is an aggregation. ClickHouse has always parallelised the first phase, where each thread builds its own hash table, but the final merge of those per-thread tables was a single-threaded bottleneck that showed up as a flat tail on p99 latency for high-cardinality keys.
ClickHouse 26.8 changes four things at once. The parallel algorithm is now adaptive, combining merging and splitting aggregators based on what the data looks like at run time. The final merge step is parallelised. Single-string key hash table cells are smaller, which improves cache behaviour on the common LowCardinality(String) dimension key. And GROUP BY fused with ORDER BY LIMIT, introduced in 26.7, now works for any read order, so a top-N over a large aggregate no longer materialises the full result before sorting.
Verifying the effect on a serving query
-- Top-N aggregation typical of a real-time dashboard tile
SELECT
    tenant_id,
    event_type,
    count() AS events,
    uniqMerge(users) AS users
FROM analytics.events_1h
WHERE hour >= now() - INTERVAL 24 HOUR
GROUP BY tenant_id, event_type
ORDER BY events DESC
LIMIT 20;

-- Compare the plan before and after the upgrade
EXPLAIN PIPELINE
SELECT tenant_id, event_type, count() AS events
FROM analytics.events_1h
WHERE hour >= now() - INTERVAL 24 HOUR
GROUP BY tenant_id, event_type
ORDER BY events DESC
LIMIT 20;

-- Measure it from the log, not from the terminal
SELECT
    quantile(0.95)(query_duration_ms) AS p95_ms,
    quantile(0.99)(query_duration_ms) AS p99_ms,
    avg(memory_usage) AS avg_mem
FROM system.query_log
WHERE type = 'QueryFinish'
  AND event_time >= now() - INTERVAL 1 HOUR
  AND query_kind = 'Select'
  AND has(tables, 'analytics.events_1h');
Query engine · new in 26.8
Statistics on INSERT and the join algorithms that use them
Column statistics were introduced in earlier releases as an opt-in you had to declare per column. In ClickHouse 26.8 they are built by default on INSERT for small tables, which in a real-time analytics schema means the dimension tables: tenants, products, campaigns, hosts. Those are exactly the tables the optimizer needs cardinality for when it decides whether to broadcast or shuffle a join.
ClickHouse reports a 29 percent improvement across all TPC-H queries from this change alone. Two further join changes matter for time-series workloads. Conditions with two inequalities, common in “find the interval containing this timestamp” queries, now use IEJoin instead of a filtered CROSS JOIN. And parallel_full_sorting_merge runs the merge phase of a sort-merge join on all cores, which is the algorithm you want when both sides are too large for a hash table.
-- Check statistics presence and cardinality estimates on a dimension table
SELECT
    database,
    table,
    column,
    statistics
FROM system.columns
WHERE database = 'analytics'
  AND table = 'dim_tenant'
  AND statistics != '';

-- Interval containment: two inequalities, now IEJoin in 26.8
SELECT
    e.event_time,
    e.tenant_id,
    c.campaign_id
FROM analytics.events_raw AS e
INNER JOIN analytics.dim_campaign AS c
    ON e.tenant_id = c.tenant_id
   AND e.event_time >= c.starts_at
   AND e.event_time <  c.ends_at
WHERE e.event_time >= now() - INTERVAL 1 HOUR
SETTINGS join_algorithm = 'parallel_full_sorting_merge';
Session-level SETTINGS are the right way to test an algorithm; move a proven choice into a settings profile for the serving role rather than into every query. Our ClickHouse performance tuning practice keeps those profiles under version control with the schema.
Ingestion · 25.7 to 26.8
Ingestion: atomic POPULATE, async inserts by default and patch parts
Three changes across the LTS window alter how fresh data lands and how safely it is transformed.
Atomic POPULATE for materialized views (26.8)
Creating a materialized view with POPULATE while inserts continue used to race: rows inserted during the backfill could be missed by both the backfill and the trigger. ClickHouse 26.8 makes population atomic under materialized_views_populate_atomically = 1, the new default. ClickHouse’s own test showed 50 rows lost under the old behaviour and none under the new. For real-time analytics, where a new rollup is added to a live stream several times a quarter, this removes a class of silent data loss.
Async inserts on by default (26.3 LTS)
Since 26.3 the server batches small inserts before writing a part, without client changes. The flush interval, async_insert_busy_timeout_ms, now sits inside your freshness budget; the batch size, async_insert_max_data_size, bounds parts creation. Both need re-validating on upgrade because pipelines tuned for client-side batching will see different part sizes.
Lightweight UPDATE with patch parts (25.7+)
Late corrections to event data no longer require an ALTER TABLE ... UPDATE mutation that rewrites whole parts. The lightweight UPDATE statement writes a patch part that is applied on read and folded in on merge. It is the right tool for occasional corrections; ReplacingMergeTree remains the choice for high-rate upserts from CDC.
-- A new rollup added to a live stream: atomic in 26.8 by default
CREATE MATERIALIZED VIEW analytics.mv_events_5m ON CLUSTER '{cluster}'
TO analytics.events_5m
AS
SELECT
    toStartOfFiveMinutes(event_time) AS bucket,
    tenant_id,
    event_type,
    count() AS events,
    sum(amount) AS amount_sum
FROM analytics.events_raw
GROUP BY bucket, tenant_id, event_type
POPULATE
SETTINGS materialized_views_populate_atomically = 1;

-- Server-side batching for many small producers (defaults changed in 26.3; set explicitly per role)
ALTER SETTINGS PROFILE ingest_profile SETTINGS
    async_insert = 1,
    wait_for_async_insert = 1,
    async_insert_max_data_size = 10485760,
    async_insert_busy_timeout_ms = 1000;

-- Late correction without rewriting the partition (25.7+)
UPDATE analytics.events_raw
SET amount = 0
WHERE tenant_id = 4711
  AND event_type = 'refund_reversed'
  AND event_time >= today() - 1;
Object storage · new in 26.8
Parquet lazy materialisation, dictionary filtering and Iceberg writes
Real-time analytics platforms increasingly keep history in an open lakehouse and hot data in MergeTree. ClickHouse 26.8 improves both directions of that boundary.
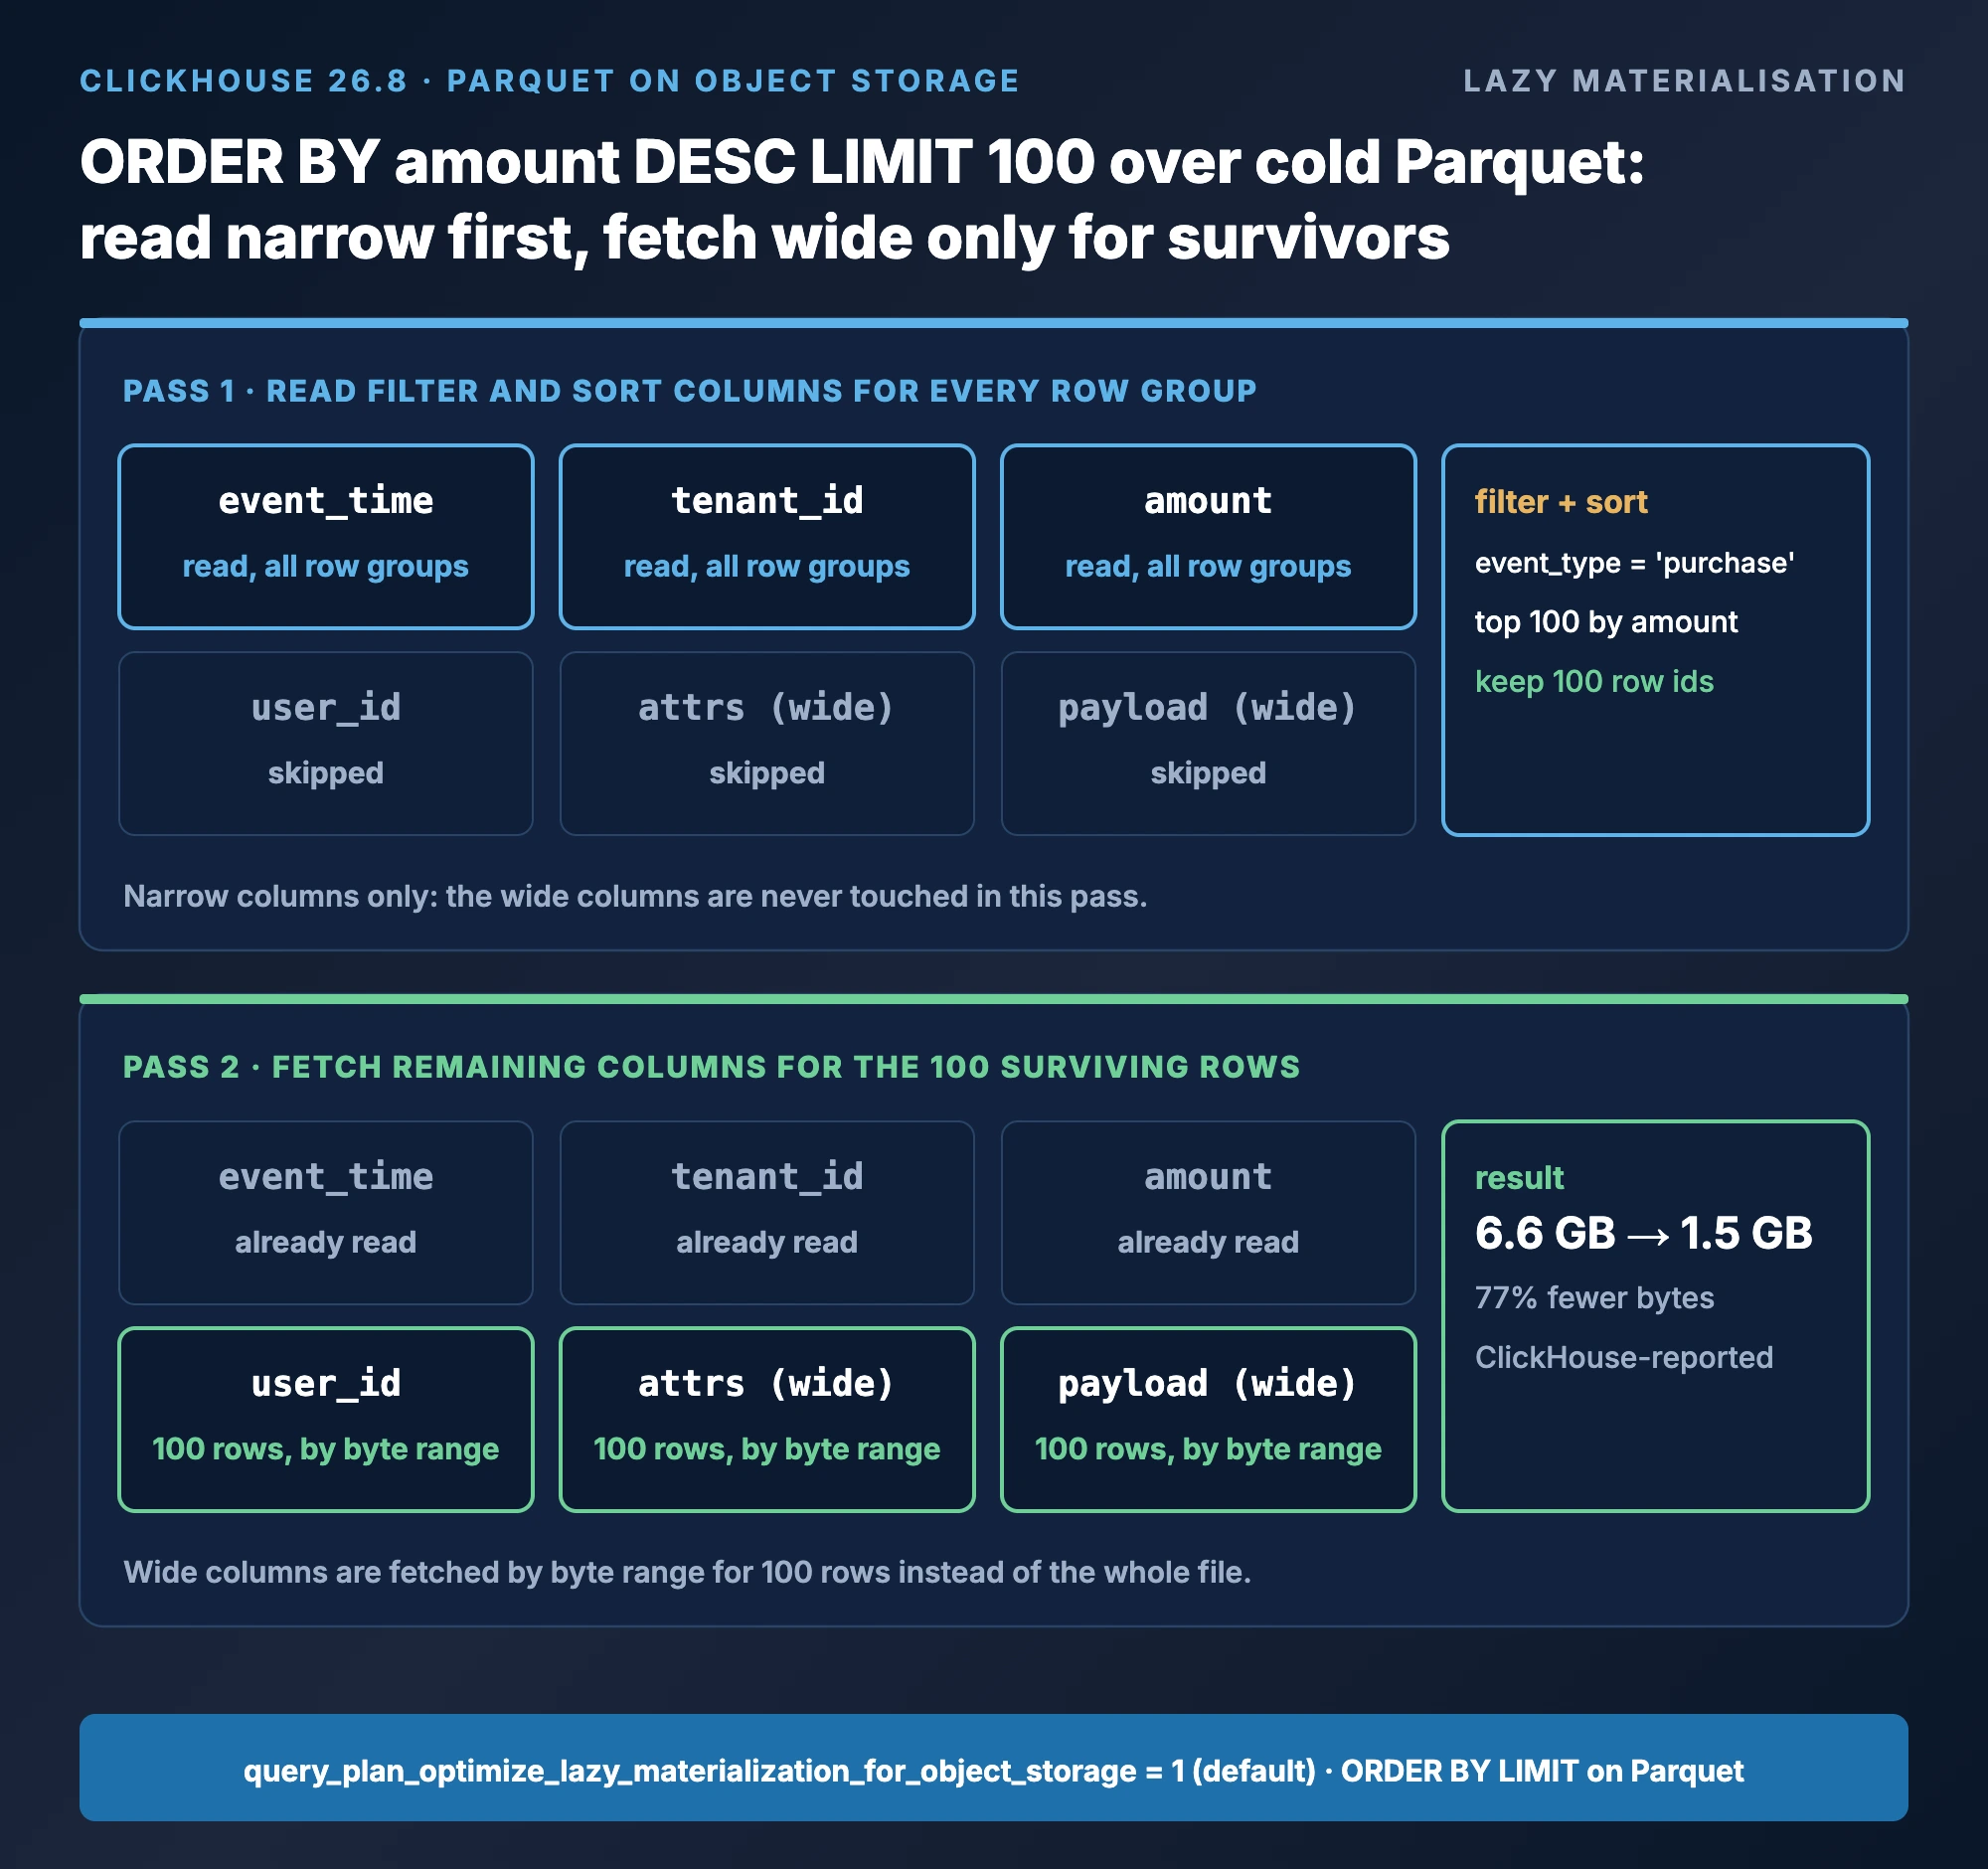
Lazy materialisation for Parquet. For ORDER BY ... LIMIT queries against Parquet on object storage, ClickHouse now reads only the sort and filter columns first, then fetches the remaining columns for the rows that survive. Enabled by default through query_plan_optimize_lazy_materialization_for_object_storage. ClickHouse’s example dropped reads from 6.6 to 1.5 GB, a 77 percent reduction. In practice this is what makes “show me the 100 largest transactions last quarter” affordable against a cold Parquet tier.
Dictionary filter push-down. When a filter targets a dictionary-encoded Parquet column and the value is absent from a row group’s dictionary, the whole row group is skipped. ClickHouse’s test cut data pages from 226 to 12, a 95 percent reduction. Setting: input_format_parquet_dictionary_filter_push_down, default 1 MiB.
Iceberg writes and Puffin. With allow_database_iceberg and allow_insert_into_iceberg, ClickHouse creates and inserts into Iceberg tables behind AWS S3 Tables and Snowflake Horizon catalogs, reads Puffin statistics and deletion vectors, and prefetches manifests concurrently. The cold tier of a real-time platform can now be an Iceberg lakehouse that Spark and Trino also read, written by the same engine that serves the hot tier.
-- Iceberg cold tier behind AWS S3 Tables, writable from ClickHouse 26.8
SET allow_database_iceberg = 1, allow_insert_into_iceberg = 1;

CREATE DATABASE lake
ENGINE = DataLakeCatalog('https://s3tables.${AWS_REGION}.amazonaws.com/iceberg')
SETTINGS catalog_type = 's3tables',
         region = '${AWS_REGION}',
         warehouse = 'arn:aws:s3tables:${AWS_REGION}:${AWS_ACCOUNT_ID}:bucket/${TABLE_BUCKET}';

-- Age hot events out of MergeTree into the lakehouse, one day at a time
INSERT INTO lake.`analytics.events_archive`
SELECT * FROM analytics.events_raw
WHERE toDate(event_time) = today() - 91;

-- Top-100 over cold Parquet: lazy materialisation applies automatically
SELECT event_time, tenant_id, user_id, amount, attrs
FROM s3('https://${BUCKET}.s3.${AWS_REGION}.amazonaws.com/archive/2026/Q2/*.parquet')
WHERE event_type = 'purchase'
ORDER BY amount DESC
LIMIT 100
SETTINGS query_plan_optimize_lazy_materialization_for_object_storage = 1;
Serving · new in 26.8
The streaming HTTP API: ClickHouse as the serving layer
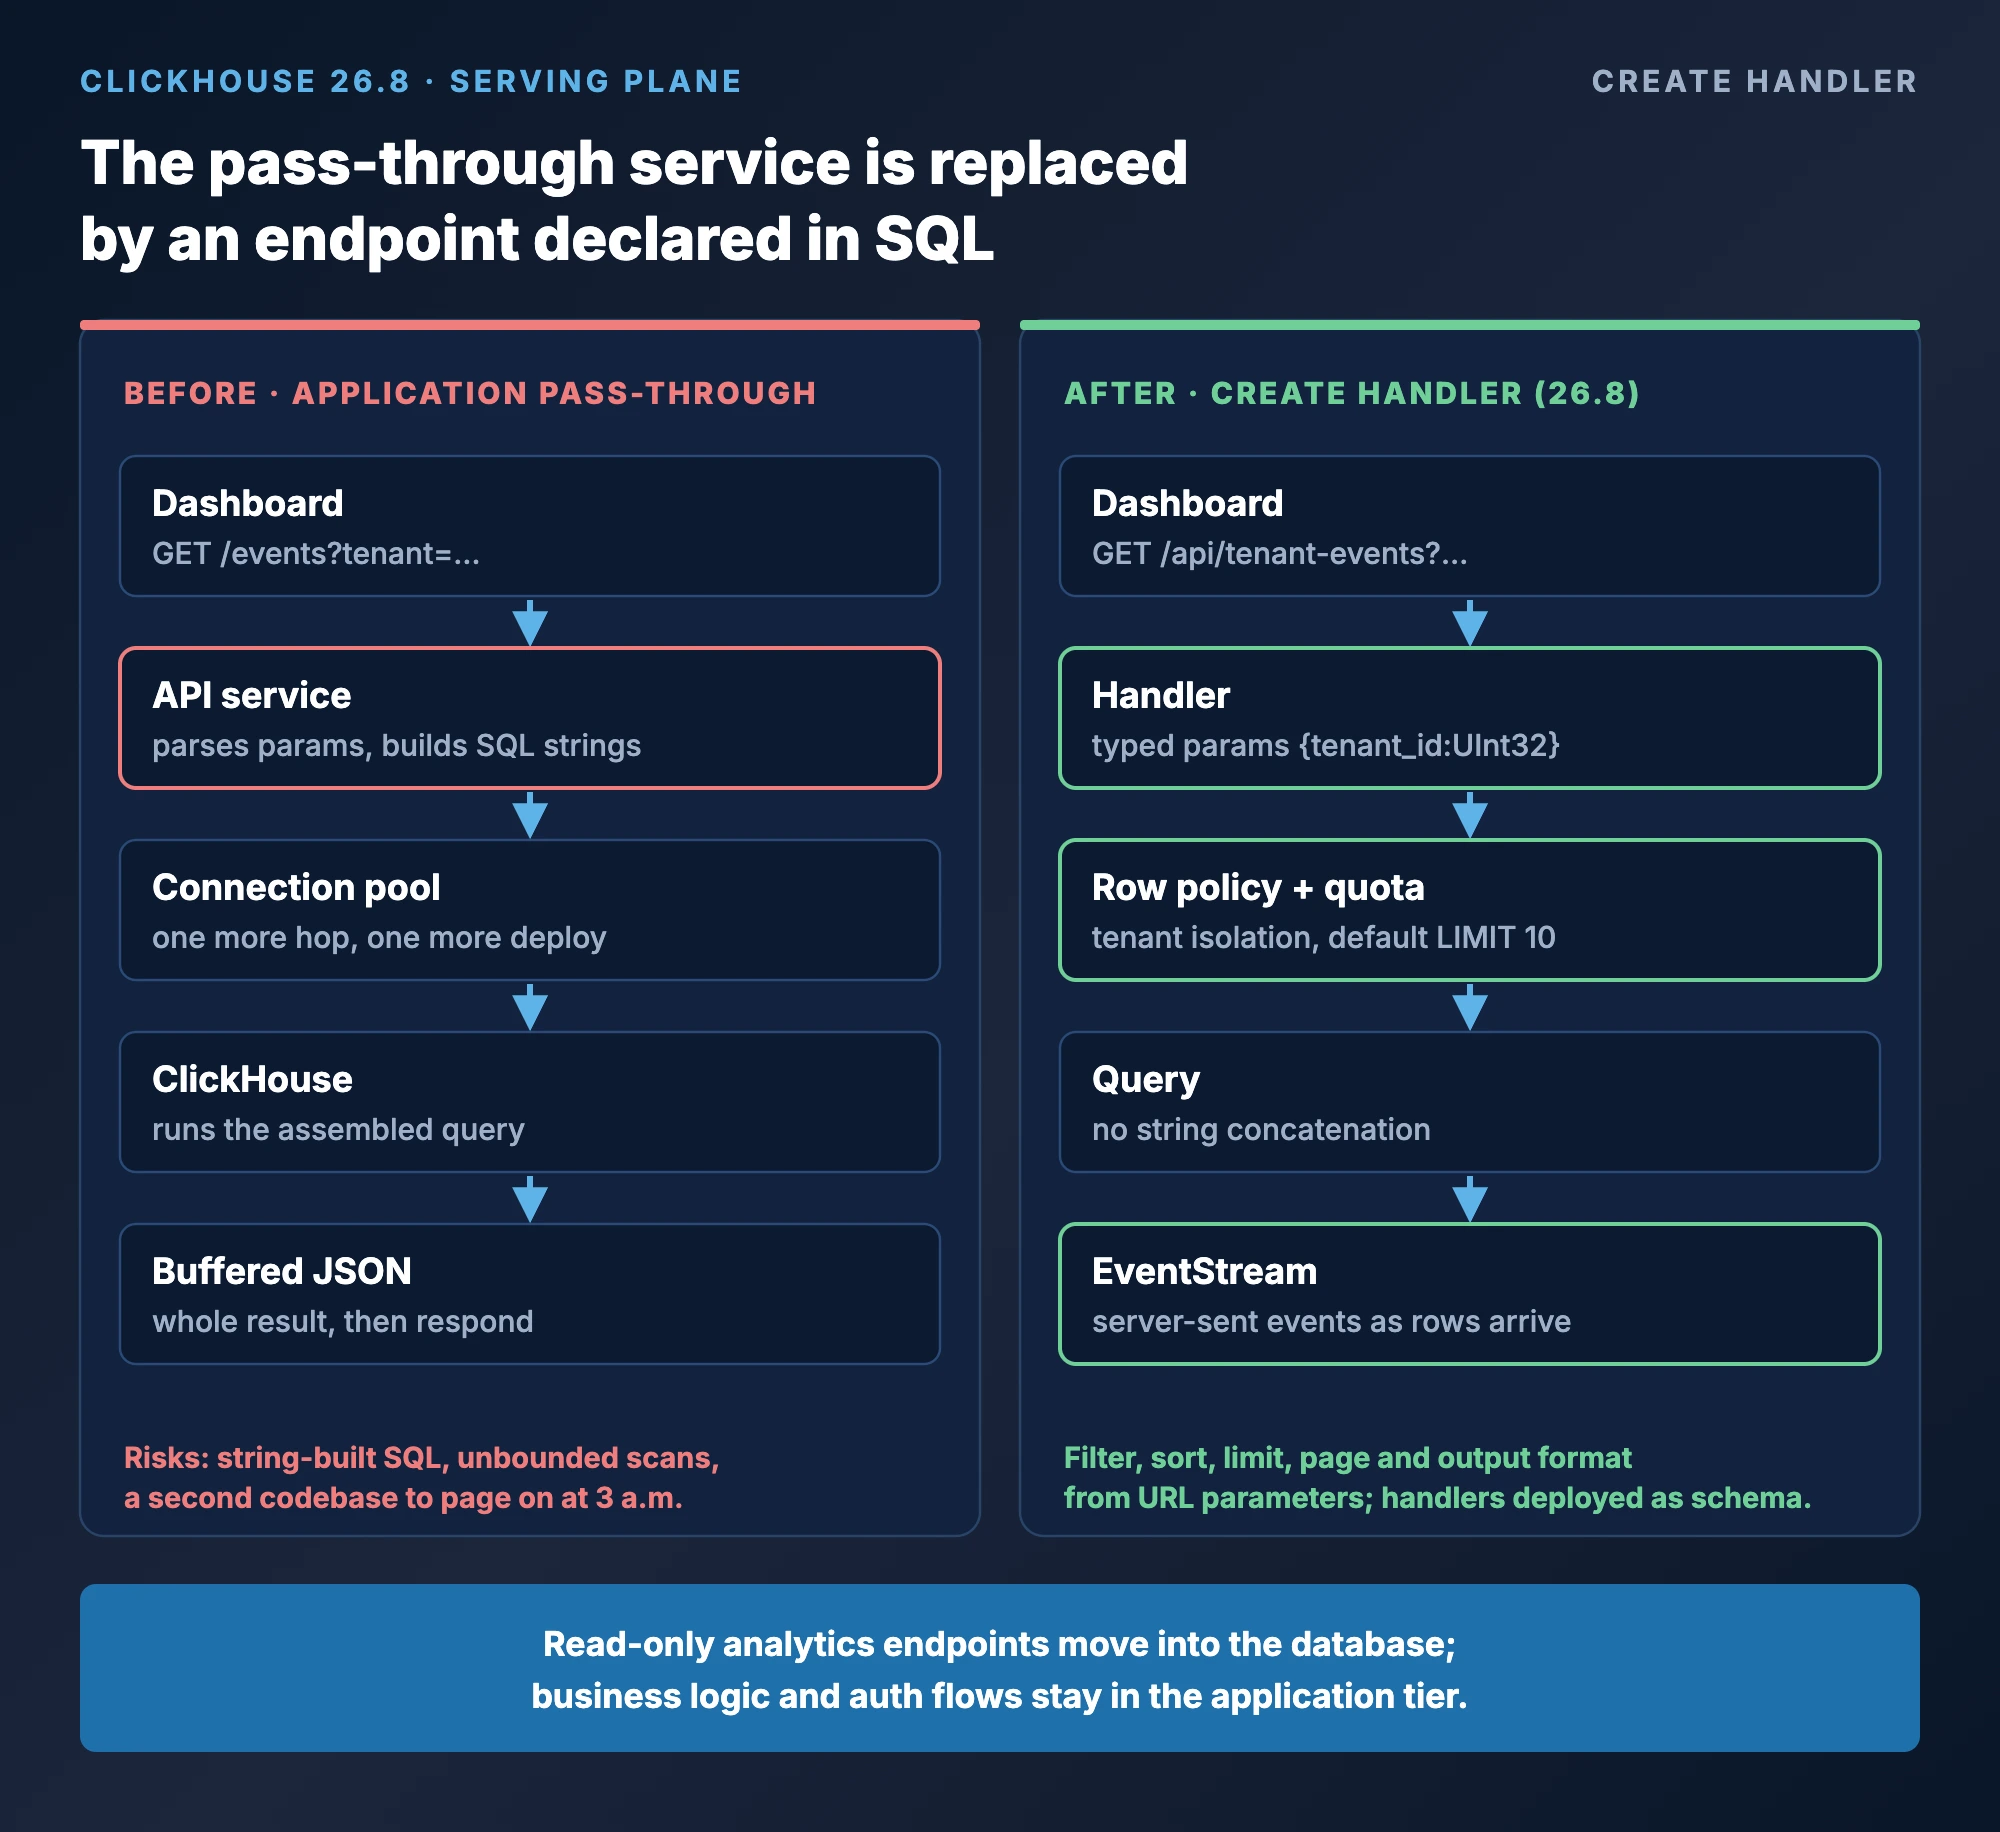
Most real-time analytics products put a thin service between the dashboard and ClickHouse whose only job is to accept a few parameters, build a query, and stream the result. ClickHouse 26.8 lets you declare that endpoint in SQL. CREATE HANDLER binds a URL and HTTP methods to a parameterised query; callers can filter, select columns, sort, paginate and choose an output format through URL parameters, with the query text never exposed and never assembled by string concatenation.
Two settings matter for production. framing_output_format streams results as JSONEachPacketString or EventStream, so a live dashboard can consume server-sent events straight from the database. And the per-user default of 10 rows, plus http_allow_filters_as_unrecognized_url_parameters, keeps a public endpoint from becoming an unbounded scan. Combined with row policies and quotas, this is a complete multi-tenant serving layer without a second codebase to operate.
-- A tenant-scoped endpoint for a live dashboard
CREATE HANDLER tenant_events_5m
URL '/api/tenant-events'
METHODS (GET)
AS
SELECT
    bucket,
    event_type,
    events,
    amount_sum
FROM analytics.events_5m
WHERE tenant_id = {tenant_id:UInt32}
  AND bucket >= now() - INTERVAL {window_minutes:UInt16} MINUTE
ORDER BY bucket;

-- Called with filtering, sorting and pagination from the URL, streamed as SSE
-- curl 'https://${CH_HOST}:8443/api/tenant-events?tenant_id=4711&window_minutes=60&sort=-events&limit=50&framing_output_format=EventStream'

-- Row policy so a handler user can only ever see its tenant, whatever the parameters say
-- (one policy per tenant role; generated with the tenant onboarding runbook)
CREATE ROW POLICY rp_tenant_4711 ON analytics.events_5m
FOR SELECT USING tenant_id = 4711
TO role_api_tenant_4711;
Authenticate handler users with credentials from your secret store and grant them a role with quotas; never expose an admin user through a handler. We treat handler definitions as schema and deploy them with the same change process as tables.
Operations · new in 26.8
Background queries: long exports that survive a dropped connection
Real-time platforms still have batch jobs: nightly exports to a partner, backfills into the lakehouse, large INSERT ... SELECT rebuilds of a rollup. Until 26.8 those were tied to the client session; a dropped connection killed the query and, for non-idempotent targets, left a half-written result. With run_query_in_background = 1 the query continues on the server after the client disconnects. Progress remains visible in system.processes and the outcome in system.query_log, so the job can be monitored and alerted on like any other.
ClickHouse’s example exported 243.6 million rows in 11.8 seconds this way. For our managed estates, the operational gain is that a backfill launched from a CI runner or a laptop no longer depends on that machine staying up.
Exporting a day of events without holding a session open
-- Runs to completion even if this client disconnects
INSERT INTO FUNCTION s3(
    'https://${BUCKET}.s3.${AWS_REGION}.amazonaws.com/exports/events-${RUN_DATE}.parquet',
    '${S3_ACCESS_KEY}', '${S3_SECRET_KEY}', 'Parquet')
SELECT *
FROM analytics.events_raw
WHERE toDate(event_time) = toDate('${RUN_DATE}')
SETTINGS run_query_in_background = 1;

-- Watch it from another session
SELECT query_id, elapsed, read_rows, written_rows, memory_usage
FROM system.processes
WHERE query ILIKE '%exports/events-%';

-- Time-boxed access for an incident responder
CREATE USER incident_responder
    IDENTIFIED WITH sha256_password BY '${IR_PASSWORD}'
    VALID FOR INTERVAL 2 WEEKS;
GRANT role_readonly_analytics TO incident_responder;
Developer surface · new in 26.8
Pipelined SQL and query-to-JSON: safer generated queries
Two features in ClickHouse 26.8 are aimed at the code that generates analytics queries rather than at the engine. Pipelined SQL introduces the |> operator so a multi-stage transformation reads top-down instead of as nested subqueries. ClickHouse does not materialise intermediate results, so there is no performance cost, and there is no setting to enable. The order of stages is semantically significant: a LIMIT placed before an aggregation limits the input to that aggregation, not the output.
parseQueryToJSON() and formatQueryFromJSON() convert a query to a JSON abstract syntax tree and back, with an experimental clickhouse_json dialect behind enable_json_ast_dialect = 1. For products that build queries from user input, this replaces string concatenation with structured manipulation, which removes the SQL-injection class of bug at the source.
-- Pipelined SQL: the same dashboard query, top-down
FROM analytics.events_raw
|> WHERE tenant_id = 4711 AND event_time >= now() - INTERVAL 24 HOUR
|> AGGREGATE count() AS events, sum(amount) AS revenue
   GROUP BY event_type
|> ORDER BY revenue DESC
|> LIMIT 10;

-- Inspect the AST instead of concatenating strings
SELECT parseQueryToJSON('SELECT event_type, count() FROM analytics.events_raw GROUP BY event_type')
FORMAT JSONEachRow;

-- PostgreSQL-style regex operators, also new in 26.8
SELECT count()
FROM analytics.events_raw
WHERE attrs['user_agent'] ~* 'bot|crawler|spider';
Upgrade engineering
Upgrading a real-time analytics estate to ClickHouse 26.8 LTS
26.8 is the LTS line we recommend for new real-time platforms and for estates on 25.8 LTS approaching end of support. It is also the largest behavioural change in a year: the optimizer, GROUP BY, async insert defaults and MV population all change how existing workloads behave. This is the checklist we run.
Baseline the serving path
Capture p95 and p99 per query fingerprint from system.query_log for the last 14 days, and EXPLAIN PIPELINE for the top 50 queries by total duration. Store both with the change record.
Read the breaking-change list
Every release between your current line and 26.8 carries backward-incompatible changes. Between 26.3 and 26.8 alone, community trackers count more than 50. Map each to your settings, schemas and client versions.
Upgrade one replica, route no traffic
Upgrade a single replica per shard, replay the top 50 queries against it, and diff plans and latencies against the baseline. Check parts creation rate and freshness lag under the new async insert defaults.
Roll shard by shard with rollback ready
Downgrade path is a replica re-image from the previous package with data intact; verify it on the first shard before proceeding. Keep the previous package cached on every host.
Adopt features deliberately
Enable handlers, Iceberg writes and pipelined SQL in the workloads that need them, one at a time, each with a measured before-and-after. Do not switch on everything in the release week.
ChistaDATA runs this upgrade path as part of managed services and 24×7 enterprise support, and as a fixed-scope engagement through ClickHouse consulting. Our release notes series tracks every crossing. The standing caveat applies: test before applying to production, and keep a tested backup and disaster-recovery posture in place before the first replica is touched.
FAQ
ClickHouse 26.8 for real-time analytics: frequently asked questions
Is ClickHouse 26.8 an LTS release?
Yes. ClickHouse 26.8 is a long-term support release published on 10 September 2026, following 26.3 LTS. ClickHouse ships two LTS releases a year, each supported for twelve months, plus monthly stable releases.
Which ClickHouse 26.8 feature has the biggest effect on real-time analytics latency?
For most estates, the combination of statistics built on INSERT and the cost-based distributed optimizer, because it stabilises the p99 of multi-table serving queries as data grows. The parallel GROUP BY final merge is the second, especially on high-cardinality keys. Both require re-baselining plans on upgrade.
Does upgrading to 26.8 change ingestion behaviour?
Yes, if you come from before 26.3. Async inserts are on by default, so part sizes and freshness change unless you set the async insert parameters explicitly. Materialized-view POPULATE is atomic by default in 26.8, which is safer but slightly changes backfill timing.
Can ClickHouse 26.8 replace our API service in front of the database?
For read-only analytics endpoints with typed parameters, filtering, pagination and streaming, often yes, using CREATE HANDLER with row policies and quotas. Endpoints that need business logic, authentication flows beyond database users, or write orchestration still belong in an application tier.
Does the lazy materialisation change apply to MergeTree tables?
Lazy materialisation for MergeTree arrived in 25.4. The 26.8 change extends it to Parquet on object storage for ORDER BY LIMIT queries, which is what makes top-N queries over a cold lakehouse tier affordable.
Is pipelined SQL faster than nested subqueries?
No. It is a readability and generation feature; ClickHouse does not materialise intermediate stages, and the same plan is produced. Its value is in query generators and reviews, where stage order is explicit.
Sources
References
- ClickHouse: Release 26.8 LTS
- ClickHouse: Pipelined SQL in ClickHouse 26.8
- ClickHouse: ClickHouse as a streaming HTTP API
- ClickHouse: Release 26.3 LTS
- ClickHouse: What’s new in ClickHouse, 2025 roundup
- ClickHouse documentation: asynchronous inserts
- ClickHouse documentation: system.query_log
- ChistaDATA: Columnar vs row-based databases, measured on 1 billion rows
- ChistaDATA: ClickHouse vectorized query processing
- ChistaDATA: From batch processing to real-time analytics with ClickHouse
- ChistaDATA: ClickHouse DBA services
Next step
Put ClickHouse 26.8 to work on your real-time analytics platform
Bring your current version, your top serving queries and your ingestion rates. We will map which 26.8 features move your latency and freshness numbers, and run the upgrade with a baseline, a gate at every shard and a rehearsed rollback.
Performance figures attributed to ClickHouse are as published in the 26.8 release materials and were not reproduced by ChistaDATA; the one-billion-row figure is from our own lab. Test every change on a non-production environment before applying it to production, and maintain a robust backup and disaster recovery posture.
Running ClickHouse in production? ChistaDATA provides ClickHouse consulting for architecture, performance and migrations, and 24×7 ClickHouse support with a 15-minute S1 response. For day-to-day operations see ClickHouse DBA services and ClickHouse managed services.
