A ClickHouse workshop for CTOs and data architects has one job that a ClickHouse workshop for engineers does not: it has to end in decisions. Whether ClickHouse fits the workload at all, what it will cost at the row counts the business is actually forecasting, how the migration is cut over without a parity incident, and who on the team is allowed to carry the pager afterwards. ChistaDATA University runs exactly that ClickHouse workshop, and this post walks through the three days as we deliver them, with the lab evidence participants see rather than a syllabus.
Everything measured below was run on ClickHouse 26.8.2.7 LTS on a deliberately small single node (2 vCPU, 7 GB RAM, a 3.2 GB server memory cap) against 40 million synthetic events. The absolute numbers are meaningless for your estate; the shapes, the ratios and the mistakes are what transfer, which is the same rule we apply inside the ClickHouse workshop itself. For the full ClickHouse training ladder that surrounds this workshop, see the ChistaDATA University programs and our earlier piece on ClickHouse certification tiers.
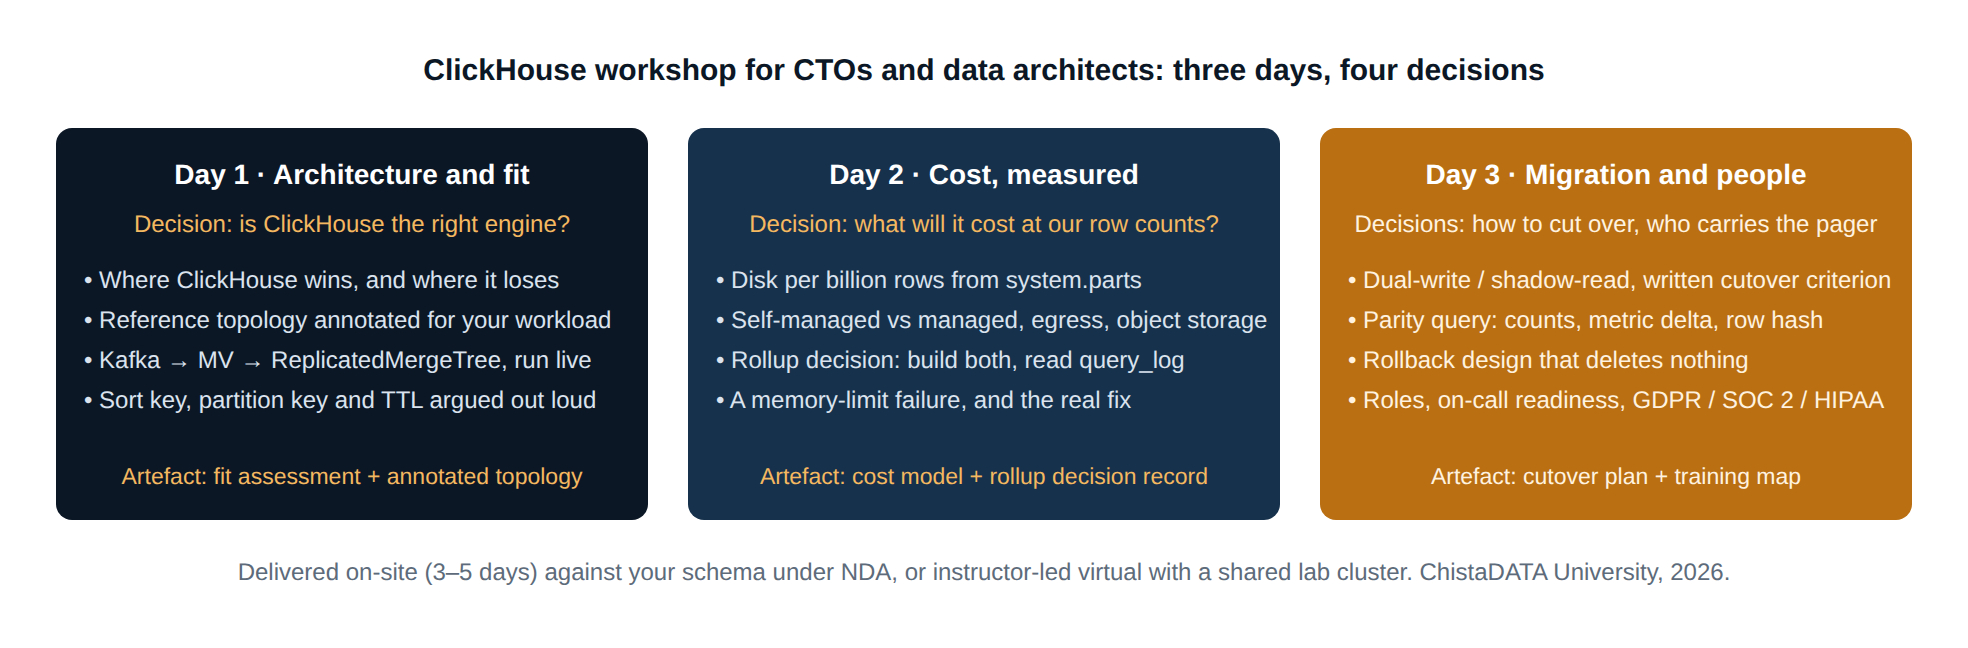
Who this ClickHouse workshop is for, and what it is not
The audience is the sponsoring executive and the person who will own the architecture: a CTO, a VP of engineering or data, a principal or chief data architect, and usually the platform lead who will inherit the cluster. It is the decision-level counterpart of the CHT-900 executive track in the ChistaDATA University catalogue, extended with the architecture material that data architects need in order to sign off on a design rather than just approve a budget.
It is not ClickHouse training for operators. Nobody leaves this ClickHouse workshop able to run a Keeper quorum recovery at three in the morning; that is what the CHT-300 and CHT-400 programs are for, and the workshop ends with an explicit view of which engineers should go into which of those. It is also not a vendor pitch. ChistaDATA works only on open-source ClickHouse, so the “should you use ClickHouse at all” session on day one is allowed to conclude with “not for this workload,” and sometimes does.
Delivery follows the standard ChistaDATA University formats: three to five consecutive on-site days taught against your own schema and data volumes under NDA, or an instructor-led virtual series with a shared lab cluster per cohort. Every claim made in the room is reproduced on a live multi-node cluster, not a slide, and the labs run on the same environment specification as every other ClickHouse workshop we deliver: a dedicated cluster per group with three shards and two replicas each, a three-node ClickHouse Keeper ensemble, Kafka or Redpanda, Prometheus and Grafana, MinIO for object-storage tiers, and a Kubernetes cluster with the ClickHouse operator.
Day one of the ClickHouse workshop: architecture and fit
Day one answers the question most ClickHouse education skips because it is uncomfortable: where does ClickHouse lose? We work through the workload profiles where it wins decisively (append-heavy event streams, wide-scan aggregations, sub-second dashboards over billions of rows) and the profiles where it does not (row-level transactional updates, point lookups by non-key columns at high concurrency, workloads that need multi-statement ACID). Snowflake, BigQuery, Redshift, Druid and Pinot are each compared against the same workload sheet, using their own documentation for their claims.
The architecture half of the day is anchored on one reference topology, drawn below with the versions we teach against. Data architects leave with this diagram annotated for their own workload, which is why we insist on doing this session against real schemas whenever the engagement allows it.
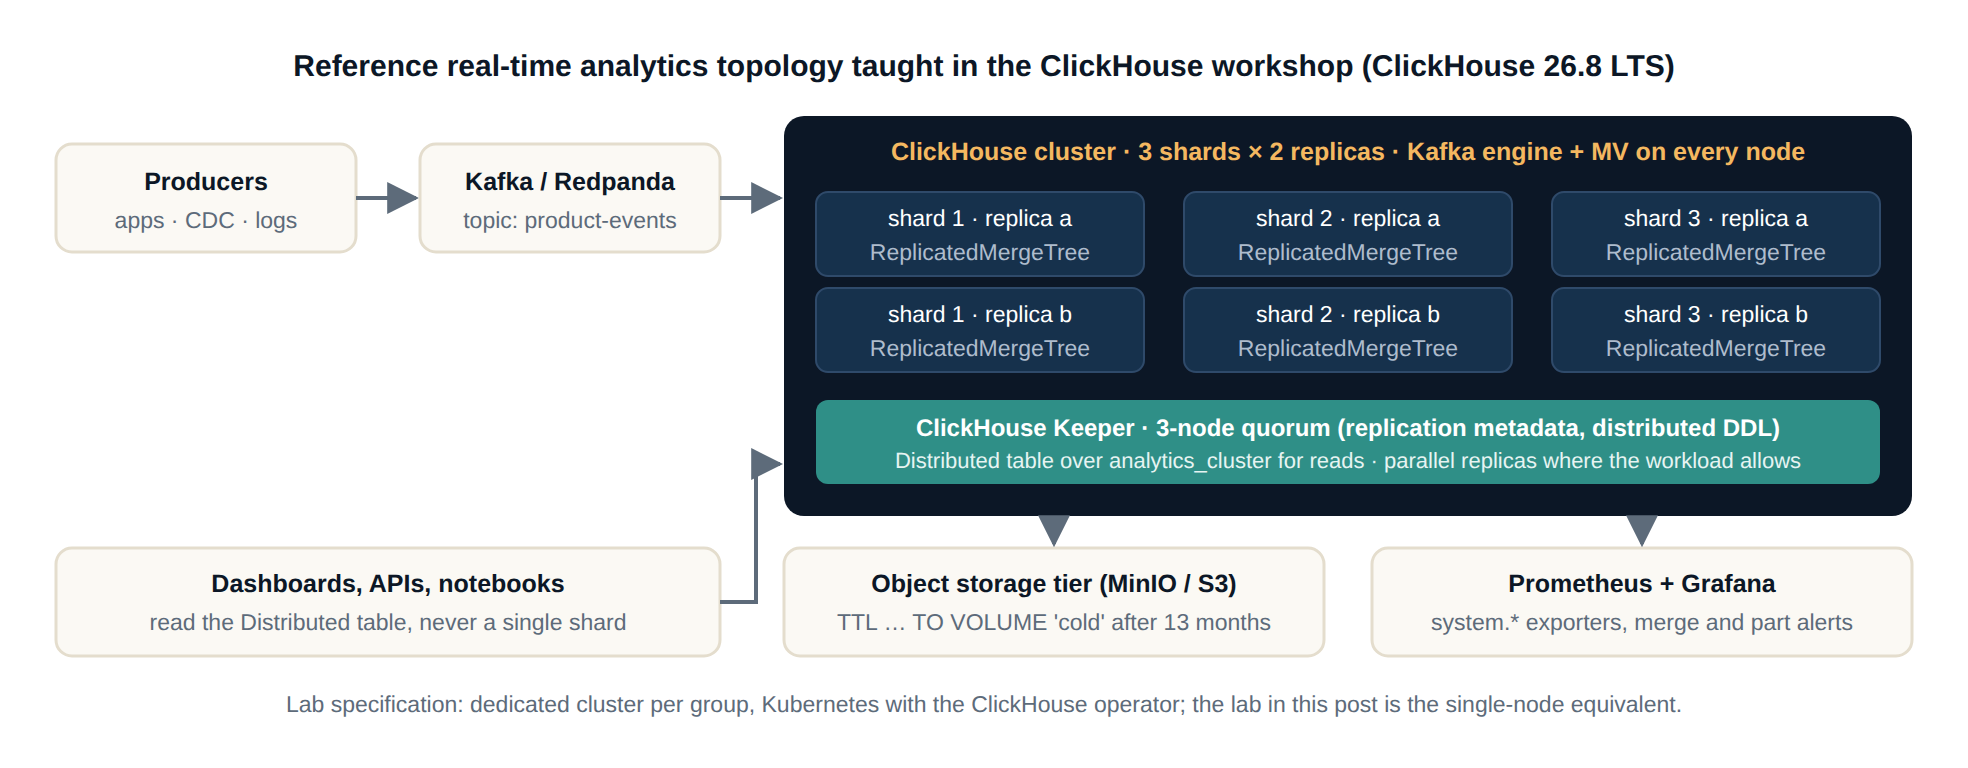
The first piece of code participants see is the ingestion spine of that topology: a Kafka engine table, a materialized view, and a replicated storage table. We show the replicated form because that is what production looks like, and we run the single-node equivalent in the lab so that every architect executes it personally rather than watching.
-- Reference ingestion spine taught in the ClickHouse workshop (ClickHouse 26.8 LTS syntax)
-- 1. Kafka engine table: a consumer, not storage. Never query it directly in production.
CREATE TABLE analytics.events_kafka
(
    event_time   DateTime64(3),
    tenant_id    UInt32,
    user_id      UInt64,
    event_type   LowCardinality(String),
    page_path    String,
    duration_ms  UInt32,
    bytes_out    UInt64,
    country      LowCardinality(String)
)
ENGINE = Kafka
SETTINGS
    kafka_broker_list        = '${KAFKA_BROKERS}',
    kafka_topic_list         = 'product-events',
    kafka_group_name         = 'clickhouse-events-v1',
    kafka_format             = 'JSONEachRow',
    kafka_num_consumers      = 2,
    kafka_max_block_size     = 65536;

-- 2. Replicated storage table: explicit engine parameters, explicit sort key, explicit partition.
CREATE TABLE analytics.events_local ON CLUSTER 'analytics_cluster'
(
    event_date   Date DEFAULT toDate(event_time),
    event_time   DateTime64(3),
    tenant_id    UInt32,
    user_id      UInt64,
    event_type   LowCardinality(String),
    page_path    String,
    duration_ms  UInt32,
    bytes_out    UInt64,
    country      LowCardinality(String)
)
ENGINE = ReplicatedMergeTree('/clickhouse/tables/{shard}/analytics/events_local', '{replica}')
PARTITION BY toYYYYMM(event_date)
ORDER BY (tenant_id, event_date, event_type)
TTL event_date + INTERVAL 13 MONTH TO VOLUME 'cold'
SETTINGS index_granularity = 8192;

-- 3. The materialized view is the only thing that moves rows from Kafka into storage.
CREATE MATERIALIZED VIEW analytics.mv_events_ingest TO analytics.events_local AS
SELECT
    toDate(event_time) AS event_date,
    event_time, tenant_id, user_id, event_type, page_path, duration_ms, bytes_out, country
FROM analytics.events_kafka;
Three design decisions are argued out loud around this DDL, because they are the ones architects most often get wrong on their first ClickHouse deployment: the sort key leads with the column every dashboard filters on (tenant_id), not the timestamp; the partition key is monthly rather than daily so that part counts stay sane at high insert rates; and the TTL moves cold months to an object-storage volume rather than deleting them, which is what makes the day-two cost model work.
Day two of the ClickHouse workshop: what it will cost, measured
Total cost of ownership is where a ClickHouse workshop for executives earns its fee, because the honest answer depends on compression ratios nobody can quote from a datasheet. We measure them. The first query of the day reads system.parts and turns it into the number a CFO understands: disk per billion rows.
SELECT
    formatReadableSize(sum(data_uncompressed_bytes))                          AS logical,
    formatReadableSize(sum(data_compressed_bytes))                            AS on_disk,
    round(sum(data_uncompressed_bytes) / sum(data_compressed_bytes), 2)       AS ratio,
    round(sum(data_compressed_bytes) / sum(rows), 1)                          AS bytes_per_row_on_disk,
    formatReadableSize(sum(data_compressed_bytes) / sum(rows) * 1000000000)   AS disk_per_billion_rows
FROM system.parts
WHERE database = 'analytics' AND table = 'events_local' AND active
FORMAT Vertical;
logical: 2.71 GiB
on_disk: 1.06 GiB
ratio: 2.57
bytes_per_row_on_disk: 28.3
disk_per_billion_rows: 26.38 GiBThose 28 bytes per row are on uniformly random synthetic data, which compresses about as badly as data can; real product telemetry with monotonic timestamps and skewed values routinely lands well under ten. The point of the exercise is not the number, it is that participants now know how to produce the number for their own data before anyone signs a storage forecast. The same session covers self-managed versus managed-service economics and the egress and object-storage cost behaviour that the TTL-to-cold-volume design above depends on.
The rollup decision, including the version that did not work
The second half of day two is the design decision architects ask about most: pre-aggregate with materialized views, or let ClickHouse scan raw rows? We answer it by building both and reading system.query_log. The dashboard query in question is “purchase events per tenant for the first three weeks of August,” run cold with the query condition cache and mark cache dropped between runs.
-- Counts-only hourly rollup: SummingMergeTree, plain numeric columns, no aggregate states
CREATE TABLE analytics.events_1h_counts
(
    bucket           DateTime,
    tenant_id        UInt32,
    event_type       LowCardinality(String),
    events           UInt64,
    duration_ms_sum  UInt64,
    bytes_out        UInt64
)
ENGINE = SummingMergeTree((events, duration_ms_sum, bytes_out))
PARTITION BY toYYYYMM(bucket)
ORDER BY (tenant_id, event_type, bucket);

CREATE MATERIALIZED VIEW analytics.mv_events_1h_counts TO analytics.events_1h_counts AS
SELECT
    toStartOfHour(event_time) AS bucket,
    tenant_id,
    event_type,
    count()                   AS events,
    sum(duration_ms)          AS duration_ms_sum,
    sum(bytes_out)            AS bytes_out
FROM analytics.events_local
GROUP BY bucket, tenant_id, event_type;
-- The same rollup with uniq and quantile aggregate states: AggregatingMergeTree
CREATE TABLE analytics.events_1h_rollup
(
bucket DateTime,
tenant_id UInt32,
event_type LowCardinality(String),
events AggregateFunction(count),
users AggregateFunction(uniq, UInt64),
p95_duration AggregateFunction(quantile(0.95), UInt32)
)
ENGINE = AggregatingMergeTree
PARTITION BY toYYYYMM(bucket)
ORDER BY (tenant_id, event_type, bucket);Here is what the three versions of the dashboard query cost, straight from system.query_log, alongside what each table occupies on disk for the August partition:
   ┌─source───────────┬──ms─┬─read_rows─┬─read───────┬─mem────────┐
1. │ events_local     │ 105 │   9500000 │ 172.14 MiB │ 1.53 MiB   │   -- raw scan, count() + avg()
2. │ events_1h_counts │  24 │   1094172 │ 34.43 MiB  │ 1.70 MiB   │   -- SummingMergeTree rollup
3. │ events_local     │ 217 │   9500000 │ 172.14 MiB │ 28.54 MiB  │   -- raw scan, uniq() + quantile()
4. │ events_1h_rollup │ 373 │   1094172 │ 251.48 MiB │ 39.81 MiB  │   -- AggregatingMergeTree rollup
   └──────────────────┴─────┴───────────┴────────────┴────────────┘

   ┌─table────────────┬─on_disk────┬─row_count─┐
1. │ events_local     │ 256.64 MiB │   9500000 │
2. │ events_1h_counts │ 12.03 MiB  │   1094172 │
3. │ events_1h_rollup │ 74.89 MiB  │   1094172 │
   └──────────────────┴────────────┴───────────┘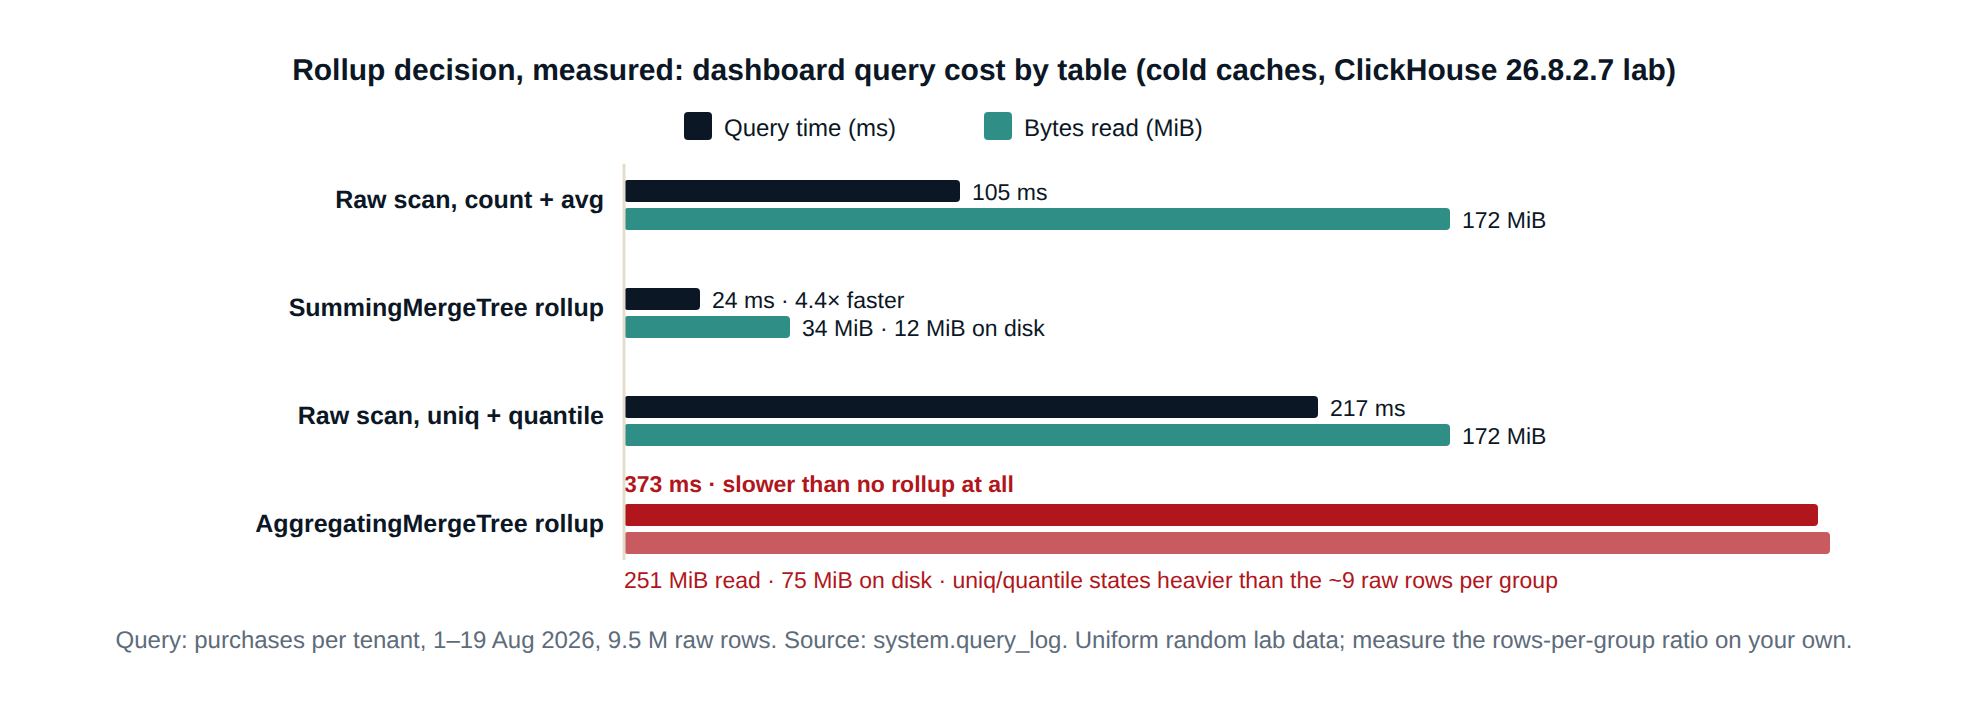
The counts rollup did what everyone expects: 4.4 times faster, one fifth of the bytes read, one twentieth of the disk. The rollup carrying uniq and quantile states did the opposite. It was slower than scanning the raw table and read more bytes, because on this data every event has an almost unique user_id, so each hourly group’s uniq state is heavier than the eight or nine raw rows it summarises.
A rollup only pays when rows per group is large and the state per group is small, and no amount of ClickHouse education replaces measuring that ratio on your own data. We leave this result in the ClickHouse workshop deliberately, because the architects who see it stop proposing “just add a materialized view” as a reflex.
The first attempt at backfilling the state rollup also failed, and we keep that in too:
Code: 241. DB::Exception: (total) memory limit exceeded: would use 3.21 GiB
(attempt to allocate chunk of 6.90 MiB), current RSS: 6.82 MiB, maximum: 3.20 GiB.
OvercommitTracker decision: Query was selected to stop by OvercommitTracker. (MEMORY_LIMIT_EXCEEDED)
-- The fix is not a bigger box; it is letting the aggregation spill, and bucketing coarser.
INSERT INTO analytics.events_1h_rollup
SELECT
toStartOfHour(event_time),
tenant_id,
event_type,
countState(),
uniqState(user_id),
quantileState(0.95)(duration_ms)
FROM analytics.events_local
WHERE event_date >= '2026-08-01'
GROUP BY 1, 2, 3
SETTINGS
max_insert_threads = 2,
max_bytes_before_external_group_by = 1000000000,
max_memory_usage = 2500000000;Five-minute buckets across 400 tenants and six event types exceeded the lab’s 3.2 GB cap; hourly buckets with max_bytes_before_external_group_by completed in under five seconds. Executives in the room learn what a memory limit error actually means, and architects learn that the settings to reach for are on the query, not the purchase order.
Day three of the ClickHouse workshop: migration risk and cutover
Day three is built around one pattern, dual-write with shadow-read, because it is the migration shape that lets a CTO commit to a cutover date without betting the quarter on it. Writes go to both the legacy store and ClickHouse; reads stay on legacy while ClickHouse is queried in the shadow and the results are compared; the cutover criterion is written down before the migration starts, not negotiated during it.
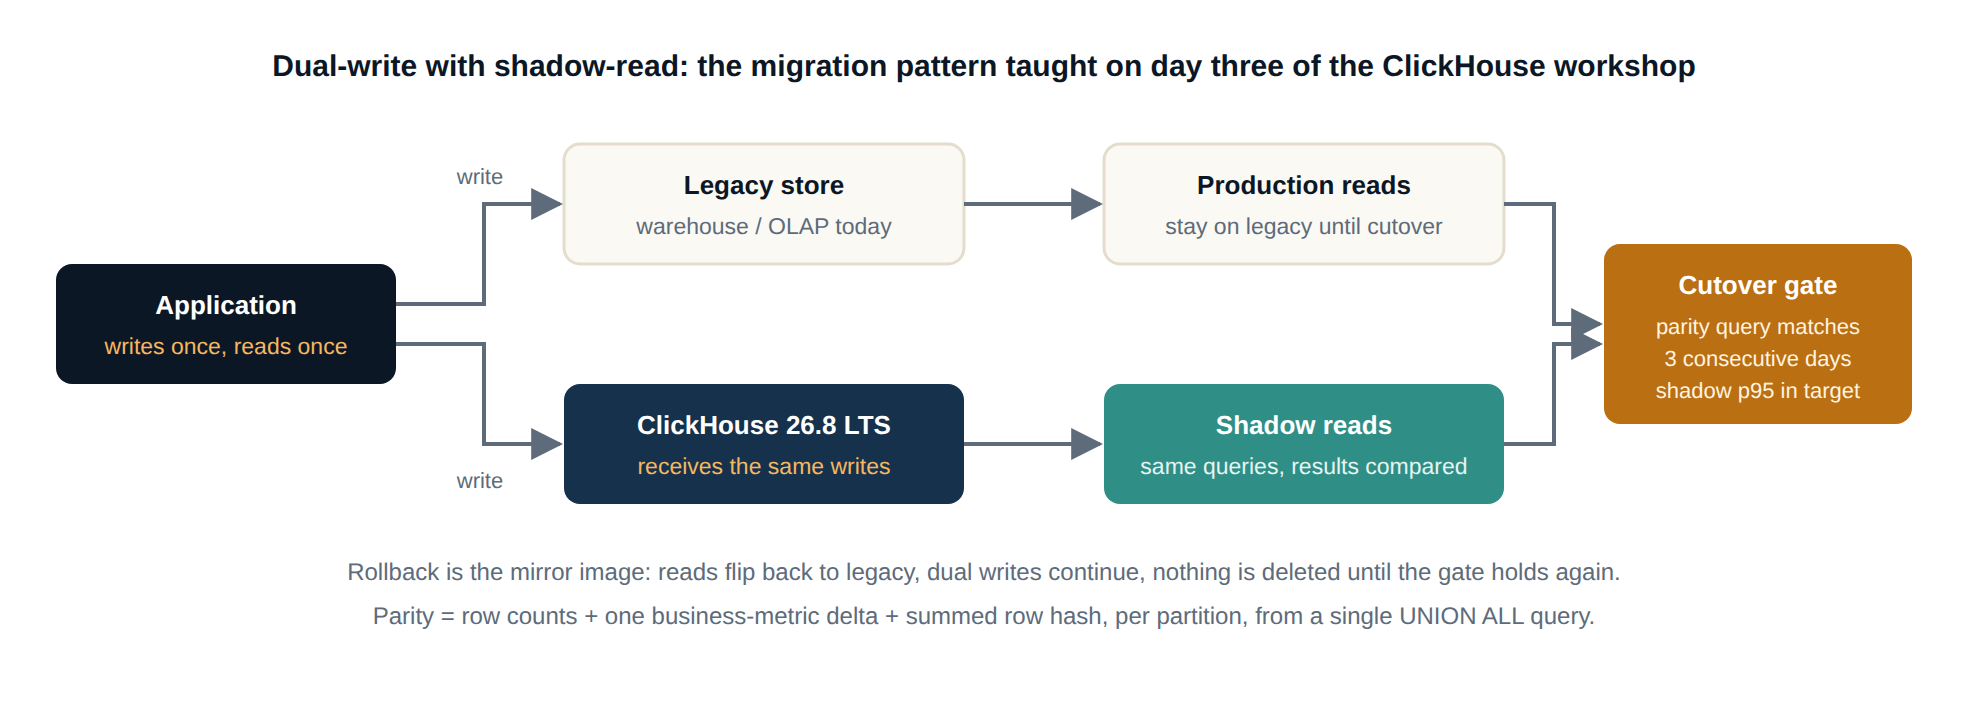
The technical artefact of the day is the parity check, and we run it on the lab against a migrated copy of the August partition so participants see what “parity” means as a query rather than a slide:
-- Data-parity verification between the legacy-shaped table and the migrated table
SELECT
    toYYYYMM(event_date)                                                     AS partition,
    countIf(src = 'legacy')                                                  AS rows_legacy,
    countIf(src = 'migrated')                                                AS rows_migrated,
    sumIf(bytes_out, src = 'legacy') - sumIf(bytes_out, src = 'migrated')    AS bytes_out_delta,
    sumIf(h, src = 'legacy') = sumIf(h, src = 'migrated')                    AS row_hash_match
FROM
(
    SELECT 'legacy'   AS src, event_date, bytes_out,
           cityHash64(tenant_id, user_id, event_time, event_type, page_path, duration_ms, bytes_out) AS h
    FROM analytics.events_local
    WHERE event_date >= '2026-08-01'
    UNION ALL
    SELECT 'migrated' AS src, event_date, bytes_out,
           cityHash64(tenant_id, user_id, event_time, event_type, page_path, duration_ms, bytes_out) AS h
    FROM analytics.events_codec
)
GROUP BY partition;
┌─partition─┬─rows_legacy─┬─rows_migrated─┬─bytes_out_delta─┬─row_hash_match─┐
1. │ 202608 │ 9500000 │ 9500000 │ 0 │ 1 │
└───────────┴─────────────┴───────────────┴─────────────────┴────────────────┘Row counts, a business-metric delta and a summed row hash, per partition. The cutover criterion we recommend is that this query returns a match for every partition in scope on three consecutive days of dual writes, and that the shadow-read latency p95 is inside the target. Rollback is the mirror image: reads flip back to legacy, dual writes continue, nothing is deleted until the criterion holds again. The afternoon covers the two decisions that outlive the migration: team capability planning (which roles carry the on-call rotation, what the readiness sign-off looks like, hiring versus upskilling through the CHT ladder) and governance (GDPR erasure in an append-optimised engine, audit logging, SOC 2 and HIPAA control mapping).
What participants leave the ClickHouse workshop with
Every ChistaDATA University engagement ends with written artefacts, and this ClickHouse workshop is no exception. Participants leave with the reference topology annotated for their workload, the fit assessment with the “where ClickHouse loses” section filled in honestly, a storage and cost model built from their own compression ratios, a rollup decision record with the measured cost of each candidate view, the dual-write cutover plan with its parity query and rollback path, and a role-by-role ClickHouse training recommendation mapped onto CHT-100 through CHT-500. When the workshop is followed by a ClickHouse support or managed-services engagement, those documents become the first section of the support bench’s briefing pack.
| Format | Structure | Best for |
|---|---|---|
| On-site ClickHouse workshop | Three to five consecutive days, eight hours a day, taught against your own schema and data volumes under NDA | Teams starting a migration or hardening a new deployment, with the sponsoring executive in the room |
| Instructor-led virtual | Two live sessions a week, recorded, with office hours and a shared lab cluster per cohort | Distributed leadership and architecture teams across time zones |
| Executive briefing series (CHT-900) | A condensed 10-hour briefing series that runs alongside the engineering programs | CTOs and CXOs who need the decision-level view without the lab days |
| Embedded mentorship | A ChistaDATA principal engineer joins sprint ceremonies and code review for a fixed number of hours a week | Architects already in production who need design coaching rather than classroom time |
Contracting follows the same six stages as every other ChistaDATA University program: a discovery call, a skills assessment, a syllabus and statement of work, delivery, certification where applicable, and thirty days of aftercare lab access. The first two stages are free of charge and produce a written scope before any commitment. Cohort licensing with volume tiers, multi-year enterprise agreements and purchase-order friendly contracting are all available.
Key takeaways from the ClickHouse workshop
- A ClickHouse workshop for CTOs and data architects has to end in decisions, so every session is built around one: fit, cost, cutover, and capability.
- Fit is assessed honestly, including the workloads where ClickHouse loses to a transactional store or a managed warehouse; the recommendation can be “not this one.”
- Cost is measured, not quoted. Participants produce disk-per-billion-rows from
system.partson their own data; on the lab’s worst-case random data it was 26 GiB per billion rows at 28 bytes a row. - Rollups are a measured design choice. A counts-only
SummingMergeTreeview was 4.4 times faster than the raw scan; the same view carryinguniqandquantilestates was slower than no view at all. - Migration is dual-write with shadow-read, a written cutover criterion, and a parity query that compares row counts, a business metric and a row hash per partition.
- The workshop is the executive and architecture layer of ClickHouse education at ChistaDATA University; engineers continue into CHT-100 through CHT-500 ClickHouse training with a role-by-role recommendation.
ClickHouse workshop FAQ
Who should attend a ClickHouse workshop for CTOs and data architects?
The sponsoring executive (CTO, VP of engineering or data), the architect who will own the design, and the platform lead who will inherit the cluster. It is the decision-level layer of ChistaDATA University; operators and developers belong in the CHT-100 to CHT-400 ClickHouse training programs.
Does the ClickHouse workshop need prior ClickHouse experience?
No. The architecture material is taught from first principles at decision level. Architects who already run ClickHouse in production get more out of the rollup and migration days, and the free 45-minute skills assessment before the engagement tells us how to pitch each session.
Is the ClickHouse workshop delivered on our own data?
For corporate engagements, yes. Under NDA the sample datasets are replaced with your schemas, query patterns and latency targets, so the fit assessment, cost model and parity check are built on your platform rather than an example.
How does the workshop relate to ClickHouse certification and the CHT programs?
The workshop is the executive and architecture counterpart of the CHT-900 track and does not itself confer certification. It ends with a role-by-role recommendation into the CHT-100 through CHT-500 ClickHouse training ladder, where certification is earned through a proctored exam and a capstone defence on a live cluster.
The standing caveat applies to every command shown here: test on staging with your own workload before touching production, keep a verified backup and a rehearsed restore, and treat the DR replica as part of the estate you are designing. To scope a ClickHouse workshop for your leadership and architecture team, request a ClickHouse training proposal or call (844) 395-5717; the discovery call and skills assessment carry no charge.
Sources: ChistaDATA University programs, ClickHouse Kafka table engine, AggregatingMergeTree, SummingMergeTree, max_bytes_before_external_group_by. Lab: ClickHouse 26.8.2.7 LTS, 2 vCPU / 7 GB, 40 million synthetic rows, single node.
Running ClickHouse in production? ChistaDATA provides ClickHouse consulting for architecture, performance and migrations, and 24×7 ClickHouse support with a 15-minute S1 response. For day-to-day operations see ClickHouse DBA services and ClickHouse managed services.
