ChistaDATA · ClickHouse schema engineering · ClickHouse 26.9 · October 2026
A logs table that answers in 4 ms at a few gigabytes can quietly turn into one that reads every granule it owns. Nothing about the table changed; the data grew past the point where a careless sort key, a trace id hidden in a string, or a rollup keyed on pod name stops being free. ClickHouse observability at scale is mostly the discipline of making those decisions before the volume forces them.
We built a 20-million-record OpenTelemetry-style log store on ClickHouse 26.9, then measured seven modelling mistakes we keep finding in production telemetry platforms: sort keys, unshaped attributes, insert shape, materialized views, label cardinality, retention tiers and attribute drift. Every number below comes from our own lab, every query is one we ran, and every fix comes with what it cost.
Why telemetry is different
What breaks first in ClickHouse observability at scale
Telemetry is a peculiar workload, and ClickHouse observability at scale fails in its own ways. Volume grows on three axes at once: more teams ship services, each service emits more signals, and each signal carries more attributes. None of those growth curves is under the database team’s control. Meanwhile the readers want the same experience they had at a tenth of the volume: dashboards that load instantly, trace lookups in seconds, alerts that do not lag.
Three forces pull against each other in every design choice: storage and compute cost, query latency, and the experience of whoever is asking the question, which increasingly includes automated agents as well as engineers. Optimise one and the other two move. A raw table with no rollups is cheap to write and expensive to read. A dozen materialized views make dashboards fast and inserts slow. The job is to find the balance for your access patterns and then hold it as the data grows.
The second lesson is that an OpenTelemetry ClickHouse stack is a pipeline, not a database. Most of the failures we are called in for start upstream of the table: in how the SDKs name things, in how often collectors flush, in what the gateway forwards. Figure 1 is the map we use to decide where each fix belongs.
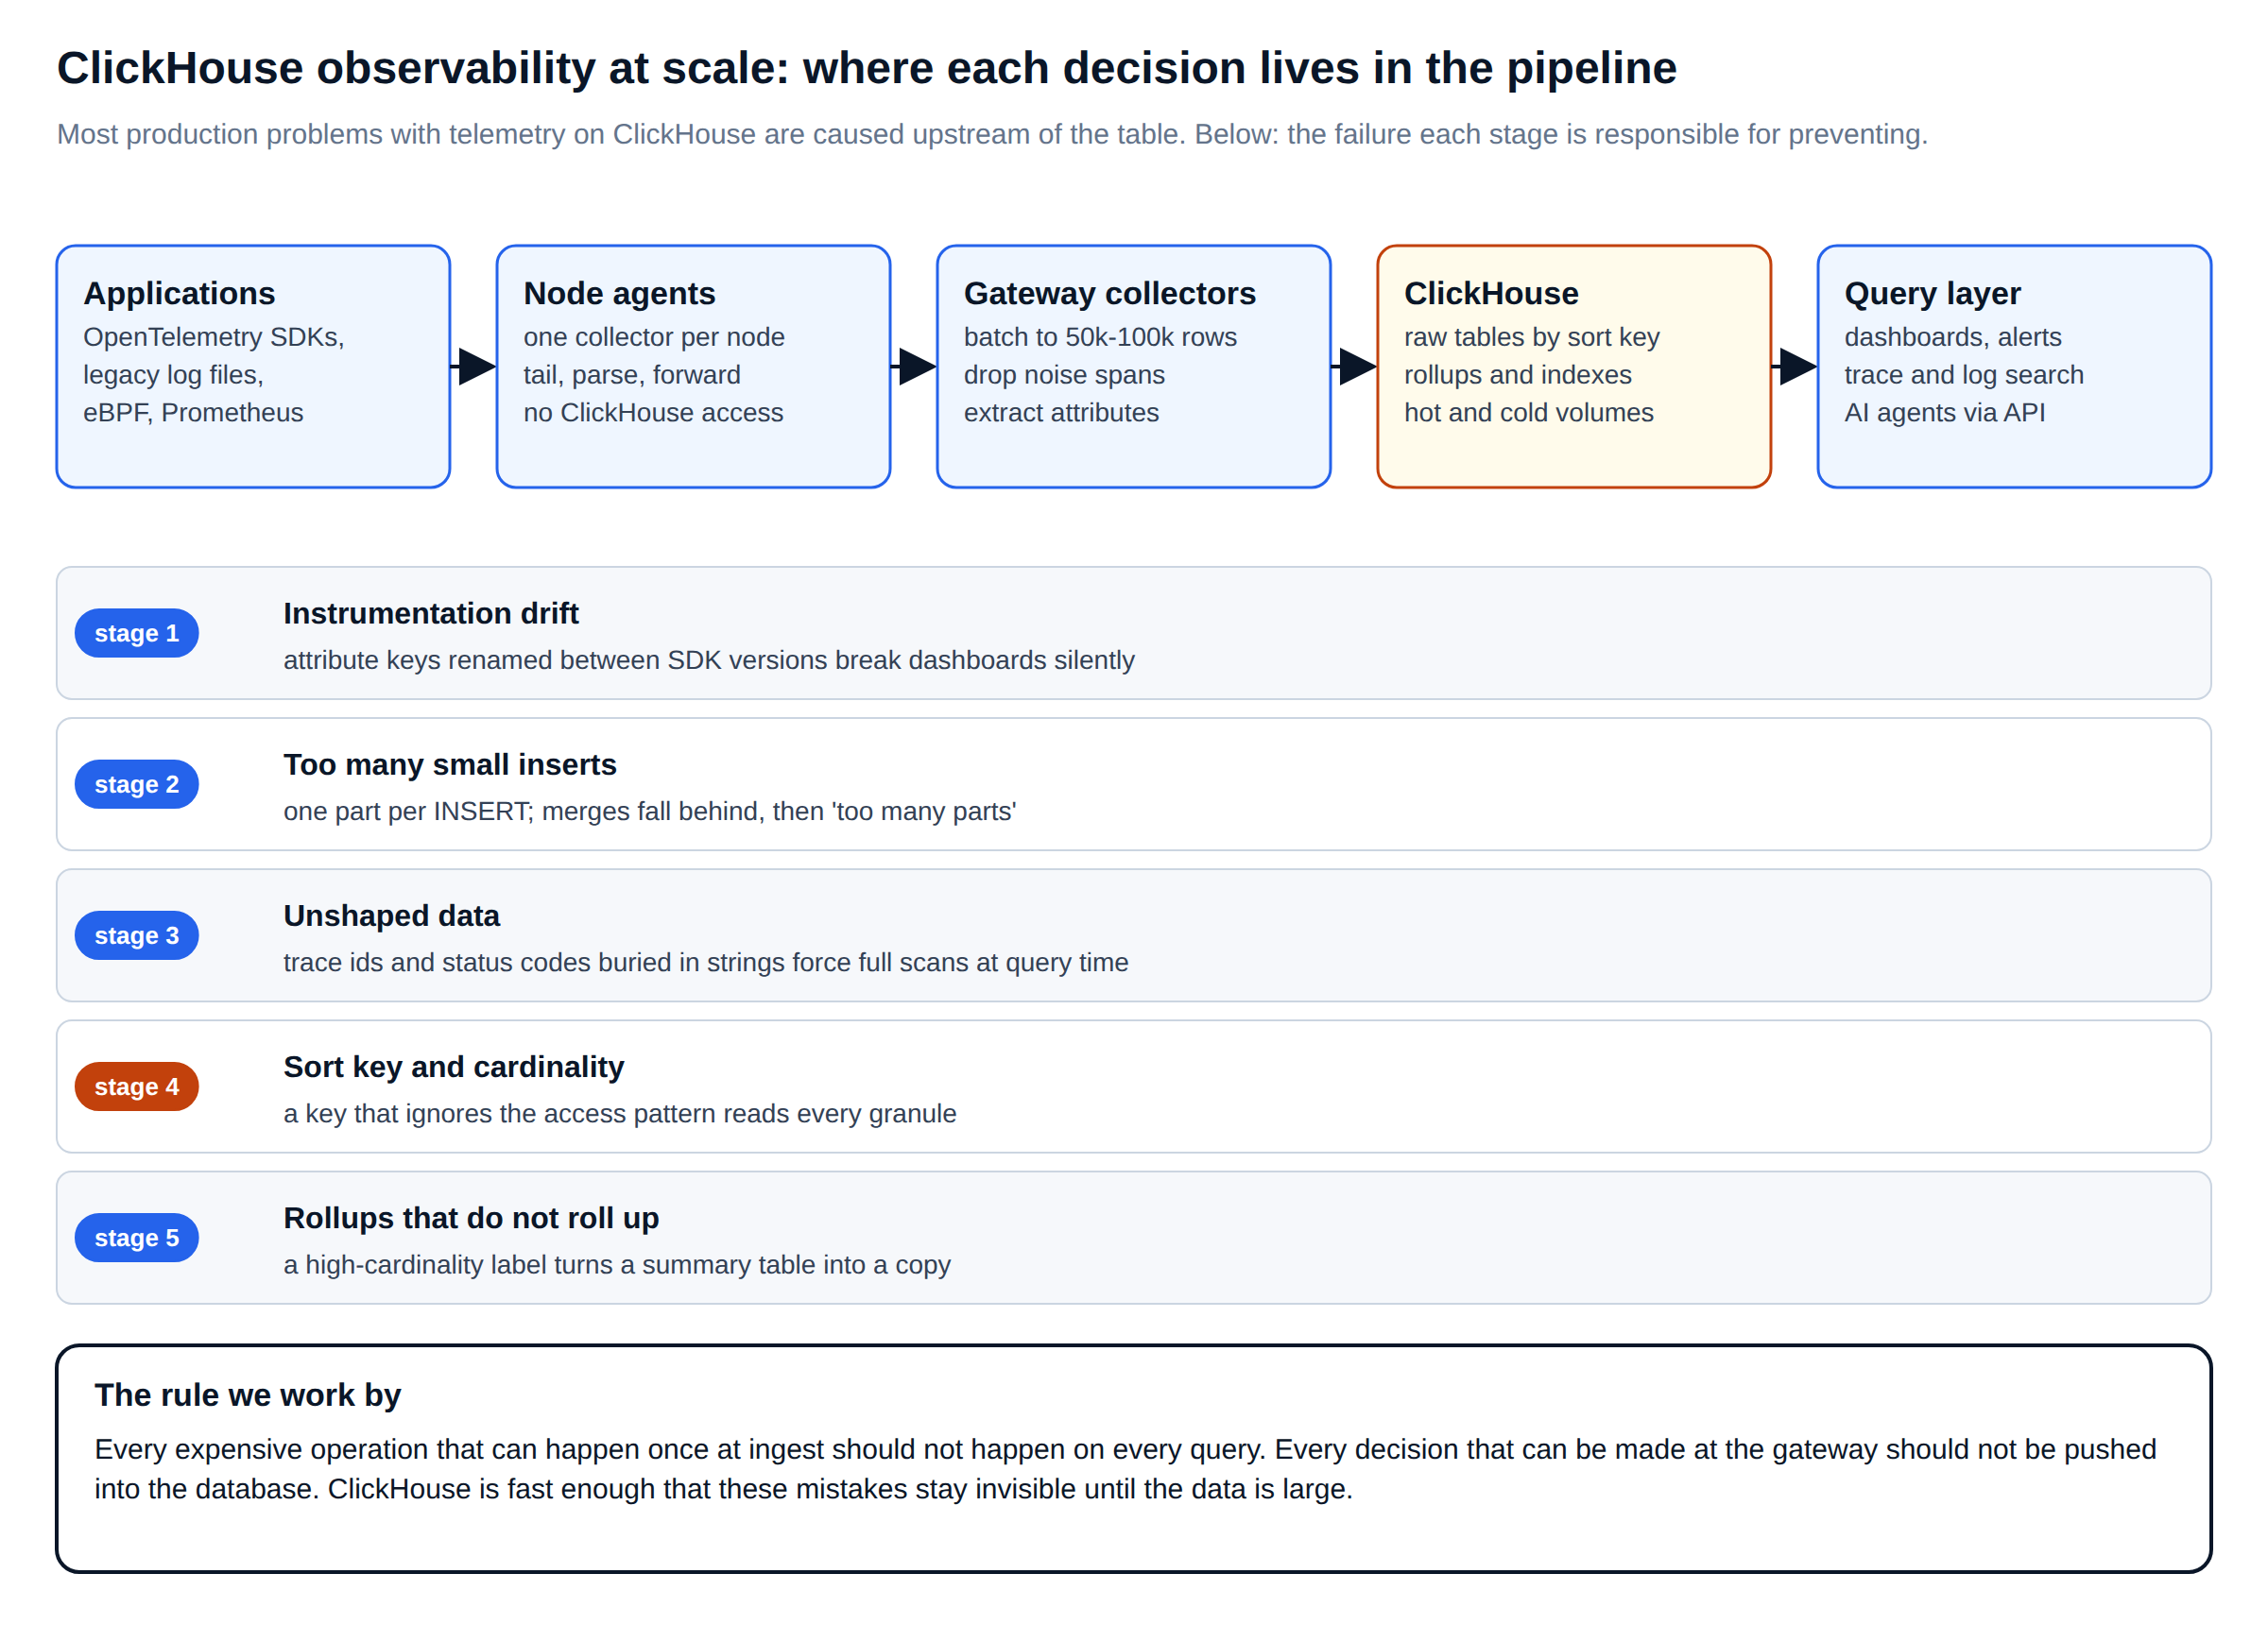
The lab behind every measurement: ClickHouse 26.9.2.8 on a 2 vCPU node, 20 million synthetic log records spread over 48 hours from 24 services, with OpenTelemetry-shaped columns (Timestamp, TraceId, ServiceName, SeverityText, Body and two attribute maps). Seven of the 24 services behave like legacy code: no trace context, and their useful identifiers exist only inside the message text. Query timings are medians of three runs with the query condition cache off; granule and byte counts are exact.
Mistake 1
One sort key for every question: the ClickHouse logs schema trap at scale
The ORDER BY of a MergeTree table decides which granules the primary index can skip, and in a ClickHouse logs schema it is the single most consequential line. We loaded the same 20 million records into three tables that differ only in that line, then ran the three query shapes that make up most observability traffic: one service’s errors in the last hour, everything in the last 15 minutes, and every line of one trace.
-- ClickHouse logs schema: one column set, three sort orders (only ORDER BY differs)
CREATE TABLE obs.logs_by_time
(
    Timestamp           DateTime64(9, 'UTC') CODEC(Delta(8), ZSTD(1)),  -- delta first: timestamps are nearly sequential
    TraceId             String CODEC(ZSTD(1)),
    SpanId              String CODEC(ZSTD(1)),
    SeverityText        LowCardinality(String),                          -- a handful of values: dictionary-encode
    ServiceName         LowCardinality(String),
    Body                String CODEC(ZSTD(1)),
    ResourceAttributes  Map(LowCardinality(String), String) CODEC(ZSTD(1)),
    LogAttributes       Map(LowCardinality(String), String) CODEC(ZSTD(1))
)
ENGINE = MergeTree
PARTITION BY toDate(Timestamp)          -- one partition per day keeps TTL drops cheap
ORDER BY (Timestamp)                    -- variant A: time first
SETTINGS index_granularity = 8192;

CREATE TABLE obs.logs_by_trace AS obs.logs_by_time
ENGINE = MergeTree PARTITION BY toDate(Timestamp)
ORDER BY (TraceId, Timestamp);          -- variant B: trace first

CREATE TABLE obs.logs_by_service AS obs.logs_by_time
ENGINE = MergeTree PARTITION BY toDate(Timestamp)
ORDER BY (ServiceName, SeverityText, Timestamp);   -- variant C: service, then severity, then time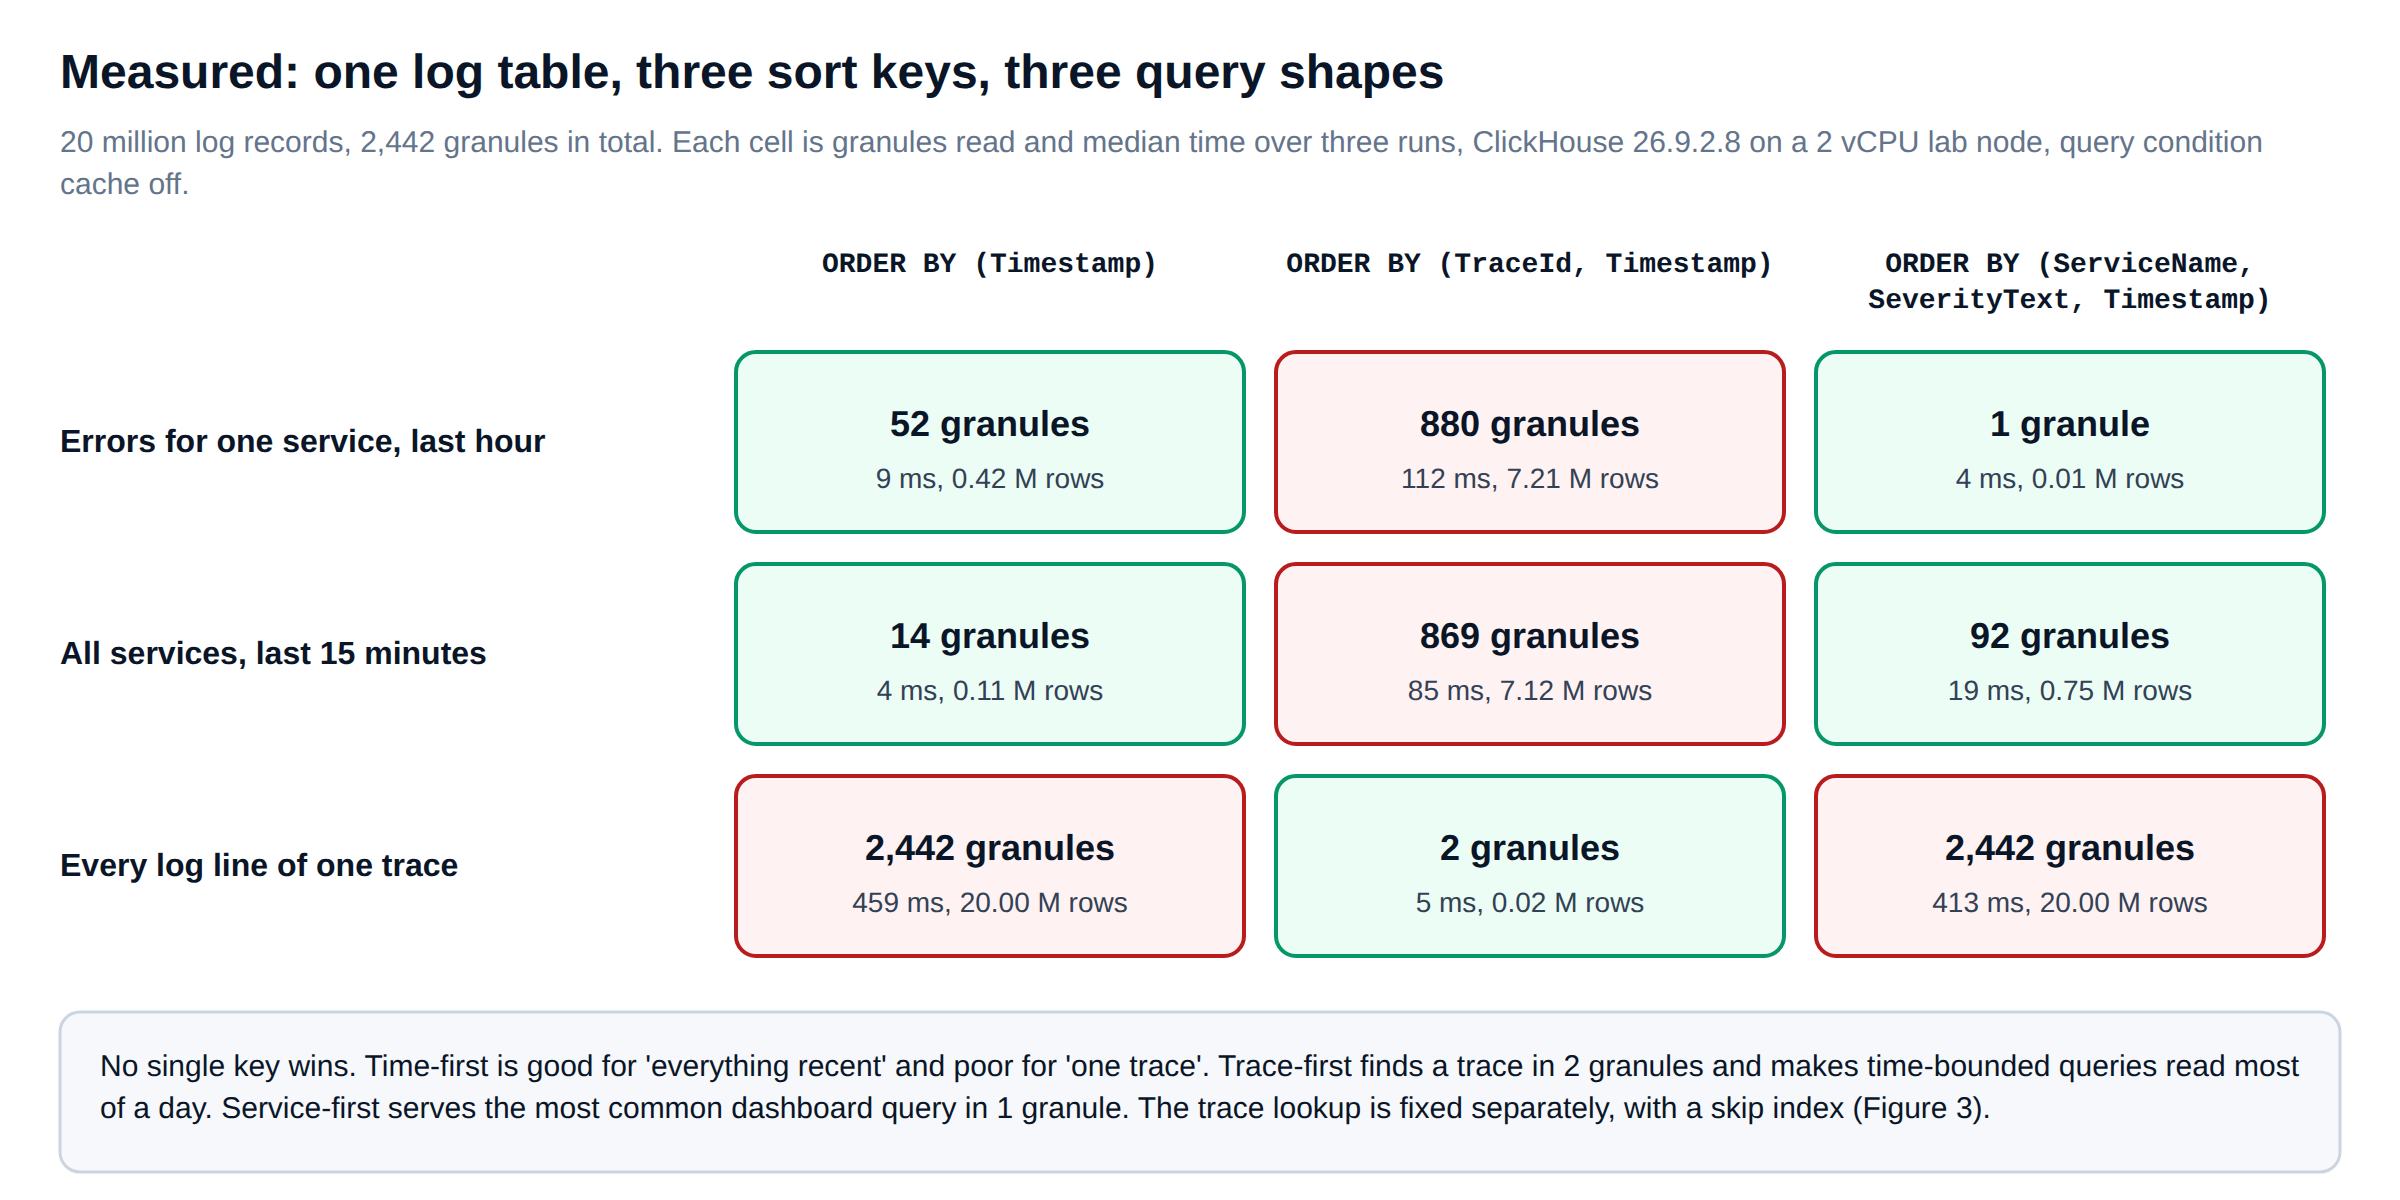
No key won everything. Time-first was excellent for “everything recent” (14 granules) and read the entire table for one trace. Trace-first found a trace in 2 granules, and in exchange every time-bounded query read most of a day. Service-first answered “errors for payments in the last hour” from a single granule in 4 ms, because the predicate matches the first three columns of the key exactly.
Our default for application logs is the service-first key, because the most frequent questions are scoped to a service and a severity. The trace lookup it is bad at is fixed separately, with a skip index, which is the next mistake. The way to confirm a key choice before you commit data to it is EXPLAIN indexes = 1 on your real query shapes:
-- ClickHouse observability at scale check: does the primary key prune for this query?
EXPLAIN indexes = 1
SELECT count()
FROM obs.logs_by_service
WHERE ServiceName = 'payments'
  AND SeverityText = 'ERROR'
  AND Timestamp >= '2026-10-08 23:00:00';
-- Min-Max     Granules: 1221/2442   (the day partition is chosen first)
-- Partition   Granules: 1221/1221
-- PrimaryKey  Granules: 1/1221      <- the number to look at
Mistake 2
ClickHouse logs schema mistake: leaving structure inside strings and maps
OpenTelemetry ClickHouse schemas keep attributes in Map columns, which is the right default: the set of keys is open and changes with every deploy. The cost shows up when a dashboard filters on the same key thousands of times a day. A map lookup has to read the whole map column for every candidate row, and nothing in the primary key or the skip indexes knows about the key inside it. Free text is worse. When the only place an identifier exists is the log message, every lookup is a substring scan over the largest column in the table.
The fix is to do the expensive work once, at insert time, instead of on every query. We built a shaped copy of the service-first table: two attributes promoted to typed columns with MATERIALIZED expressions, a bloom filter on TraceId and a set index on the status code. A second pair of tables did the same for the legacy services, whose order ids exist only inside the message text.
-- OpenTelemetry ClickHouse shaping at ingest: same rows, structure promoted once at insert time
CREATE TABLE obs.logs_shaped
(
    Timestamp           DateTime64(9, 'UTC') CODEC(Delta(8), ZSTD(1)),
    TraceId             String CODEC(ZSTD(1)),
    SpanId              String CODEC(ZSTD(1)),
    SeverityText        LowCardinality(String),
    ServiceName         LowCardinality(String),
    Body                String CODEC(ZSTD(1)),
    ResourceAttributes  Map(LowCardinality(String), String) CODEC(ZSTD(1)),
    LogAttributes       Map(LowCardinality(String), String) CODEC(ZSTD(1)),

    -- computed on INSERT, stored as real columns, invisible to SELECT *
    HttpStatus  UInt16                 MATERIALIZED toUInt16OrZero(LogAttributes['http.status_code']),
    PodName     LowCardinality(String) MATERIALIZED ResourceAttributes['k8s.pod.name'],

    -- skip indexes for the lookups the sort key cannot serve
    INDEX idx_trace  TraceId    TYPE bloom_filter(0.01) GRANULARITY 1,   -- point lookups by trace
    INDEX idx_status HttpStatus TYPE set(16)            GRANULARITY 4    -- few distinct values per block
)
ENGINE = MergeTree
PARTITION BY toDate(Timestamp)
ORDER BY (ServiceName, SeverityText, Timestamp);

-- ClickHouse logs schema for legacy services: the order id lives only in the message, so extract it once
ALTER TABLE obs.legacy_shaped
    ADD COLUMN IF NOT EXISTS OrderId UInt64
        MATERIALIZED toUInt64OrZero(extract(Body, 'order_id=(\\d+)'));
ALTER TABLE obs.legacy_shaped
    ADD INDEX IF NOT EXISTS idx_order OrderId TYPE bloom_filter(0.01) GRANULARITY 1;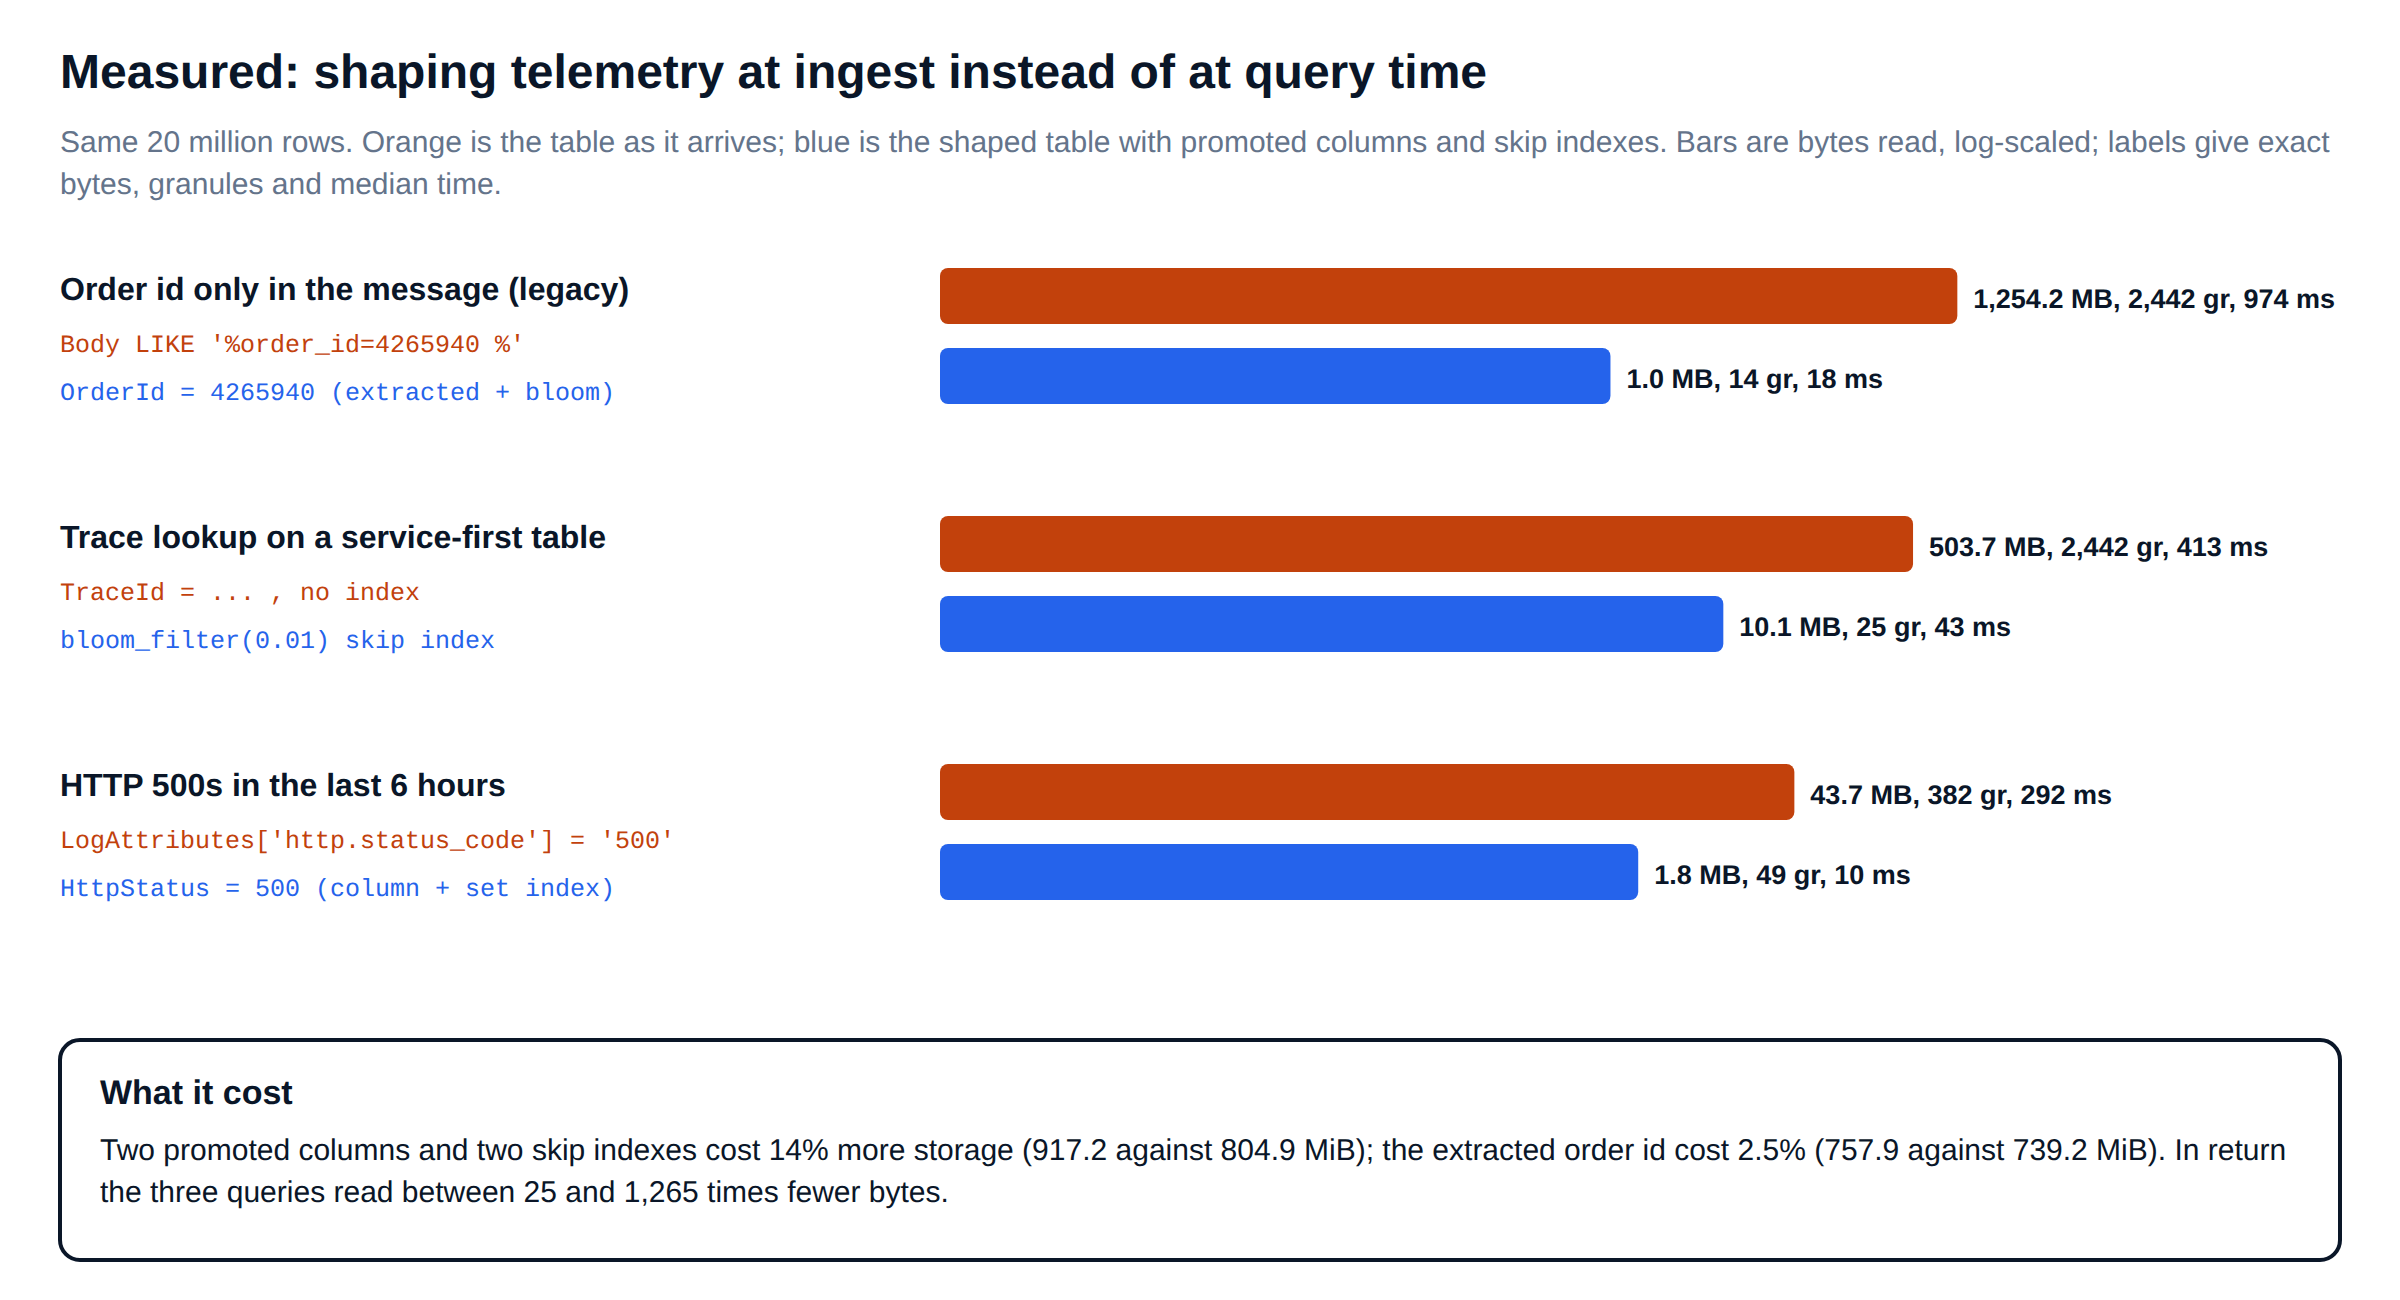
Finding one order in the legacy services’ logs meant a LIKE over every message: 1,254.2 MB, all 2,442 granules and 974 ms. With the order id extracted into a column at insert time, the same lookup read 1.0 MB from 14 granules in 18 ms. The trace lookup on the service-first table went from all 2,442 granules and 413 ms to 25 granules and 43 ms, purely from the bloom filter. Filtering HTTP 500s over six hours went from 43.7 MB read through the map to 1.8 MB through the promoted column and its set index.
It was not free. The shaped table is 917.2 MiB compressed against 804.9 MiB for the same rows without the extra columns and indexes, 14% more storage, and it took 85.1 s to load against 82.0 s. The extracted order id was cheaper: 757.9 MiB against 739.2 MiB, 2.5%. Promote the handful of keys that dashboards and alerts filter on every minute. Leave the long tail in the map, where it costs nothing until someone asks.
A new MATERIALIZED column only applies to rows written after the ALTER. Backfill older parts with ALTER TABLE ... MATERIALIZE COLUMN and MATERIALIZE INDEX one partition at a time, during low traffic, and watch system.mutations until each finishes: it rewrites the parts it touches.
Mistake 3
OpenTelemetry ClickHouse ingestion: inserting at the rate the SDK emits
Every synchronous INSERT into a MergeTree table creates at least one new part on disk, and background merges then combine them. Telemetry clients like to send small and often. We sent 2,400 log records three ways and counted parts in system.part_log.
-- ClickHouse log storage health: how many parts did inserts create, and how much merging followed?
SELECT
    event_type,
    count()                               AS events,
    sum(rows)                             AS rows,
    round(avg(duration_ms), 1)            AS avg_ms
FROM system.part_log
WHERE database = 'obs'
  AND table = 'ingest'
  AND event_time >= now() - INTERVAL 10 MINUTE
GROUP BY event_type
ORDER BY events DESC;
One row per synchronous INSERT, from 16 concurrent clients, produced exactly 2,400 parts and 355 merges for 2,400 rows. On ClickHouse 26.9 asynchronous inserts are on by default, and with them the server buffered the same traffic into 193 parts and 38 merges, 12 times fewer. The trade showed up on the client: each sender waited for its buffer to flush, so per-client throughput fell from 320 to 83 rows per second.
The fix that beats both is to batch before the database. Twenty-four INSERTs of 100,000 rows wrote 2.4 million rows in 11.5 seconds, 208,033 rows per second, about 650 times the single-row rate, and created 24 parts. In a telemetry pipeline that batching belongs in a gateway tier of collectors, not in every node agent. A node agent per host connecting straight to ClickHouse multiplies the number of writers and shrinks every batch.
# OpenTelemetry ClickHouse gateway collector, export side only: batch hard before ClickHouse.
# Not executed in our lab; check component and option names against your collector version.
processors:
  batch:
    send_batch_size: 50000        # flush when this many records are queued
    send_batch_max_size: 100000   # never send more than this in one request
    timeout: 5s                   # or after 5 s, whichever comes first
exporters:
  clickhouse:
    endpoint: tcp://${CH_HOST}:9000
    username: ${CH_USER}
    password: ${CH_PASSWORD}
    database: otel
    retry_on_failure:
      enabled: true               # retries resend the same batch
service:
  pipelines:
    logs:
      receivers: [otlp]
      processors: [batch]
      exporters: [clickhouse]
On the server side, keep asynchronous inserts as the safety net for the clients you cannot batch. These are the settings that decide how it behaves; the values are the 26.9 defaults we measured with. Details are in the ClickHouse documentation on asynchronous inserts.
-- ClickHouse log storage: asynchronous insert settings in effect (26.9 defaults)
SELECT name, value
FROM system.settings
WHERE name IN ('async_insert', 'wait_for_async_insert',
               'async_insert_busy_timeout_min_ms', 'async_insert_busy_timeout_max_ms',
               'async_insert_max_data_size', 'async_insert_use_adaptive_busy_timeout');
-- async_insert                            1
-- wait_for_async_insert                   1          -- client waits until its rows are flushed
-- async_insert_busy_timeout_min_ms        50
-- async_insert_busy_timeout_max_ms        200
-- async_insert_max_data_size              10485760   -- or flush when 10 MiB is buffered
-- async_insert_use_adaptive_busy_timeout  1
Mistake 4
ClickHouse observability at scale on the write path: materialized views are not free
An incremental materialized view runs on every INSERT into its source table, inside the same insert, and writes its own parts. That is what makes it fast to read and what makes it a cost on the write path. We sent 2.4 million records in 24 batches of 100,000 into a table with zero, one, two and three views attached.
-- ClickHouse observability at scale, rollup 1: errors per service per minute (24 services: aggregates well)
CREATE TABLE obs.errors_per_min
(
    minute       DateTime,
    ServiceName  LowCardinality(String),
    errors       UInt64
)
ENGINE = SummingMergeTree
ORDER BY (ServiceName, minute);

CREATE MATERIALIZED VIEW obs.mv_errors_per_min TO obs.errors_per_min AS
SELECT toStartOfMinute(Timestamp) AS minute, ServiceName, count() AS errors
FROM obs.mv_base
WHERE SeverityText = 'ERROR'
GROUP BY minute, ServiceName;

-- ClickHouse high cardinality warning, rollup 2: requests per pod and status per minute (thousands of pods: aggregates badly)
CREATE TABLE obs.pod_status_per_min
(
    minute    DateTime,
    PodName   LowCardinality(String),
    status    UInt16,
    requests  UInt64
)
ENGINE = SummingMergeTree
ORDER BY (PodName, status, minute);

CREATE MATERIALIZED VIEW obs.mv_pod_status_per_min TO obs.pod_status_per_min AS
SELECT toStartOfMinute(Timestamp)                        AS minute,
       ResourceAttributes['k8s.pod.name']                AS PodName,
       toUInt16OrZero(LogAttributes['http.status_code']) AS status,
       count()                                           AS requests
FROM obs.mv_base
GROUP BY minute, PodName, status;

-- ClickHouse log storage index, rollup 3: one row per trace id (grows with traffic)
CREATE TABLE obs.trace_index
(
    TraceId   String,
    first_ts  SimpleAggregateFunction(min, DateTime64(9, 'UTC')),
    last_ts   SimpleAggregateFunction(max, DateTime64(9, 'UTC')),
    services  AggregateFunction(groupUniqArray, LowCardinality(String))
)
ENGINE = AggregatingMergeTree
ORDER BY TraceId;

CREATE MATERIALIZED VIEW obs.mv_trace_index TO obs.trace_index AS
SELECT TraceId, min(Timestamp) AS first_ts, max(Timestamp) AS last_ts,
       groupUniqArrayState(ServiceName) AS services
FROM obs.mv_base
WHERE TraceId != ''
GROUP BY TraceId;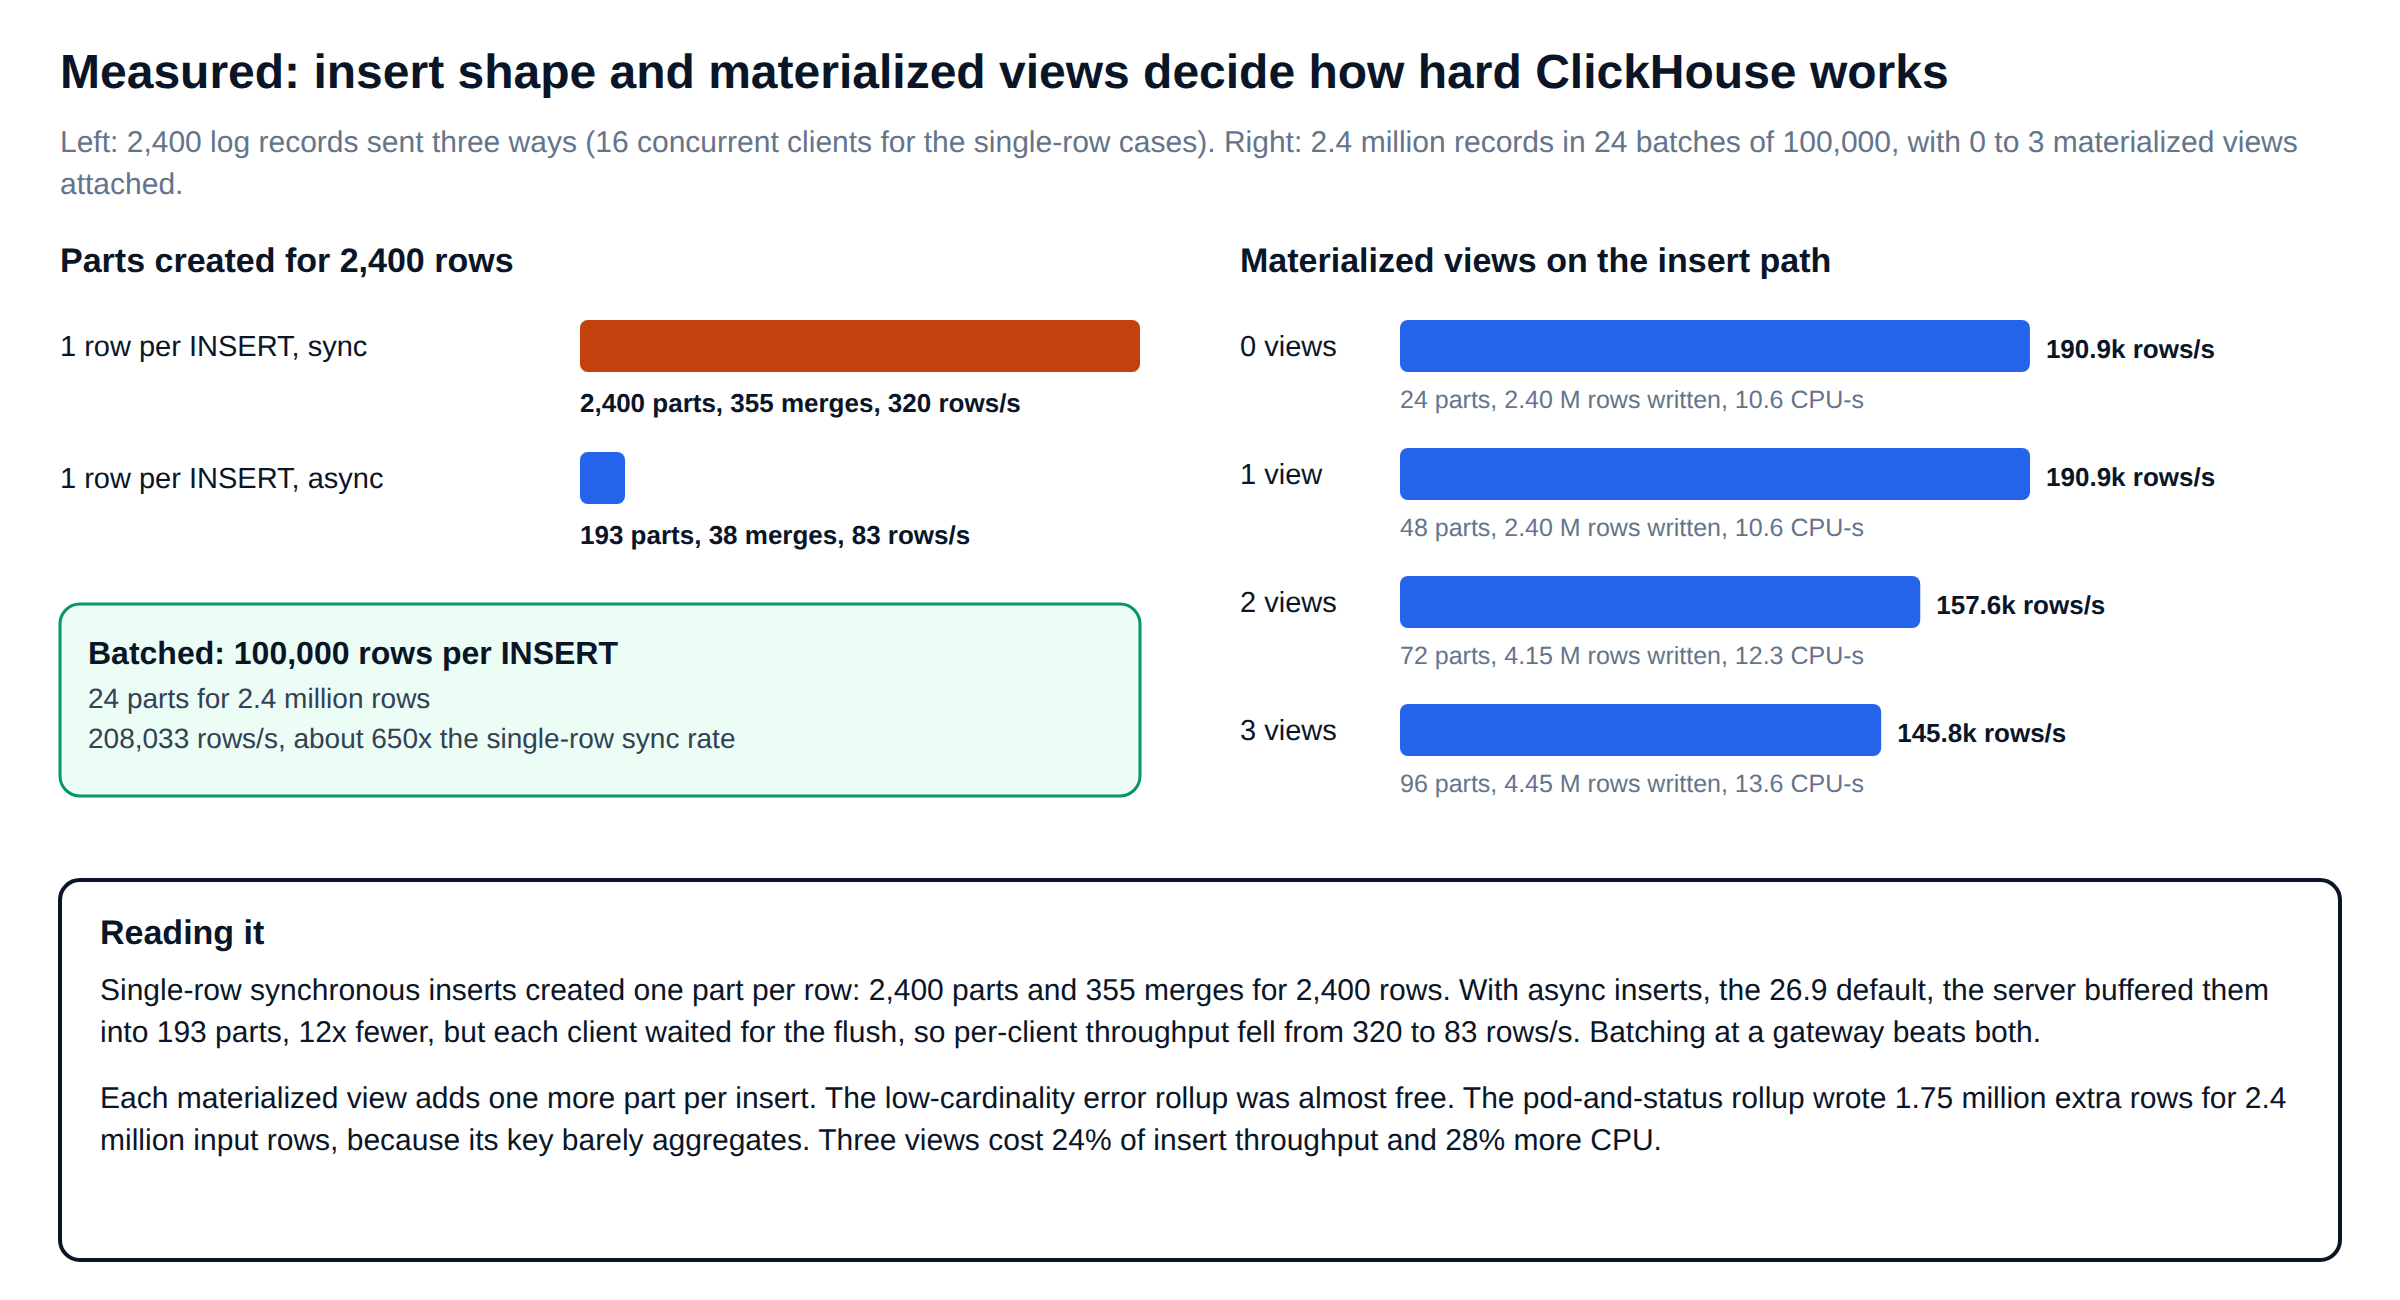
The error rollup was effectively free: throughput stayed at 190.9 thousand rows per second and the view added 4,896 rows. The pod-and-status rollup was not. It wrote 1.75 million rows for 2.4 million input rows, because its grouping key barely groups anything inside a 100,000-row block. With all three views, throughput fell 24% to 145.8 thousand rows per second, insert CPU rose 28%, and four parts were created per INSERT instead of one, each of them a future merge.
Before adding a view, estimate its reduction ratio: rows in the target per block divided by rows in the block. A view that keeps more than a few percent of its input is a second copy of the table with extra steps. Some of those rollups are cheaper to compute in the gateway, where they never touch the merge pipeline. The ClickHouse guide to incremental materialized views covers the mechanics.
Mistake 5
ClickHouse high cardinality hiding in rollup keys
ClickHouse high cardinality is not a problem in a raw table with a sensible sort key: a column with millions of distinct values compresses and scans like any other. It becomes a problem in a rollup, where every distinct combination of the grouping labels becomes a row. We counted how many rows a one-minute rollup of our 20 million records would keep, with three label sets.
-- ClickHouse high cardinality check for ClickHouse log storage rollups: rows a 1-minute rollup would keep for a given label set
SELECT
    'service, status'                                                    AS labels,
    uniqExact(ServiceName, LogAttributes['http.status_code'])            AS series,
    (
        SELECT count()
        FROM
        (
            SELECT 1
            FROM obs.logs_by_service
            GROUP BY toStartOfMinute(Timestamp), ServiceName, LogAttributes['http.status_code']
        )
    )                                                                    AS rollup_rows
FROM obs.logs_by_service;
-- repeat with ResourceAttributes['k8s.pod.name'] and LogAttributes['user.id'] added to both lists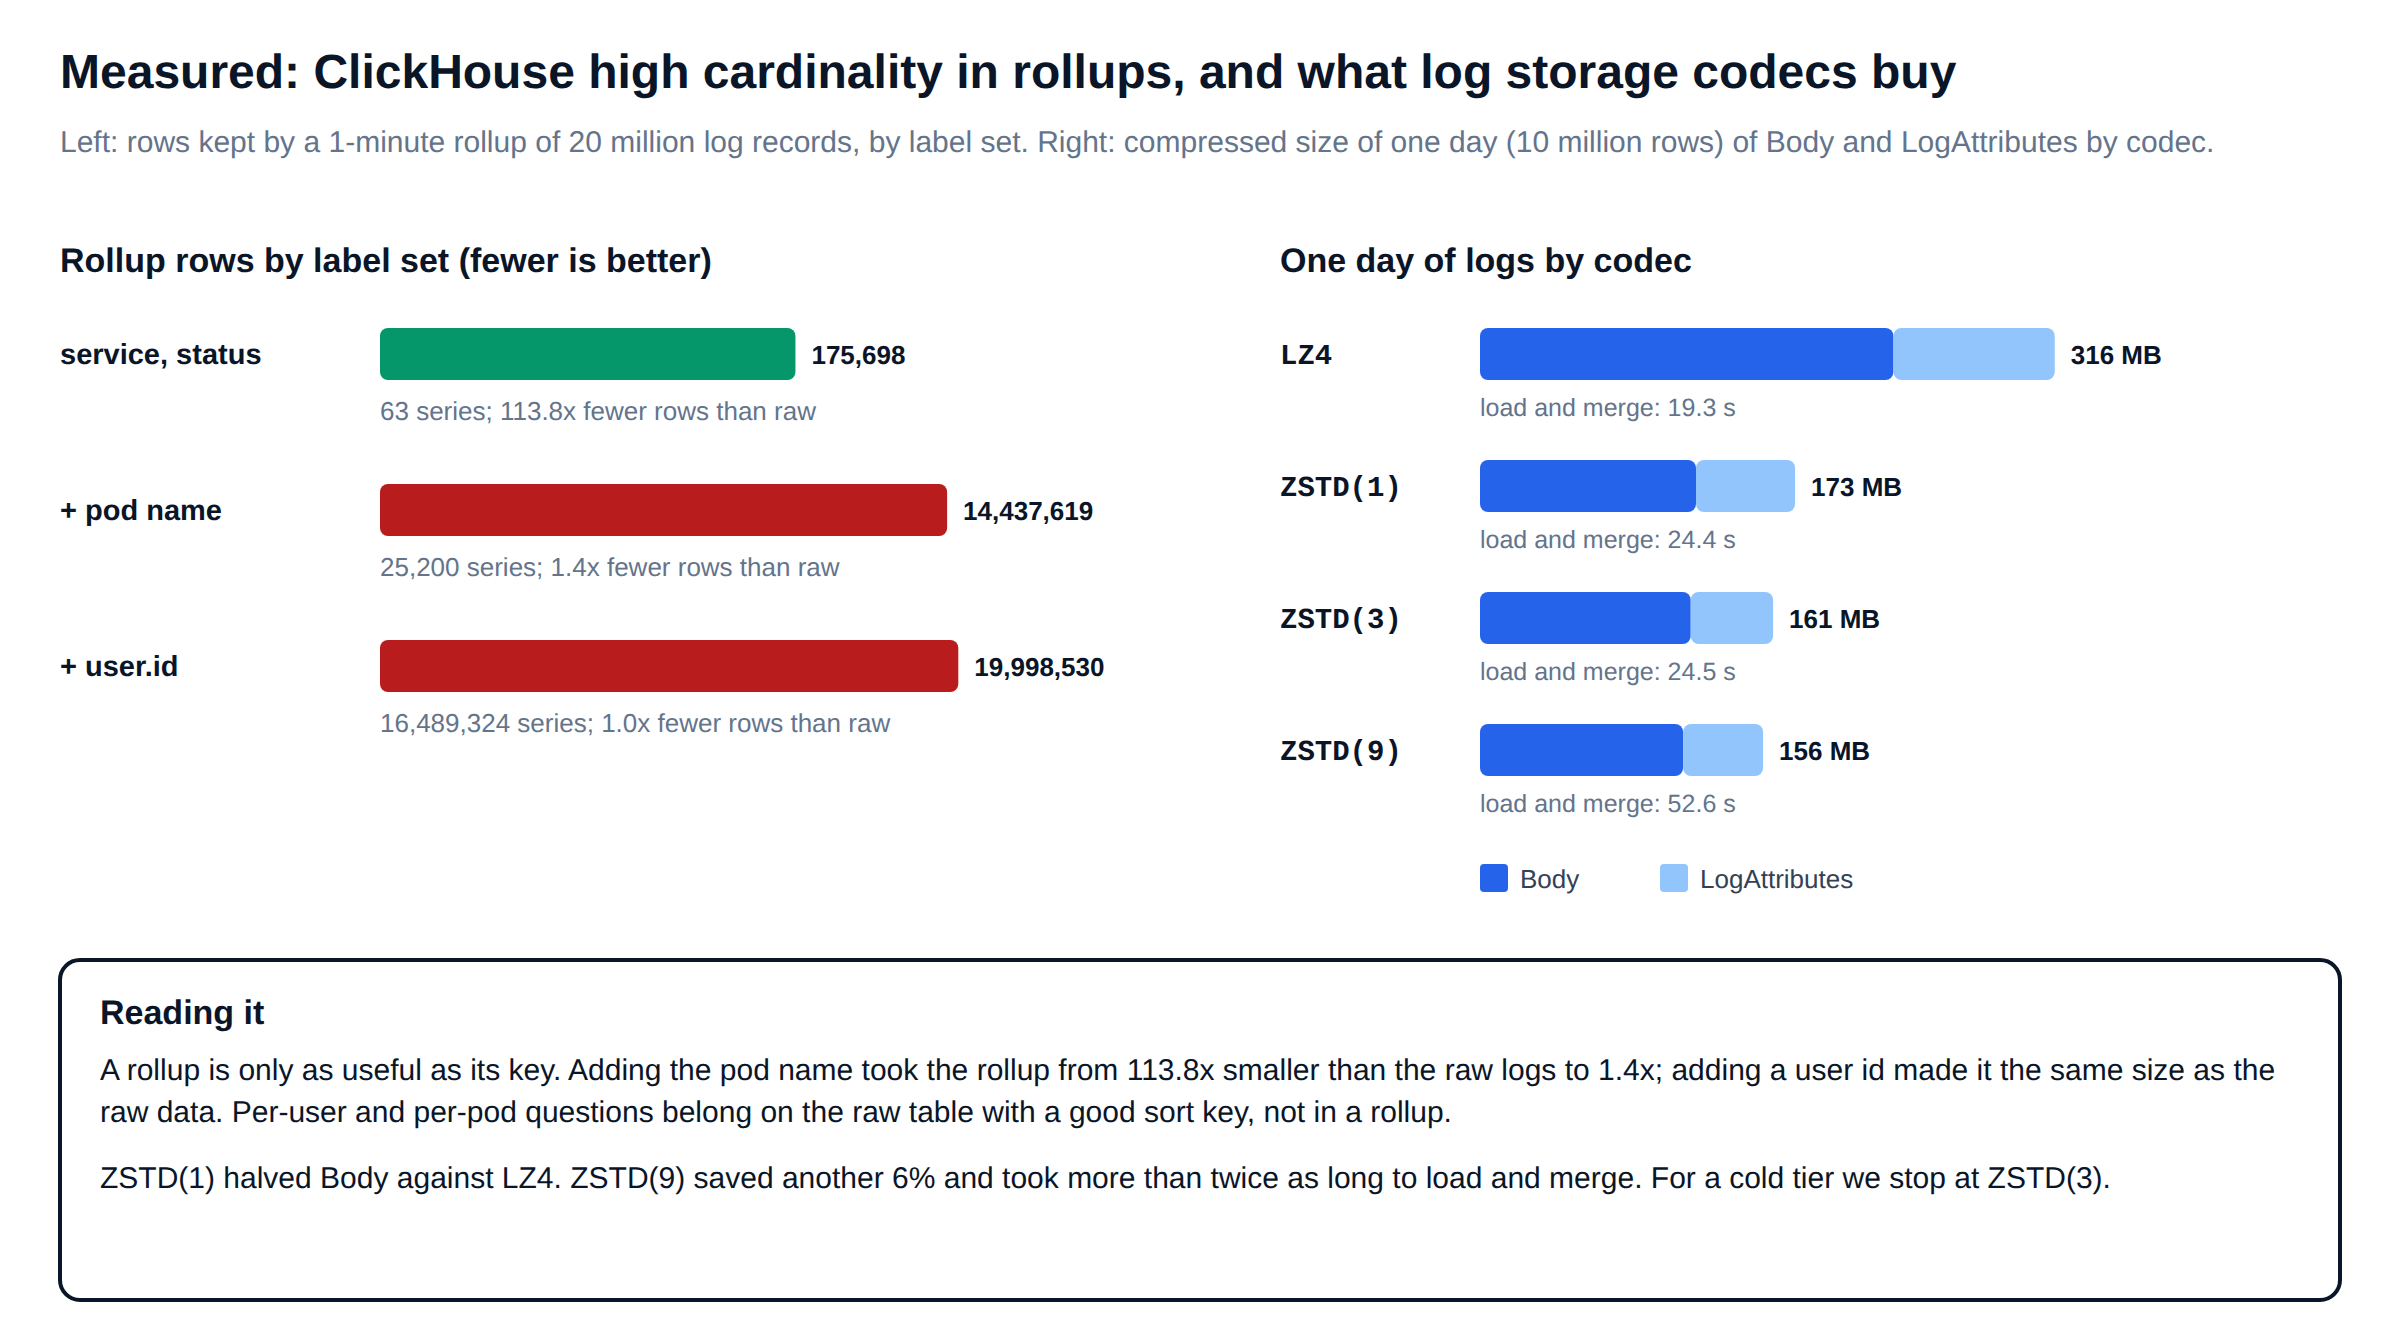
With service and status as the only labels, 63 series became 175,698 rollup rows, 113.8 times fewer than the raw data. Adding the pod name gave 25,200 series and 14.4 million rows, only 1.4 times fewer. Adding a user id gave 16.5 million series and a rollup the same size as the raw table.
Two rules come out of that. Questions about a specific pod, user or request belong on the raw table, answered through the sort key and skip indexes. Rollups should carry only the labels a dashboard groups by, and a new label should go into a rollup only after someone has counted its series. Run the ClickHouse high cardinality check above before every new dimension.
Mistake 6
One retention policy for all ClickHouse log storage
Telemetry loses value quickly, and ClickHouse log storage should follow that curve. The last hour is queried constantly, last week occasionally, last quarter almost never, and a single tier of fast storage for all of it is the expensive default. ClickHouse can move parts between volumes and delete them with table TTLs. We gave the lab a two-volume storage policy and a table that moves data to the cold volume after one day and deletes it after thirty.
<!-- config.d/storage.xml: ClickHouse log storage tiers, a hot volume on the default disk, a cold volume on a second disk -->
<clickhouse>
    <storage_configuration>
        <disks>
            <cold_disk>
                <type>local</type>
                <path>/var/lib/clickhouse-cold/</path>   <!-- larger, cheaper disk -->
            </cold_disk>
        </disks>
        <policies>
            <hot_cold>
                <volumes>
                    <hot><disk>default</disk></hot>
                    <cold><disk>cold_disk</disk></cold>
                </volumes>
                <move_factor>0.1</move_factor>   <!-- also move when hot has under 10% free -->
            </hot_cold>
        </policies>
    </storage_configuration>
</clickhouse>
-- ClickHouse log storage with retention tiers: hot for a day, cold until day 30, then gone
CREATE TABLE obs.logs_tiered
(
Timestamp DateTime64(9, 'UTC') CODEC(Delta(8), ZSTD(1)),
TraceId String CODEC(ZSTD(1)),
SpanId String CODEC(ZSTD(1)),
SeverityText LowCardinality(String),
ServiceName LowCardinality(String),
Body String CODEC(ZSTD(1)),
ResourceAttributes Map(LowCardinality(String), String) CODEC(ZSTD(1)),
LogAttributes Map(LowCardinality(String), String) CODEC(ZSTD(1))
)
ENGINE = MergeTree
PARTITION BY toDate(Timestamp)
ORDER BY (ServiceName, SeverityText, Timestamp)
TTL toDateTime(Timestamp) + INTERVAL 1 DAY TO VOLUME 'cold',
toDateTime(Timestamp) + INTERVAL 30 DAY DELETE
SETTINGS storage_policy = 'hot_cold',
ttl_only_drop_parts = 1; -- drop whole parts at expiry instead of rewriting them
-- ClickHouse log storage: where does each day live now?
SELECT partition, disk_name, count() AS parts, sum(rows) AS rows,
formatReadableSize(sum(bytes_on_disk)) AS size
FROM system.parts
WHERE database = 'obs' AND table = 'logs_tiered' AND active
GROUP BY partition, disk_name
ORDER BY partition;Twenty seconds after loading, both day partitions were on the cold volume.
Seven of the 40 new parts were written there directly, because their rows were already past the TTL at insert time. The other 33 were moved, the slowest move taking 70 ms. We loaded at 00:18 on 9 October, so even the newest rows of 8 October were not yet a full day old. Their whole partition still landed on the cold volume within those twenty seconds. Moves and deletes act on whole parts, not rows, so the partition key and part sizes decide how precise retention can be. Test the boundary behaviour on your own data before promising a tenant an exact hot window.
We also compared codecs for the cold tier on one day of data, 10 million rows. The right half of Figure 5 has the numbers: ZSTD(1) halved the message column against LZ4, from 227.4 MB to 118.8 MB. ZSTD(9) saved only another 6% and took more than twice as long to load and merge, 52.6 s against 24.4 s. Our cold tiers stop at ZSTD(3). The ClickHouse documentation on MergeTree TTL and storage policies covers the full syntax, including object storage disks.
Mistake 7
OpenTelemetry ClickHouse attribute drift: trusting names to stay stable
OpenTelemetry semantic conventions change, and SDKs adopt the changes on their own schedules. The HTTP status attribute is the best-known example: http.status_code became http.response.status_code. A fleet halfway through an SDK upgrade writes both keys, and every dashboard that filters on one of them silently loses half its data. Nothing errors; the numbers just drop.
The first defence is to know what is actually arriving. This census shows every attribute key written in the last hour, how often, and how many distinct values each has. The distinct count doubles as an early warning for a new high-cardinality key.
-- OpenTelemetry ClickHouse attribute census: which keys arrived in the last hour, and how varied are they?
SELECT
    arrayJoin(mapKeys(LogAttributes))       AS attr_key,
    count()                                 AS records,
    uniq(LogAttributes[attr_key])           AS distinct_values   -- a sudden jump here is a cardinality incident
FROM obs.logs_shaped
WHERE Timestamp >= now() - INTERVAL 1 HOUR
GROUP BY attr_key
ORDER BY records DESC;
The second defence is to normalise once, at the same place you promote columns, so queries never see both spellings.
-- OpenTelemetry ClickHouse attribute drift: normalise old and new semantic-convention keys into one column
ALTER TABLE obs.logs_shaped
    MODIFY COLUMN HttpStatus UInt16 MATERIALIZED toUInt16OrZero(
        coalesce(
            nullIf(LogAttributes['http.response.status_code'], ''),   -- current convention
            nullIf(LogAttributes['http.status_code'], '')             -- older SDKs
        ));
The same thinking applies to volume. Head sampling in a node agent cannot know whether a trace will turn out interesting, because it sees one span at a time. Dropping known noise at the gateway is often the better first cut: health checks, internal framework spans, debug logs from services that never read them. Removing noise keeps every trace whole, where sampling keeps some traces and loses others.
Shared platforms
Multi-tenant ClickHouse log storage on one cluster
A platform team serving many internal teams, or a vendor serving many customers, has to decide where tenants are separated. Separate clusters per tenant give the cleanest isolation of performance and data, and cost the most to run. A shared cluster is cheaper, and then isolation has to come from the database. In ClickHouse that means row policies for visibility and quotas for fairness, with every tenant reaching the data through a role rather than a shared account.
-- OpenTelemetry ClickHouse tenancy: one tenant's view of a shared ClickHouse logs schema: its rows only, and a bounded share of the cluster
CREATE ROLE IF NOT EXISTS tenant_payments;

CREATE ROW POLICY IF NOT EXISTS rp_payments ON obs.logs_shaped
    FOR SELECT USING ServiceName = 'payments'      -- in a real platform: a TenantId column in the sort key
    TO tenant_payments;

CREATE QUOTA IF NOT EXISTS q_tenant_payments
    FOR INTERVAL 1 hour MAX queries = 2000, read_bytes = 50000000000
    TO tenant_payments;

GRANT SELECT ON obs.logs_shaped TO tenant_payments;

CREATE USER IF NOT EXISTS payments_ro
    IDENTIFIED WITH sha256_password BY '${TENANT_PASSWORD}'
    DEFAULT ROLE tenant_payments;

-- Verified in the lab: as payments_ro, a GROUP BY ServiceName returns only 'payments' (833,151 rows)
Put the tenant column first in the sort key, so that a tenant’s queries prune to its own granules instead of filtering everyone’s. Quotas cap the damage a single runaway dashboard can do, but they do not stop one tenant’s ingestion spike from slowing everyone’s merges. When a tenant’s volume or its service levels justify it, giving that tenant its own storage is the honest answer. The ClickHouse reference for row policies lists the full syntax.
Honest notes
What this ClickHouse observability at scale lab does not prove
Our 20 million records were generated, not captured. Real log messages repeat far more than ours, so real compression ratios are usually better and the gaps between codecs different. Everything ran on one 2 vCPU node: no replication, no sharded Distributed table, no object-storage cold tier, no concurrent query load during ingestion. The gateway collector configuration in Mistake 3 was not executed in our lab.
Two results from this ClickHouse observability at scale lab surprised us and are worth repeating. Asynchronous inserts reduced parts 12-fold but made each single-row client four times slower, because every client waited for a flush; they protect the server, not the sender. And a high-cardinality materialized view cost more than the raw table it summarised. Neither shows up in a demo on a laptop. Both show up in production the week the traffic doubles.
Design review
The ClickHouse observability at scale checklist we use
| Area | Question we ask | How we check it |
|---|---|---|
| Sort key | Does the most frequent query prune to under 5% of granules? | EXPLAIN indexes = 1 on the top five query shapes |
| Point lookups | Do trace and id lookups avoid full scans? | Bloom filter skip indexes; SelectedMarks in system.query_log |
| Shaping | Is anything a dashboard filters on still inside a map or a string? | Attribute census; promoted MATERIALIZED columns |
| Insert shape | How many parts per minute does ingestion create? | NewPart rate in system.part_log; gateway batch sizes |
| Materialized views | What fraction of input rows does each view keep? | Rows written per INSERT in system.query_log |
| Rollup labels | How many series would a new label create? | The series-count query in Mistake 5 |
| Retention | Are hot, cold and delete windows set per table, and on part boundaries? | system.parts by disk; MovePart events |
| Attribute drift | Do dashboards survive the next SDK upgrade? | Normalised promoted columns; weekly census diff |
| Tenancy | Can one tenant read or starve another? | Row policies, quotas, tenant id first in the sort key |
Test every ClickHouse logs schema change in this post on a copy of your own telemetry before applying it to production, and keep backups and a rollback for every ALTER. A sort key cannot be changed in place: it means a new table and a backfill.
FAQ
ClickHouse observability at scale: common questions
What is the best ORDER BY for an OpenTelemetry ClickHouse logs schema?
The one that matches your most frequent queries. In our lab, (ServiceName, SeverityText, Timestamp) answered “errors for one service in the last hour” from 1 granule out of 2,442. A time-first key read 52 granules for the same question. Add bloom filter skip indexes for trace and id lookups instead of putting them in the sort key.
How do I handle ClickHouse high cardinality?
ClickHouse high cardinality is cheap in the right place. Keep high-cardinality values such as pod names, user ids and request ids in the raw table, where they cost little, and query them through skip indexes. Keep them out of rollup keys: one such label took our rollup from 113.8 times smaller than the raw data to the same size.
Should I use async inserts for ClickHouse log storage ingestion?
Use them as a safety net; they are on by default in 26.9. They cut parts 12-fold in our test but slowed each single-row client fourfold. Batching tens of thousands of rows in a gateway collector is better: 208,033 rows per second against 320.
Do materialized views slow down ClickHouse inserts?
Every view runs inside the insert. A low-cardinality error rollup cost nothing measurable. Three views together, one of them high-cardinality, cut throughput by 24% and added 28% CPU.
How should ClickHouse log storage be tiered?
Use a storage policy with hot and cold volumes and table TTLs: TO VOLUME 'cold' after the window people query daily, then DELETE. Moves and deletes act on whole parts, so partition by day and use ttl_only_drop_parts.
Further reading
Related ChistaDATA guides and sources
From our blog: ClickHouse performance observability on 26.9, which uses the system tables referenced here, and ClickHouse high availability on 26.9, for running the same telemetry store across replicas.
ClickHouse documentation: asynchronous inserts, data skipping indexes, incremental materialized views, MergeTree, TTL and storage policies and row policies.
Measurements: ChistaDATA lab, one 2 vCPU node, ClickHouse 26.9.2.8, 20,000,000 synthetic OpenTelemetry-style log records over 48 hours from 24 services, October 2026. Query times are medians of three runs with the query condition cache off; granule and byte counts are from system.query_log. Results on real telemetry will differ.
ChistaDATA
Running telemetry on ClickHouse, or about to?
ChistaDATA engineers design and operate ClickHouse observability at scale on 100% open-source ClickHouse. That includes logs, metrics and traces schemas, sort-key and skip-index reviews, ingestion and gateway batching, rollup and retention design, multi-tenant isolation, and 24×7×365 support with a 15-minute Severity 1 response.
Book a ClickHouse schema review Managed ClickHouse operations
Running ClickHouse in production? ChistaDATA provides ClickHouse consulting for architecture, performance and migrations, and 24×7 ClickHouse support with a 15-minute S1 response. For day-to-day operations see ClickHouse DBA services and ClickHouse managed services.
