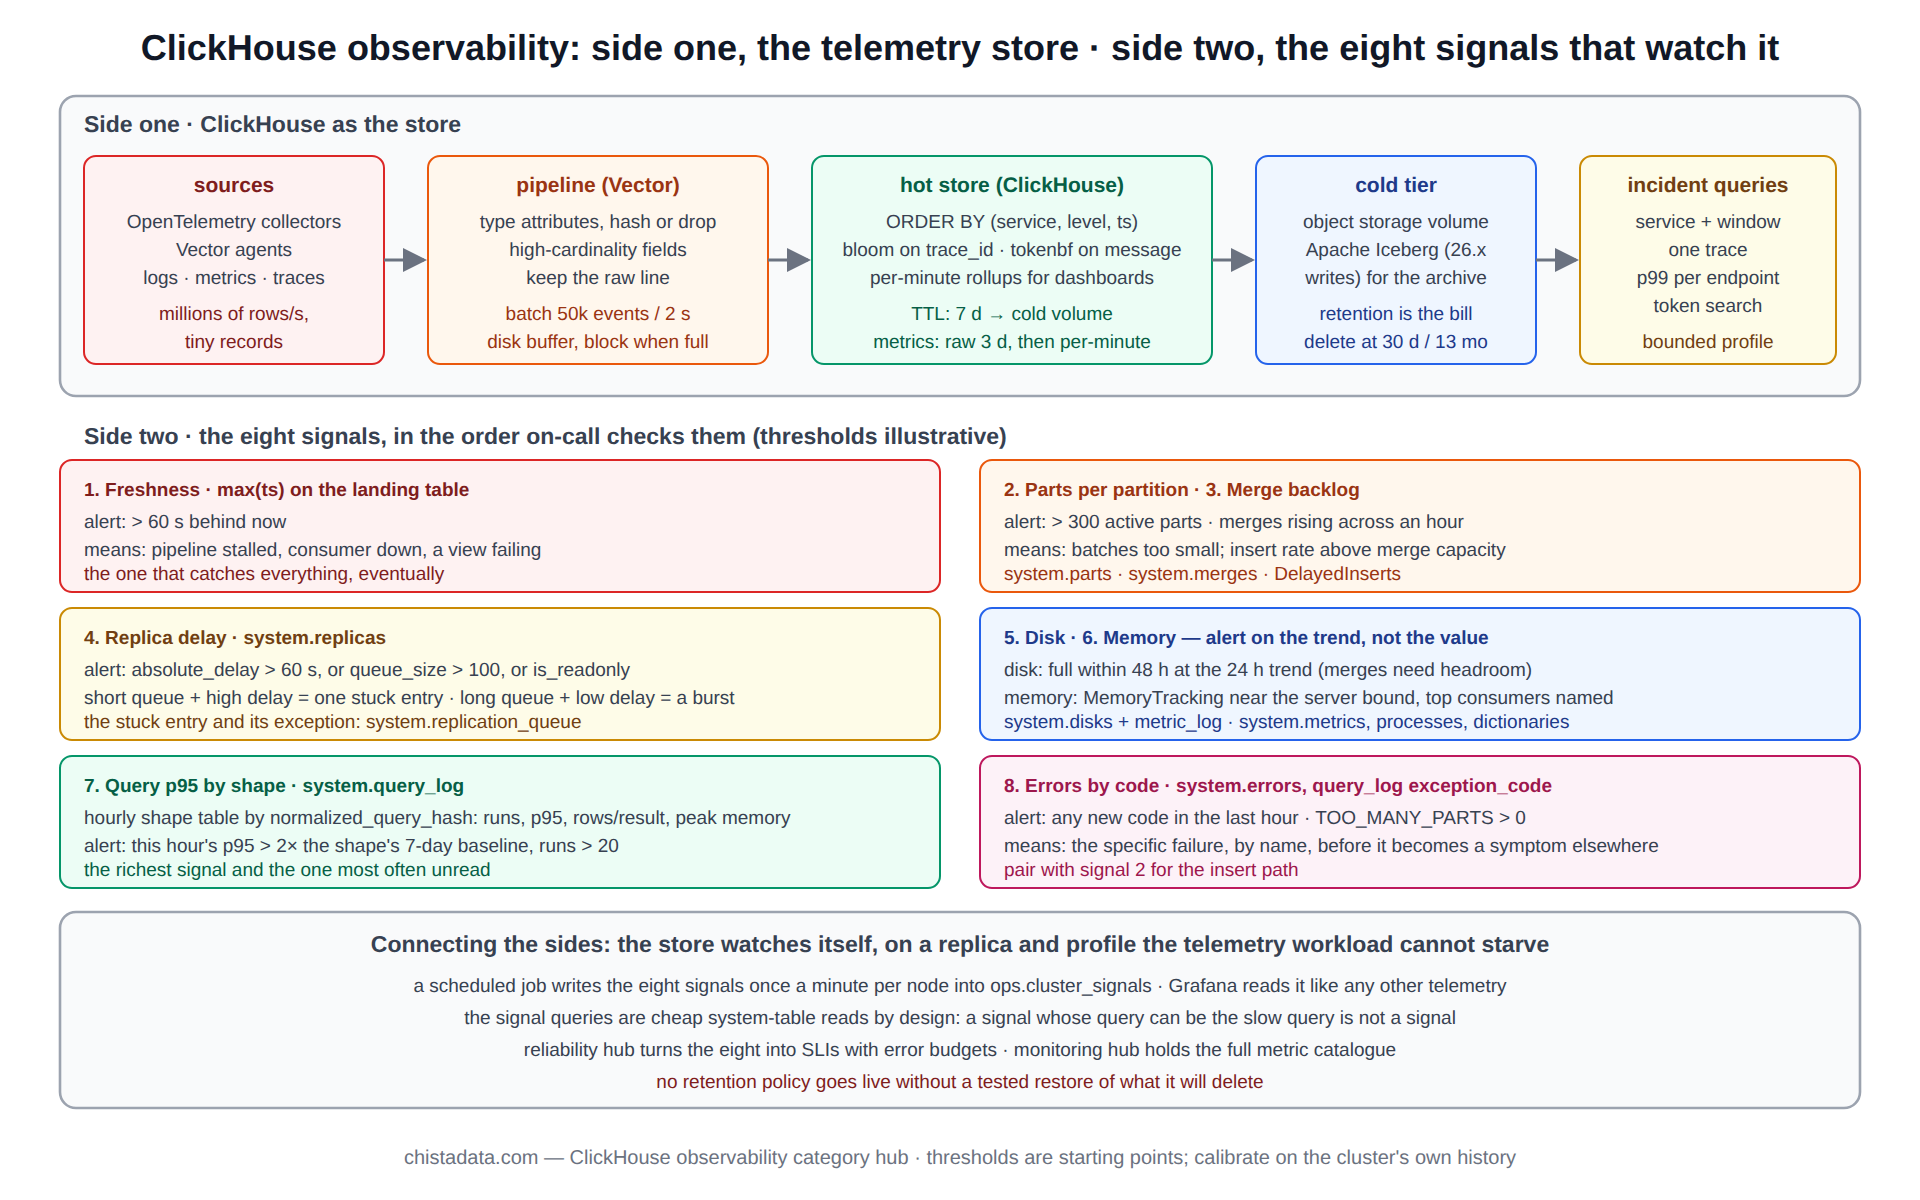
ClickHouse observability has two sides that are usually discussed as if they were one. On the first side ClickHouse is the store: logs, metrics and traces land in it at millions of rows a second, are queried by engineers under incident pressure, and are kept for as long as the retention policy allows. On the second side ClickHouse is the thing being observed: its query log, replication queues, disk and memory are the signals that say whether the store itself is healthy.
A platform that gets the first side right and neglects the second discovers the neglect during the first incident it was built to investigate.
This page covers both. The first half sets out the observability store: the stack, the pipeline, the schema for telemetry, retention and capacity. The second half sets out the eight signals that watch a ClickHouse cluster, with the query behind each and the threshold that turns it into an alert. The monitoring hub goes deeper on the metric catalogue; this page is the operating model that connects the two sides.
The archive holds the 2026 open observability stack with Apache Iceberg, the Vector pipeline, telemetry retention with TTL, capacity planning for observability workloads, mining the query log, replication lag detection, disk and memory alerting, and the repeatable slow-query method.
Side one of ClickHouse observability: the telemetry store
The case for ClickHouse as a telemetry store is the same as for any high-volume, append-only, time-ordered data: compression that turns terabytes of logs into a fraction of the space, a sort key that makes “this service, this hour” a contiguous read, and aggregate functions that compute percentiles over billions of spans in seconds.
The stack around it in 2026 is open: OpenTelemetry collectors or Vector as the pipeline, ClickHouse as the hot store, Apache Iceberg on object storage as the cold tier, and Grafana or a purpose-built UI in front. The ClickHouse observability stack in 2026 post sets out the reference design and where Iceberg changes the retention economics.
-- a log table shaped for the two questions engineers ask: "this service, this window" and "this trace"
CREATE TABLE logs
(
    ts           DateTime64(9)             CODEC(Delta, ZSTD(1)),
    service      LowCardinality(String),
    level        LowCardinality(String),
    trace_id     String                    CODEC(ZSTD(1)),
    span_id      String                    CODEC(ZSTD(1)),
    message      String                    CODEC(ZSTD(3)),
    attrs        Map(LowCardinality(String), String),
    INDEX idx_trace   trace_id TYPE bloom_filter(0.01) GRANULARITY 4,
    INDEX idx_message message  TYPE tokenbf_v1(32768, 3, 0) GRANULARITY 4
)
ENGINE = ReplicatedMergeTree('/clickhouse/tables/{shard}/logs', '{replica}')
PARTITION BY toDate(ts)
ORDER BY (service, level, ts)
TTL toDateTime(ts) + INTERVAL 7 DAY TO VOLUME 'cold',
    toDateTime(ts) + INTERVAL 30 DAY DELETE;
The ClickHouse observability pipeline: Vector, batches and the shape of telemetry
Telemetry arrives as small records at very high rates, which is the worst shape for a MergeTree table unless something batches it, and that something is the pipeline agent. Vector collects, transforms and batches, and writes to ClickHouse over HTTP in blocks of tens of thousands of rows; the transform stage is where attributes are typed, high-cardinality fields are hashed or dropped, and the raw line is kept for the cases the schema did not anticipate.
The Vector ClickHouse pipeline: observability worth the effort post builds it with the configuration that makes the batches land as parts the cluster can merge.
# vector.yaml sink excerpt: batch for parts, not for latency
sinks:
  clickhouse_logs:
    type: clickhouse
    inputs: [parse_logs]
    endpoint: https://${CH_HOST}:8443
    database: telemetry
    table: logs
    auth: {strategy: basic, user: "${CH_USER}", password: "${CH_PASSWORD}"}
    batch: {max_events: 50000, timeout_secs: 2}
    request: {concurrency: 4}
    buffer: {type: disk, max_size: 4294967296, when_full: block}
ClickHouse observability retention: the TTL policies that decide the bill
Telemetry is the ClickHouse observability workload where retention is the cost, because the volume is high and the value of an old row is low. Three TTL clauses do the work: a move to the cold volume after the hot window, a delete after the legal or operational window, and, for metrics, a rollup TTL that replaces raw samples with per-minute aggregates after a few days.
The telemetry retention: TTL policies that control cost post measures the effect of each on a representative log volume, and the MergeTree hub explains why a TTL delete happens at the next merge rather than at the moment of expiry.
-- metrics: keep raw for 3 days, then one row per minute per series
CREATE TABLE metrics
(
    ts      DateTime,
    series  UInt64,
    value   Float64
)
ENGINE = ReplicatedMergeTree('/clickhouse/tables/{shard}/metrics', '{replica}')
PARTITION BY toDate(ts)
ORDER BY (series, ts)
TTL ts + INTERVAL 3 DAY GROUP BY series, toStartOfMinute(ts) SET value = avg(value),
    ts + INTERVAL 13 MONTH DELETE;
Capacity for a ClickHouse observability store
The capacity plan is bytes per event after compression multiplied by events per day multiplied by the hot window, plus the cold tier at object-storage prices, plus the query concurrency an incident produces (which is the peak, not the average). Compression ratios on logs are high and vary widely with the schema: typed attributes and a token index compress and prune well, a single JSON string does neither. The capacity planning for observability workloads post works the arithmetic with illustrative volumes, and the horizontal scaling hub covers when the store outgrows a replica set.
-- the two measured inputs: bytes per row on disk, and rows per day, by table
SELECT
    table,
    round(sum(bytes_on_disk) / sum(rows), 1)                                                     AS bytes_per_row,
    formatReadableQuantity(sumIf(rows, modification_time > now() - INTERVAL 1 DAY))             AS rows_last_day,
    round(sum(data_uncompressed_bytes) / sum(data_compressed_bytes), 1)                          AS compression
FROM system.parts
WHERE active AND database = 'telemetry'
GROUP BY table;
Side two: the eight signals that watch the cluster
Whatever ClickHouse stores, eight numbers from its own system tables say whether it is healthy, and a ClickHouse observability platform that does not watch them is watching everything except itself. They are listed in the order an on-call engineer checks them, with the query and an illustrative threshold each; the sections that follow cover the four that generate most incidents.
| Signal | Source | Alert when (illustrative) | What it usually means |
|---|---|---|---|
| 1. Freshness | max(ts) on the landing table | > 60 s behind now | pipeline stalled, consumer down, view failing |
| 2. Parts per partition | system.parts | > 300 active parts | batches too small; merges losing |
| 3. Merge backlog | system.merges, system.metrics | rising across an hour | insert rate above merge capacity |
| 4. Replica delay | system.replicas absolute_delay | > 60 s, or queue > 100 | fetch, merge or mutation stuck; Keeper |
| 5. Disk | system.disks free_space | < 20 % free, or full in < 48 h at trend | retention not keeping up; merge headroom gone |
| 6. Memory | system.metrics MemoryTracking, query_log peaks | > 80 % of the server bound | an unbounded query class; merges plus queries |
| 7. Query p95 by shape | system.query_log | > 2× the shape’s baseline | plan regression, cold cache, contention |
| 8. Errors by code | system.errors, query_log exception_code | any new code; TOO_MANY_PARTS > 0 | the specific failure, by name |
Signal 7 in depth: mining the query log, the core of ClickHouse observability
The query log is the richest ClickHouse observability signal on the list and the one most often left unread. Grouped by normalized_query_hash it shows every shape the cluster serves, how often, at what p95, reading how many rows per result row and peaking at what memory, which is enough to find the ten shapes that cost the most and the one that regressed after the last deploy. The mining the ClickHouse query log for performance insights post is the method; the repeatable diagnostic method for slow queries post is what happens to a shape once it has been found.
-- the shape table, refreshed hourly into a monitoring database
INSERT INTO ops.query_shapes_hourly
SELECT
    toStartOfHour(event_time)                               AS hour,
    normalized_query_hash                                   AS shape,
    count()                                                 AS runs,
    quantile(0.95)(query_duration_ms)                       AS p95_ms,
    round(avg(read_rows) / greatest(avg(result_rows), 1))   AS rows_read_per_result_row,
    max(memory_usage)                                       AS peak_mem,
    any(substring(query, 1, 200))                           AS sample
FROM system.query_log
WHERE type = 'QueryFinish' AND query_kind = 'Select' AND event_time >= toStartOfHour(now() - INTERVAL 1 HOUR) AND event_time < toStartOfHour(now())
GROUP BY hour, shape;

-- the regression alert: this hour's p95 against the shape's 7-day baseline
SELECT shape, p95_ms, baseline_p95, round(p95_ms / baseline_p95, 1) AS ratio, sample
FROM ops.query_shapes_hourly AS h
JOIN (SELECT shape, quantile(0.5)(p95_ms) AS baseline_p95 FROM ops.query_shapes_hourly WHERE hour > now() - INTERVAL 7 DAY GROUP BY shape) AS b USING shape
WHERE hour = toStartOfHour(now() - INTERVAL 1 HOUR) AND runs > 20 AND p95_ms > 2 * baseline_p95
ORDER BY ratio DESC;
Signal 4 in depth: replication lag
Lag under ClickHouse replication is a queue depth: entries the replica has not yet executed, and seconds since the newest entry it has. Both are in system.replicas, and the entry that is stuck, with its exception, is in system.replication_queue. The alert is on absolute delay and queue size together, because a short queue with a high delay is one stuck entry and a long queue with a low delay is a burst that will drain. The replication lag: how to detect and resolve it post covers the diagnosis; the replication hub covers the six repairs.
SELECT hostName() AS host, database, table, absolute_delay, queue_size, inserts_in_queue, merges_in_queue, is_readonly, last_queue_update_exception
FROM clusterAllReplicas('ch_prod', system.replicas)
WHERE absolute_delay > 60 OR queue_size > 100 OR is_readonly
ORDER BY absolute_delay DESC;
Signals 5 and 6 in depth: disk and memory
Disk and memory alerts on ClickHouse fail in a particular way: they fire too late because they are set on the current value rather than on the trend. Disk on a MergeTree node needs headroom for merges (a merge writes the new part before removing the inputs) and for the TTL deletes that have not yet run, so the useful alert is “full within 48 hours at the current trend”, not “80 percent used”.
Memory has the same shape: the server bound is shared between queries, merges, dictionaries and caches, and the alert is on tracked memory approaching the bound with the top consumers named. The disk and memory alerting: signals that catch outages early post sets out both with the queries below.
-- disk: hours to full at the last 24 h trend (from system.metric_log, per disk)
SELECT
    name,
    formatReadableSize(free_space)                                            AS free,
    round(free_space / greatest(bytes_per_hour, 1) , 1)                       AS hours_to_full
FROM system.disks
LEFT JOIN
(
    SELECT (max(CurrentMetric_DiskUsed_default) - min(CurrentMetric_DiskUsed_default)) / 24 AS bytes_per_hour
    FROM system.metric_log WHERE event_time > now() - INTERVAL 1 DAY
) AS t ON 1 = 1;

-- memory: who holds it, right now
SELECT metric, formatReadableSize(value) AS v FROM system.metrics WHERE metric IN ('MemoryTracking', 'MergesMutationsMemoryTracking');
SELECT formatReadableSize(sum(bytes_allocated)) AS dictionaries FROM system.dictionaries;
SELECT user, formatReadableSize(sum(memory_usage)) AS running FROM system.processes GROUP BY user ORDER BY sum(memory_usage) DESC;
Connecting the two sides of ClickHouse observability: the store watches itself
The eight signals are rows, and the natural place to keep them is the same cluster, in a monitoring database that the pipeline fills from the system tables on a schedule and that Grafana reads like any other telemetry. The design has one rule: the monitoring tables live on a storage policy and a settings profile that the telemetry workload cannot starve, so that when the store is in trouble the signals about it are still queryable. A small second cluster, or a replica reserved for the purpose, is the usual answer on large estates.
-- one row per minute per node: the eight signals, written by a scheduled job into ops.cluster_signals
INSERT INTO ops.cluster_signals
SELECT
    now()                                                                                     AS ts,
    hostName()                                                                                AS host,
    (SELECT dateDiff('second', max(ts), now()) FROM telemetry.logs WHERE ts > now() - INTERVAL 1 HOUR) AS freshness_s,
    (SELECT max(c) FROM (SELECT count() AS c FROM system.parts WHERE active GROUP BY table, partition))  AS max_parts,
    (SELECT count() FROM system.merges)                                                       AS merges_running,
    (SELECT max(absolute_delay) FROM system.replicas)                                          AS max_replica_delay,
    (SELECT min(free_space / total_space) FROM system.disks)                                   AS min_disk_free_ratio,
    (SELECT value FROM system.metrics WHERE metric = 'MemoryTracking')                         AS memory_tracked,
    (SELECT quantile(0.95)(query_duration_ms) FROM system.query_log WHERE type = 'QueryFinish' AND event_time > now() - INTERVAL 1 MINUTE) AS p95_last_min,
    (SELECT sum(value) FROM system.errors WHERE last_error_time > now() - INTERVAL 1 MINUTE)  AS errors_last_min;
Querying the store under incident pressure
The store’s own query shapes are predictable and worth designing for: “errors for this service in the last 15 minutes”, “every span of this trace”, “the p99 of this endpoint over the day”, and “messages containing this token”. The first two are served by the sort key and the Bloom filter on trace_id; the third by a per-minute rollup fed from the raw table; the fourth by the token index on message.
An incident brings tens of engineers running these shapes at once, so the settings profile for the observability UI bounds memory and time per query, and the rollup tables exist precisely so that the dashboards do not scan raw logs during the hour when the cluster is busiest. The search hub covers the token and text index choices for the message column.
-- the four incident shapes, each served by a different mechanism
SELECT ts, message FROM telemetry.logs
WHERE service = 'checkout' AND level = 'ERROR' AND ts >= now() - INTERVAL 15 MINUTE
ORDER BY ts DESC LIMIT 200;                                                  -- sort key

SELECT ts, service, span_id, message FROM telemetry.logs
WHERE trace_id = '${TRACE_ID}' ORDER BY ts;                                   -- Bloom filter on trace_id

SELECT minute, quantileTDigestMerge(0.99)(latency_state) FROM telemetry.http_1m
WHERE endpoint = '/api/pay' AND minute >= today() GROUP BY minute ORDER BY minute;   -- rollup

SELECT count() FROM telemetry.logs
WHERE hasToken(message, 'ECONNRESET') AND ts >= now() - INTERVAL 1 HOUR;     -- token index
The same profile-and-rollup discipline applies to the alerting queries themselves: the eight signals are cheap system-table reads by design, so that the job that writes them keeps running when the cluster is at its worst. A signal whose query can itself be the slow query is not a signal, and a ClickHouse observability job that competes with the incident it is meant to explain has been placed on the wrong replica.
Version notes
system.metric_log and system.errors are 20.x and later; TTL GROUP BY rollups are 20.x and later; MergesMutationsMemoryTracking is 23.x and later. Iceberg as a cold tier with writes from ClickHouse is 26.x; earlier versions read Iceberg but do not write it. The system tables documentation is the source for the columns used above; confirm each on the running version before an alert depends on it.
Reading the archive
The archive is recent, written in 2026 against the 26.x line, so the settings and table columns in the posts match current releases.
For side one of ClickHouse observability: the 2026 stack post, the Vector pipeline, telemetry retention, and capacity planning, in that order. For side two: query log mining and the slow-query method for signal 7, replication lag for signal 4, disk and memory alerting for signals 5 and 6. The reliability hub turns the eight signals into SLIs with error budgets.
ChistaDATA builds observability stores on ClickHouse as a ClickHouse consulting engagement and runs both sides under managed services, with the eight signals as standing alerts on every cluster. Thresholds on this page are starting points to be calibrated on staging against the cluster’s own history, and no retention policy goes live without a tested restore of the data it will delete.