ChistaDATA · Advanced ClickHouse troubleshooting on 26.8 LTS and 26.9 · September 2026
Advanced ClickHouse troubleshooting is mostly reading. The server writes down what every query read, how much memory it held, which parts a merge is chewing through and why a replica stopped, and it keeps all of it in tables you can query with the same SQL you already use. The engineers who resolve a Severity 1 in twenty minutes are not smarter than the ones who take a day; they know which of those tables to open first.
This article is the method we use for advanced ClickHouse troubleshooting on 26.8 LTS, with the additions 26.8 and 26.9 made to the diagnostic surface, the queries we actually run, and one incident from our own lab last week that we would rather show than hide. Every setting named here was read from a 26.8.11.7 binary; every query was run against a 1,000,000,000-row table on that build.
Versions: ClickHouse 26.8 LTS (announced 10 September 2026) and 26.9 (24 September 2026). Lab: 2 vCPU / 7 GB / NVMe-class disk. Timings are server-side from system.query_log. Test every change on staging before production and keep a tested restore path.
Method
Advanced ClickHouse troubleshooting starts with a symptom and ends with a system table, not the other way round
The map below is how we triage; it is the whole of advanced ClickHouse troubleshooting in one picture. The ticket gives us the left column. The second column is the one table we open before anything else. The third is the signal that tells us we are looking at the cause rather than a coincidence, and the fourth is the change we make, on staging first, with the rollback written down. If a step in the middle does not confirm, we go back to the ticket, not forward to a fix.
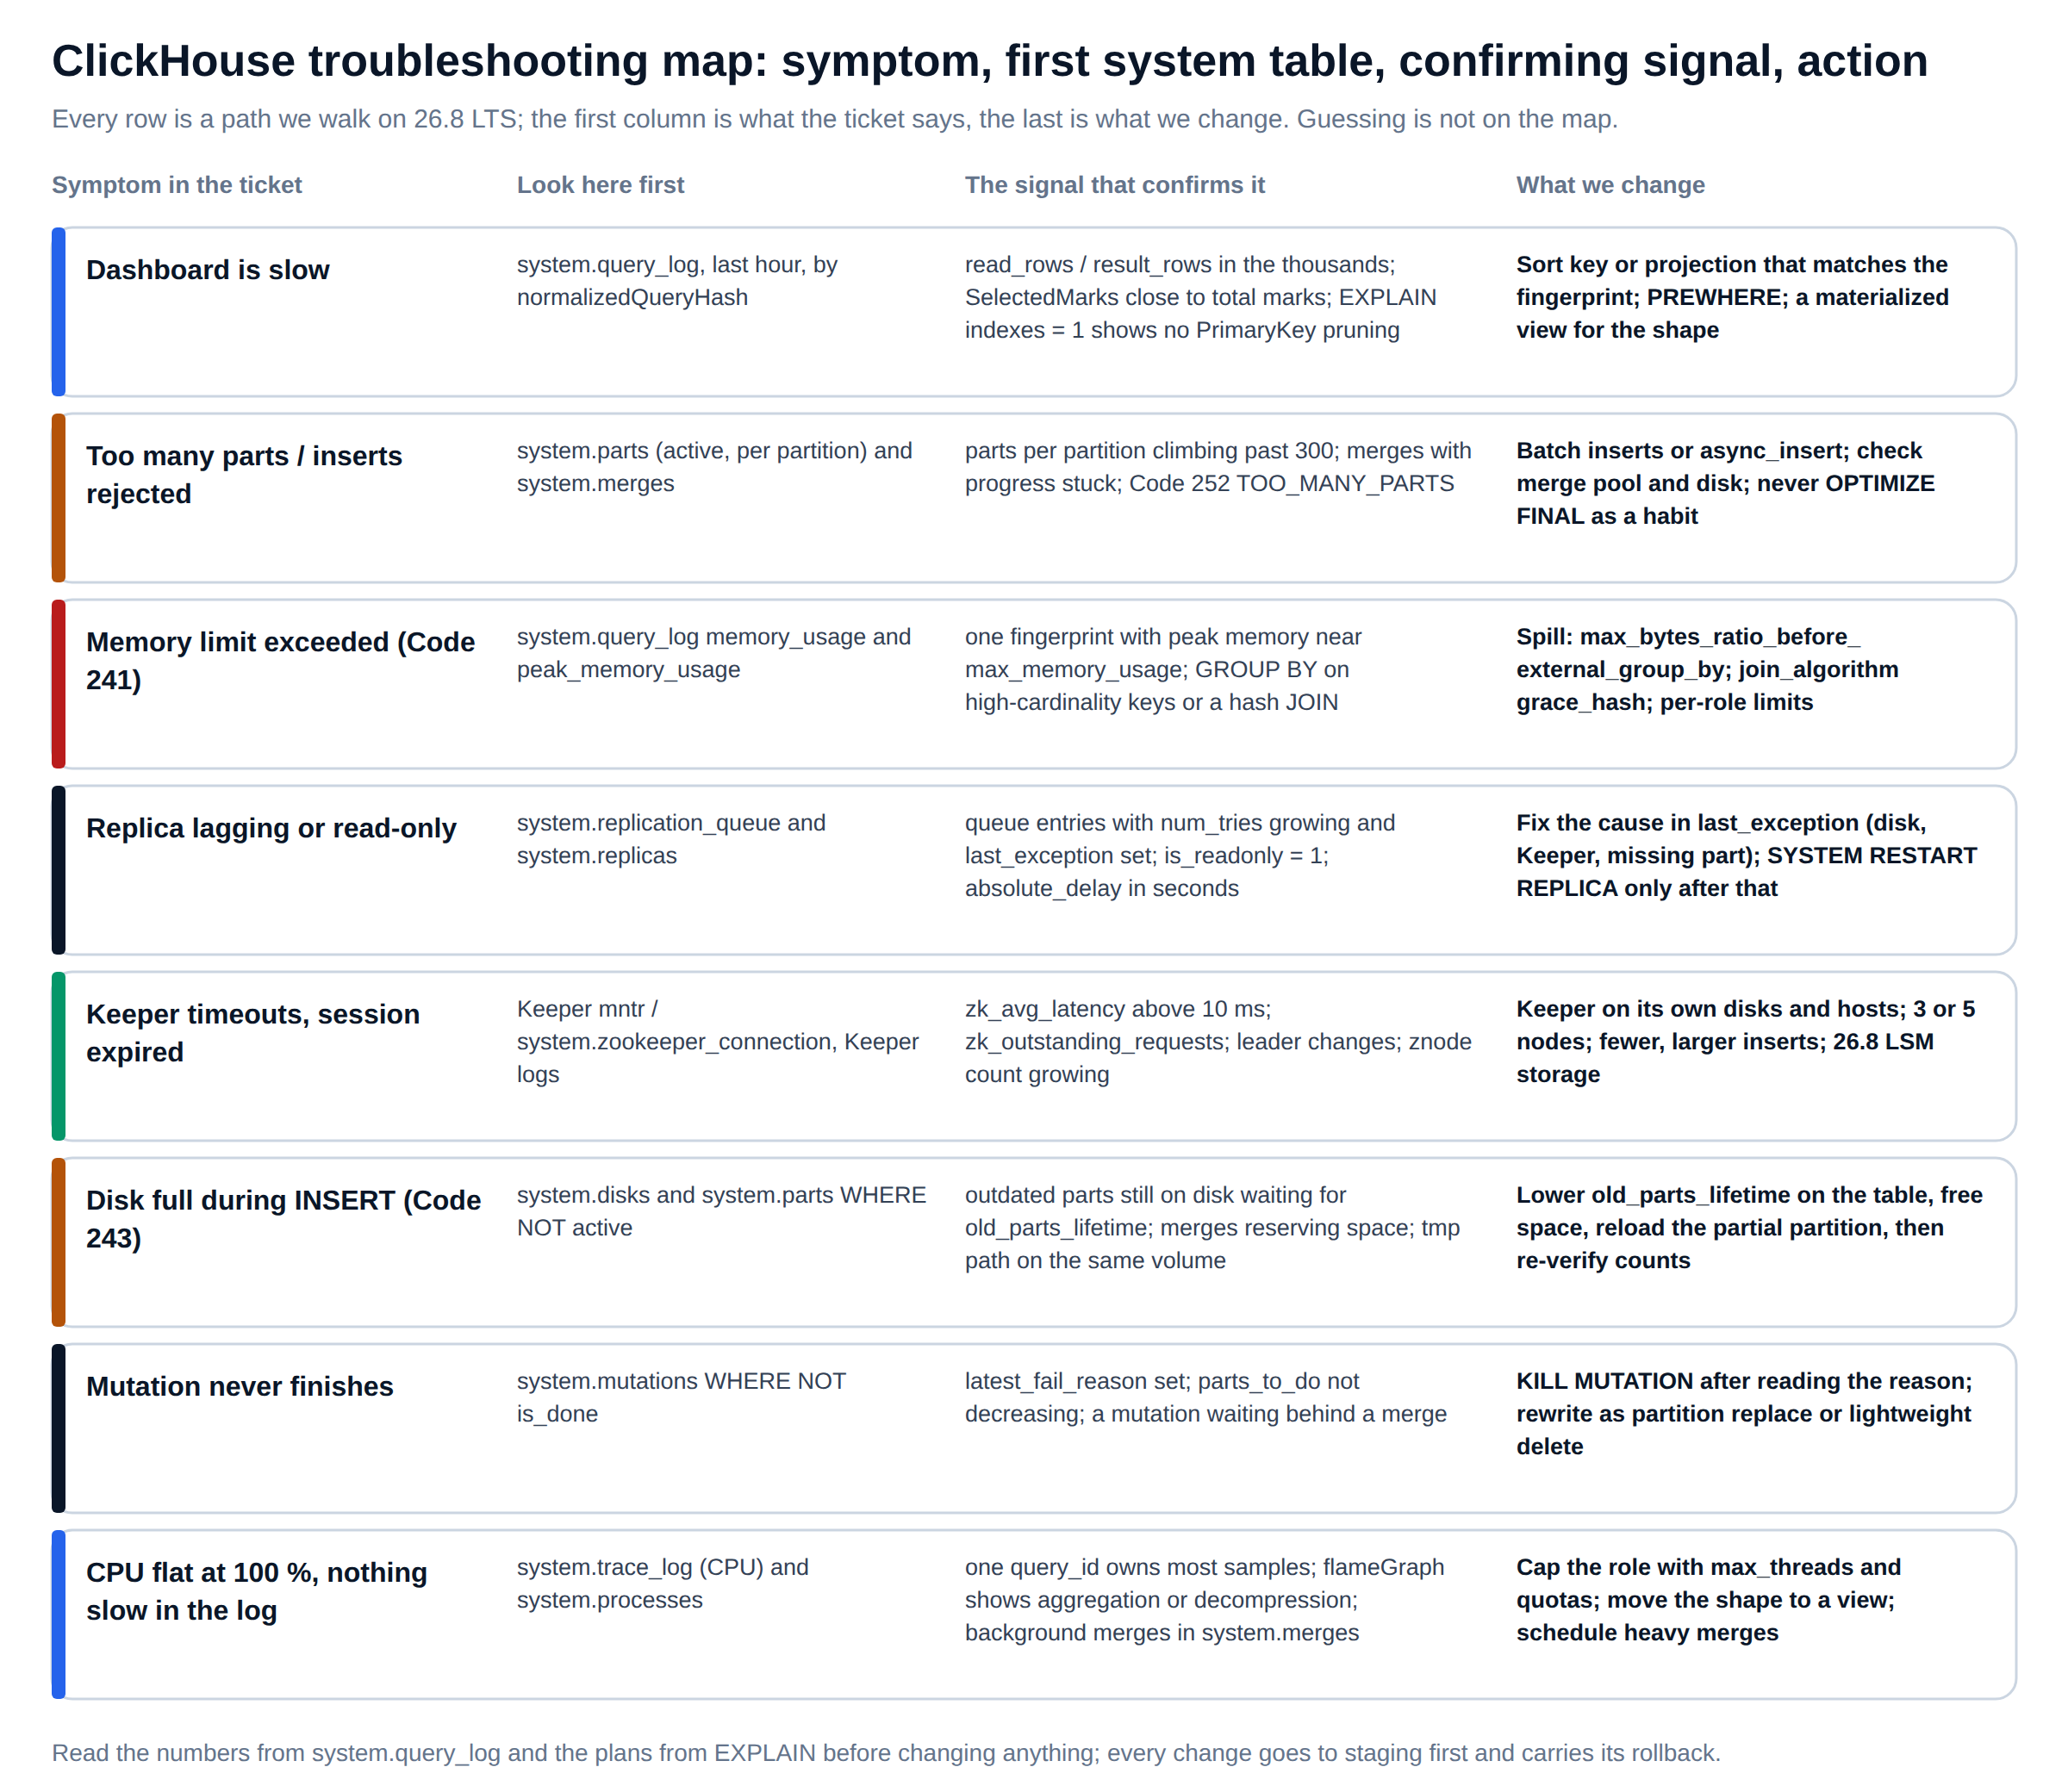
Two habits make the map work. The first is to keep the logs. system.query_log, system.query_thread_log, system.trace_log and system.metric_log are the record; a cluster that has them switched off to save disk starts every incident a week late. Put a TTL on them instead. The second is to read numbers before plans and plans before code: read_rows against result_rows tells you whether a query is doing the right amount of work long before you look at its text.
The surface
What 26.8 LTS and 26.9 added to the surface for advanced ClickHouse troubleshooting
The core tables for advanced ClickHouse troubleshooting have been stable for years. What the two latest releases changed is who can read them and how much a session leaves behind, and both changes matter in practice because the slowest part of advanced ClickHouse troubleshooting is often getting the right person access to the right row.
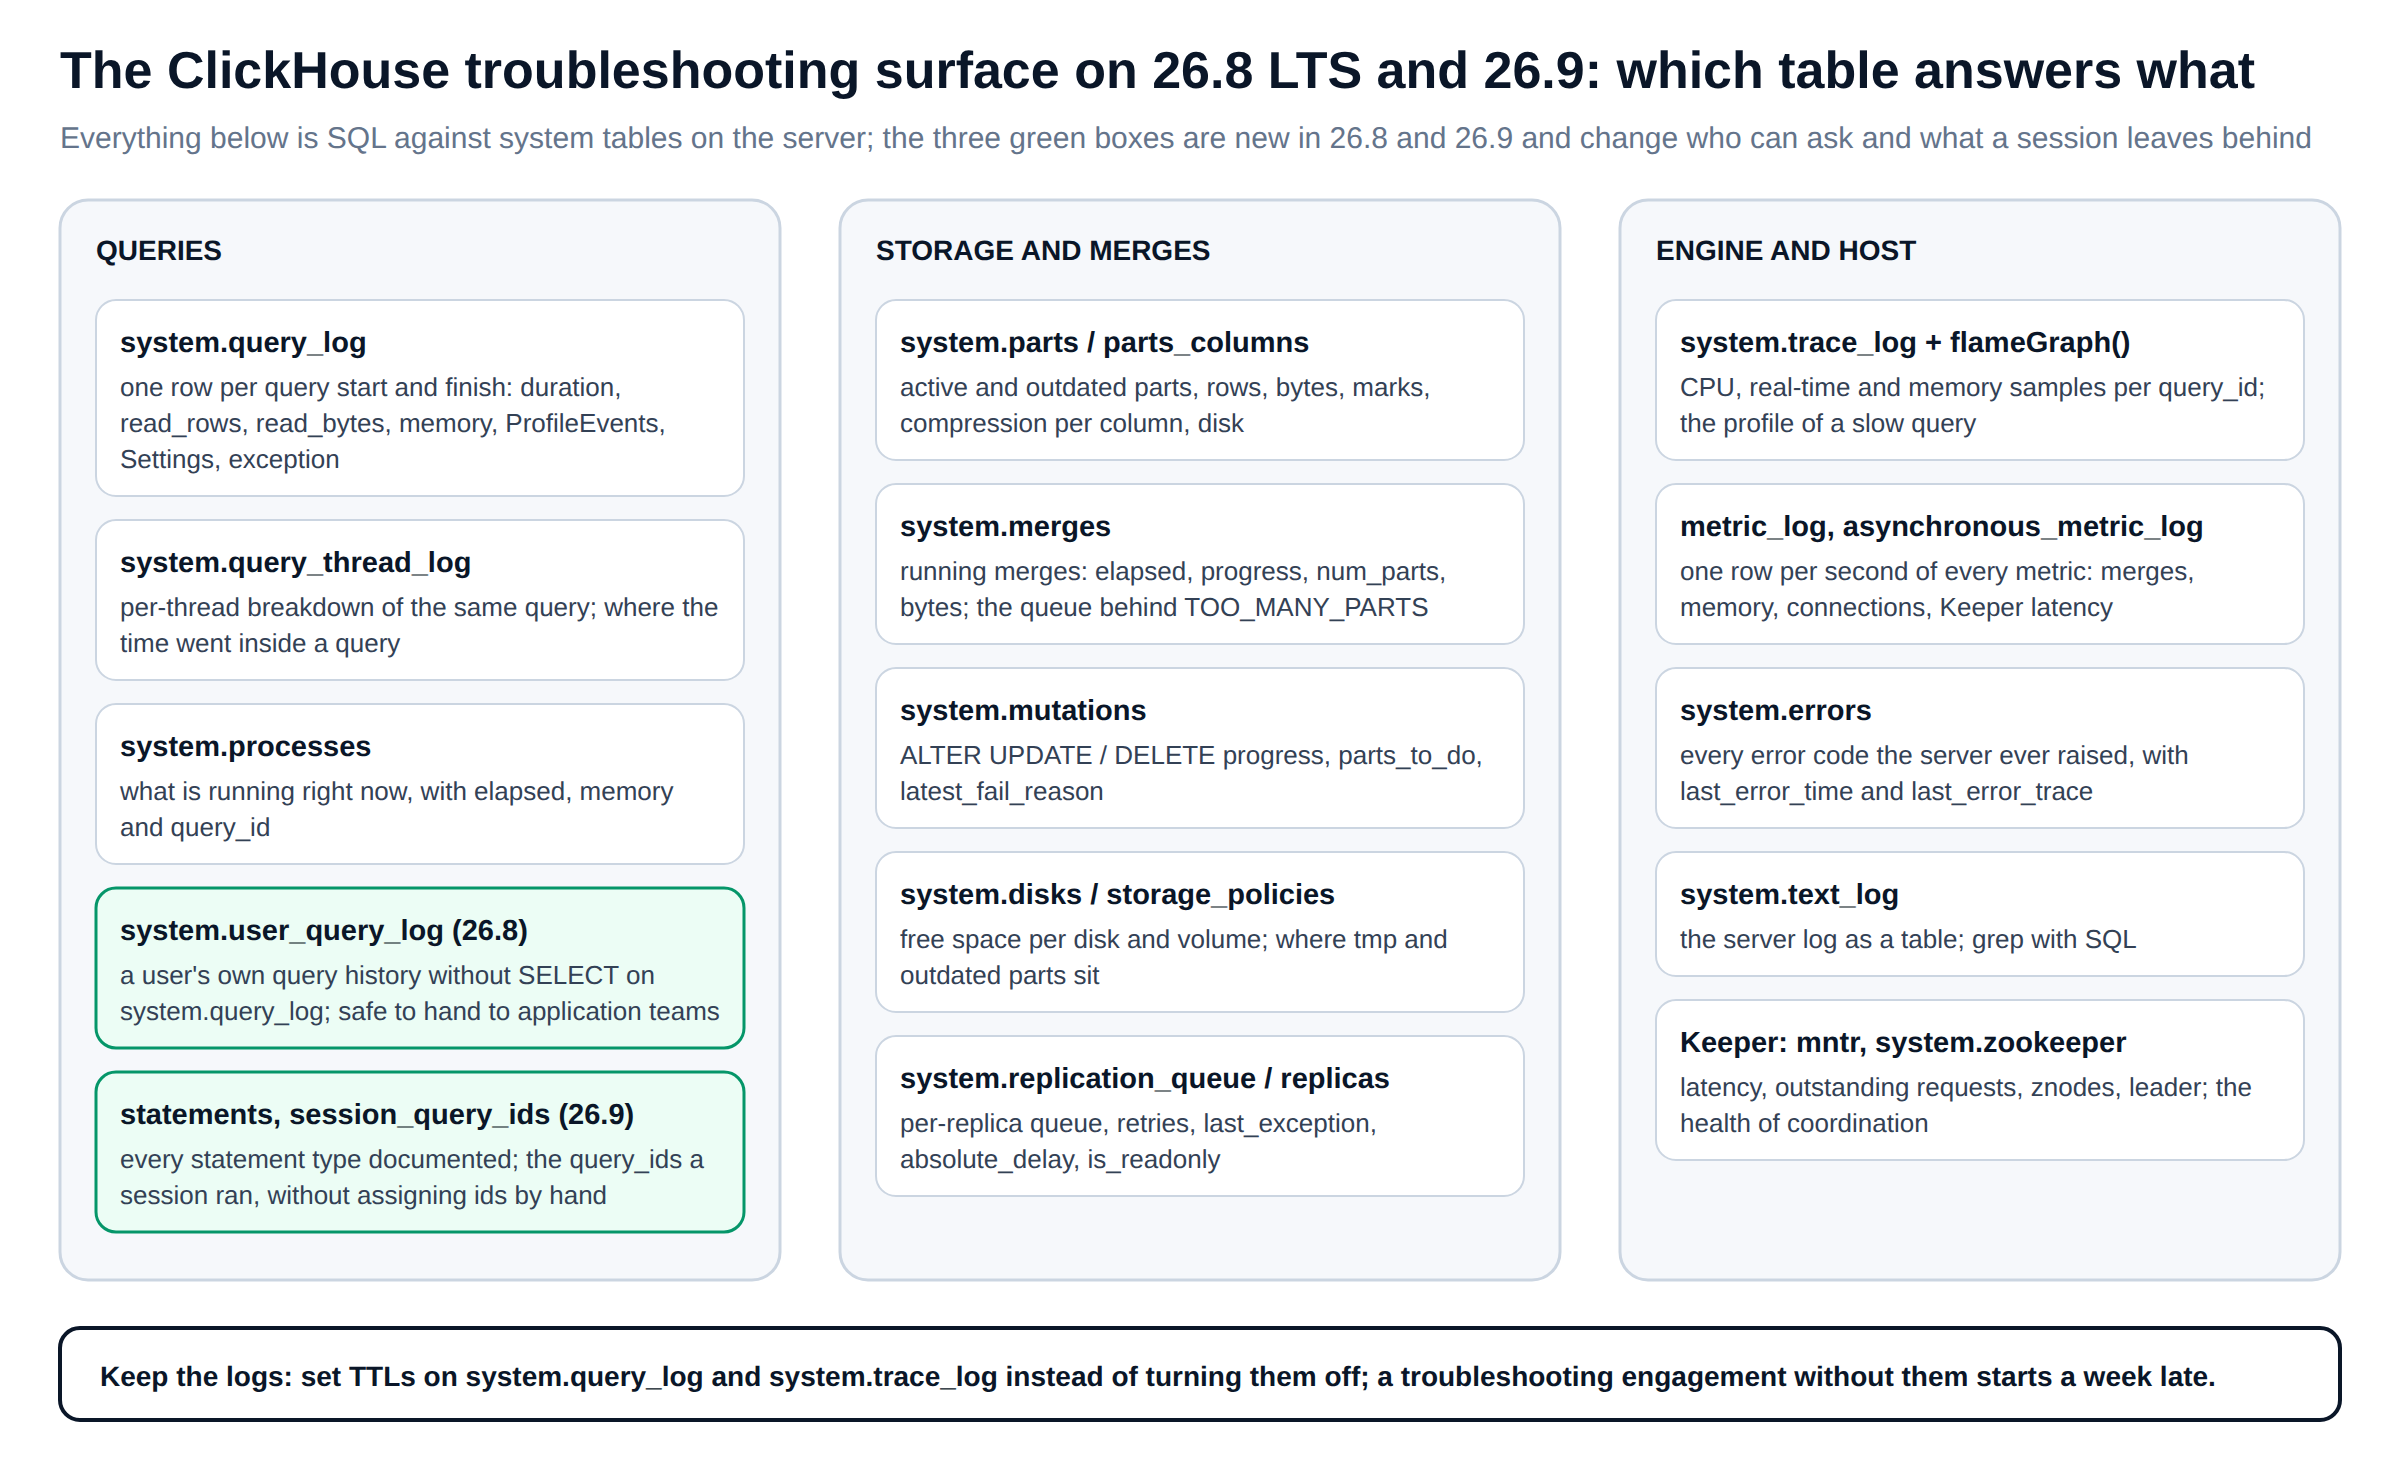
system.user_query_log (26.8). Until now, letting an application team see their own slow queries meant granting SELECT on system.query_log, which shows everyone’s queries, settings and, with the wrong option, query text with literals. The per-user log gives each user their own history and nothing else. We now hand it to product teams on day one of an engagement so they can answer “what did my dashboard run at 09:14” without a ticket to us.
Background queries (26.8). run_query_in_background = 1 lets a long INSERT SELECT, backfill or OPTIMIZE survive the client disconnecting. Operationally this removes a whole class of “the migration died when my laptop slept” tickets; diagnostically it means the query keeps a query_id you can watch in system.processes from another session.
system.statements and system.session_query_ids (26.9). The first documents every statement type the server understands, which is a small thing until you are checking whether a customer’s tooling emits syntax the LTS build accepts. The second records the query ids a session ran, so you no longer need the client to set query_id by hand to correlate an application request with its rows in the log. On 26.9 we also read min, max and count straight from column statistics (the release call shows 8 to 24 ms dropping to 2 ms), which changes what “this simple query is slow” can mean on a fresh table.
What did not change. enable_parallel_replicas = 0 is still the open-source default on 26.8.11.7; the query condition cache and lazy materialization are on by default; compile_expressions = 1 is the default and, as we measured in the billion-row article, not always a win on small boxes. Read these from the binary you are running, not from memory:
-- Advanced ClickHouse troubleshooting, first minute on any server: what am I running and what is on?
SELECT version();
SELECT name, value, changed
FROM system.settings
WHERE name IN ('max_threads', 'max_memory_usage', 'max_bytes_ratio_before_external_group_by',
               'join_algorithm', 'use_query_condition_cache', 'query_plan_optimize_lazy_materialization',
               'enable_parallel_replicas', 'compile_expressions', 'enable_adaptive_aggregator',
               'materialize_statistics_on_insert', 'use_statistics_for_part_pruning');
SELECT name, value FROM system.merge_tree_settings
WHERE name IN ('old_parts_lifetime', 'parts_to_throw_insert', 'parts_to_delay_insert',
               'max_bytes_to_merge_at_max_space_in_pool', 'auto_statistics_types');
Technique 1
Rank fingerprints, not queries: the first query we run in advanced ClickHouse troubleshooting on every engagement
A dashboard fires the same statement with different literals thousands of times an hour, and advanced ClickHouse troubleshooting means seeing the shape rather than the instance. Ranking individual queries by duration surfaces the one outlier; ranking fingerprints by total time surfaces the shape that is actually burning the cluster. normalizedQueryHash strips literals, and the ratio of rows read to rows returned is the single most useful number in the result.
-- Advanced ClickHouse troubleshooting: top fingerprints by total time, last hour, with the amplification ratio
SELECT
    normalizedQueryHash(query)                                    AS fingerprint,
    count()                                                       AS runs,
    round(sum(query_duration_ms) / 1000, 1)                       AS total_s,
    quantile(0.95)(query_duration_ms)                             AS p95_ms,
    round(avg(read_rows) / greatest(avg(result_rows), 1))         AS rows_read_per_row_returned,
    formatReadableSize(avg(read_bytes))                           AS avg_read,
    formatReadableSize(max(memory_usage))                         AS max_mem,
    round(avg(ProfileEvents['SelectedMarks']))                    AS avg_marks,
    any(substring(query, 1, 120))                                 AS sample
FROM system.query_log
WHERE type = 'QueryFinish'
  AND event_time > now() - INTERVAL 1 HOUR
  AND query_kind = 'Select'
GROUP BY fingerprint
ORDER BY total_s DESC
LIMIT 15;
How to read it: a fingerprint with rows_read_per_row_returned in the millions and avg_marks close to the table’s total marks is scanning; it is not using the sort key, whatever the WHERE clause looks like.
One with a modest ratio but a large max_mem is an aggregation or join problem, and technique 3 applies. One with a small ratio, small memory and a high p95 is waiting on something else: disk, merges or Keeper, and techniques 4 to 6 apply. On our lab table, the difference between a predicate on the first sort-key column and one on a column outside the key was 8 ms against 1,577 ms for the same 106-row answer; the ratio column shows that difference before you open a single plan.
Technique 2
Advanced ClickHouse troubleshooting with the plan: EXPLAIN indexes and EXPLAIN PIPELINE
Once a fingerprint is chosen, advanced ClickHouse troubleshooting moves to the plan, which tells you which stage of the read funnel failed to prune. This is real output from 26.8.11.7 on the lab table; note the Statistics line, which is where 26.8’s automatic column statistics show up, and which was absent on older builds.
EXPLAIN indexes = 1
SELECT count() FROM lab.events
WHERE tenant_id = 42 AND event_time >= '2026-03-01 00:00:00' AND event_time < '2026-03-02 00:00:00';

ReadFromMergeTree (lab.events)
  Indexes:
    MinMax       Condition: true      Parts: 6/6   Granules: 122071/122071
    Partition    Condition: true      Parts: 6/6   Granules: 122071/122071
    Statistics   Keys: event_time, tenant_id       Parts: 1/6   Granules: 20925/122071
    PrimaryKey   Keys: tenant_id, event_time       Parts: 1/1   Granules: 2/20925
                 Search Algorithm: binary search
Three things to check on every plan in advanced ClickHouse troubleshooting. First, whether Partition pruned anything: here it did not, because the partition key is event_date and the predicate is on event_time, and statistics had to do the work instead; on a build without automatic statistics this query would have touched all six parts. Second, whether PrimaryKey shows binary search or generic exclusion search; the latter means the predicate skips the first key column and the index is being used weakly. Third, the final granule count against the total; anything above a few percent of the table for a selective predicate is a schema conversation, not a tuning one.
EXPLAIN PIPELINE answers a different question: how many streams the query runs on and where they merge. If a GROUP BY shows a single stream into MergingAggregated on a 32-core node, you are looking at a query that was forced serial, usually by a subquery, an ORDER BY without LIMIT or a setting like max_threads = 1 inherited from a profile. Check the query’s Settings map in system.query_log before you blame the engine.
-- Which settings did that slow query actually run with? (profiles and users override defaults silently)
SELECT query_id, Settings['max_threads'] AS threads, Settings['max_memory_usage'] AS mem,
       Settings['join_algorithm'] AS join_alg, Settings['optimize_move_to_prewhere'] AS prewhere
FROM system.query_log
WHERE type = 'QueryFinish' AND normalizedQueryHash(query) = {fingerprint:UInt64}
ORDER BY event_time DESC LIMIT 5;
Technique 3
Advanced ClickHouse troubleshooting for memory limits: find the operator, not the query
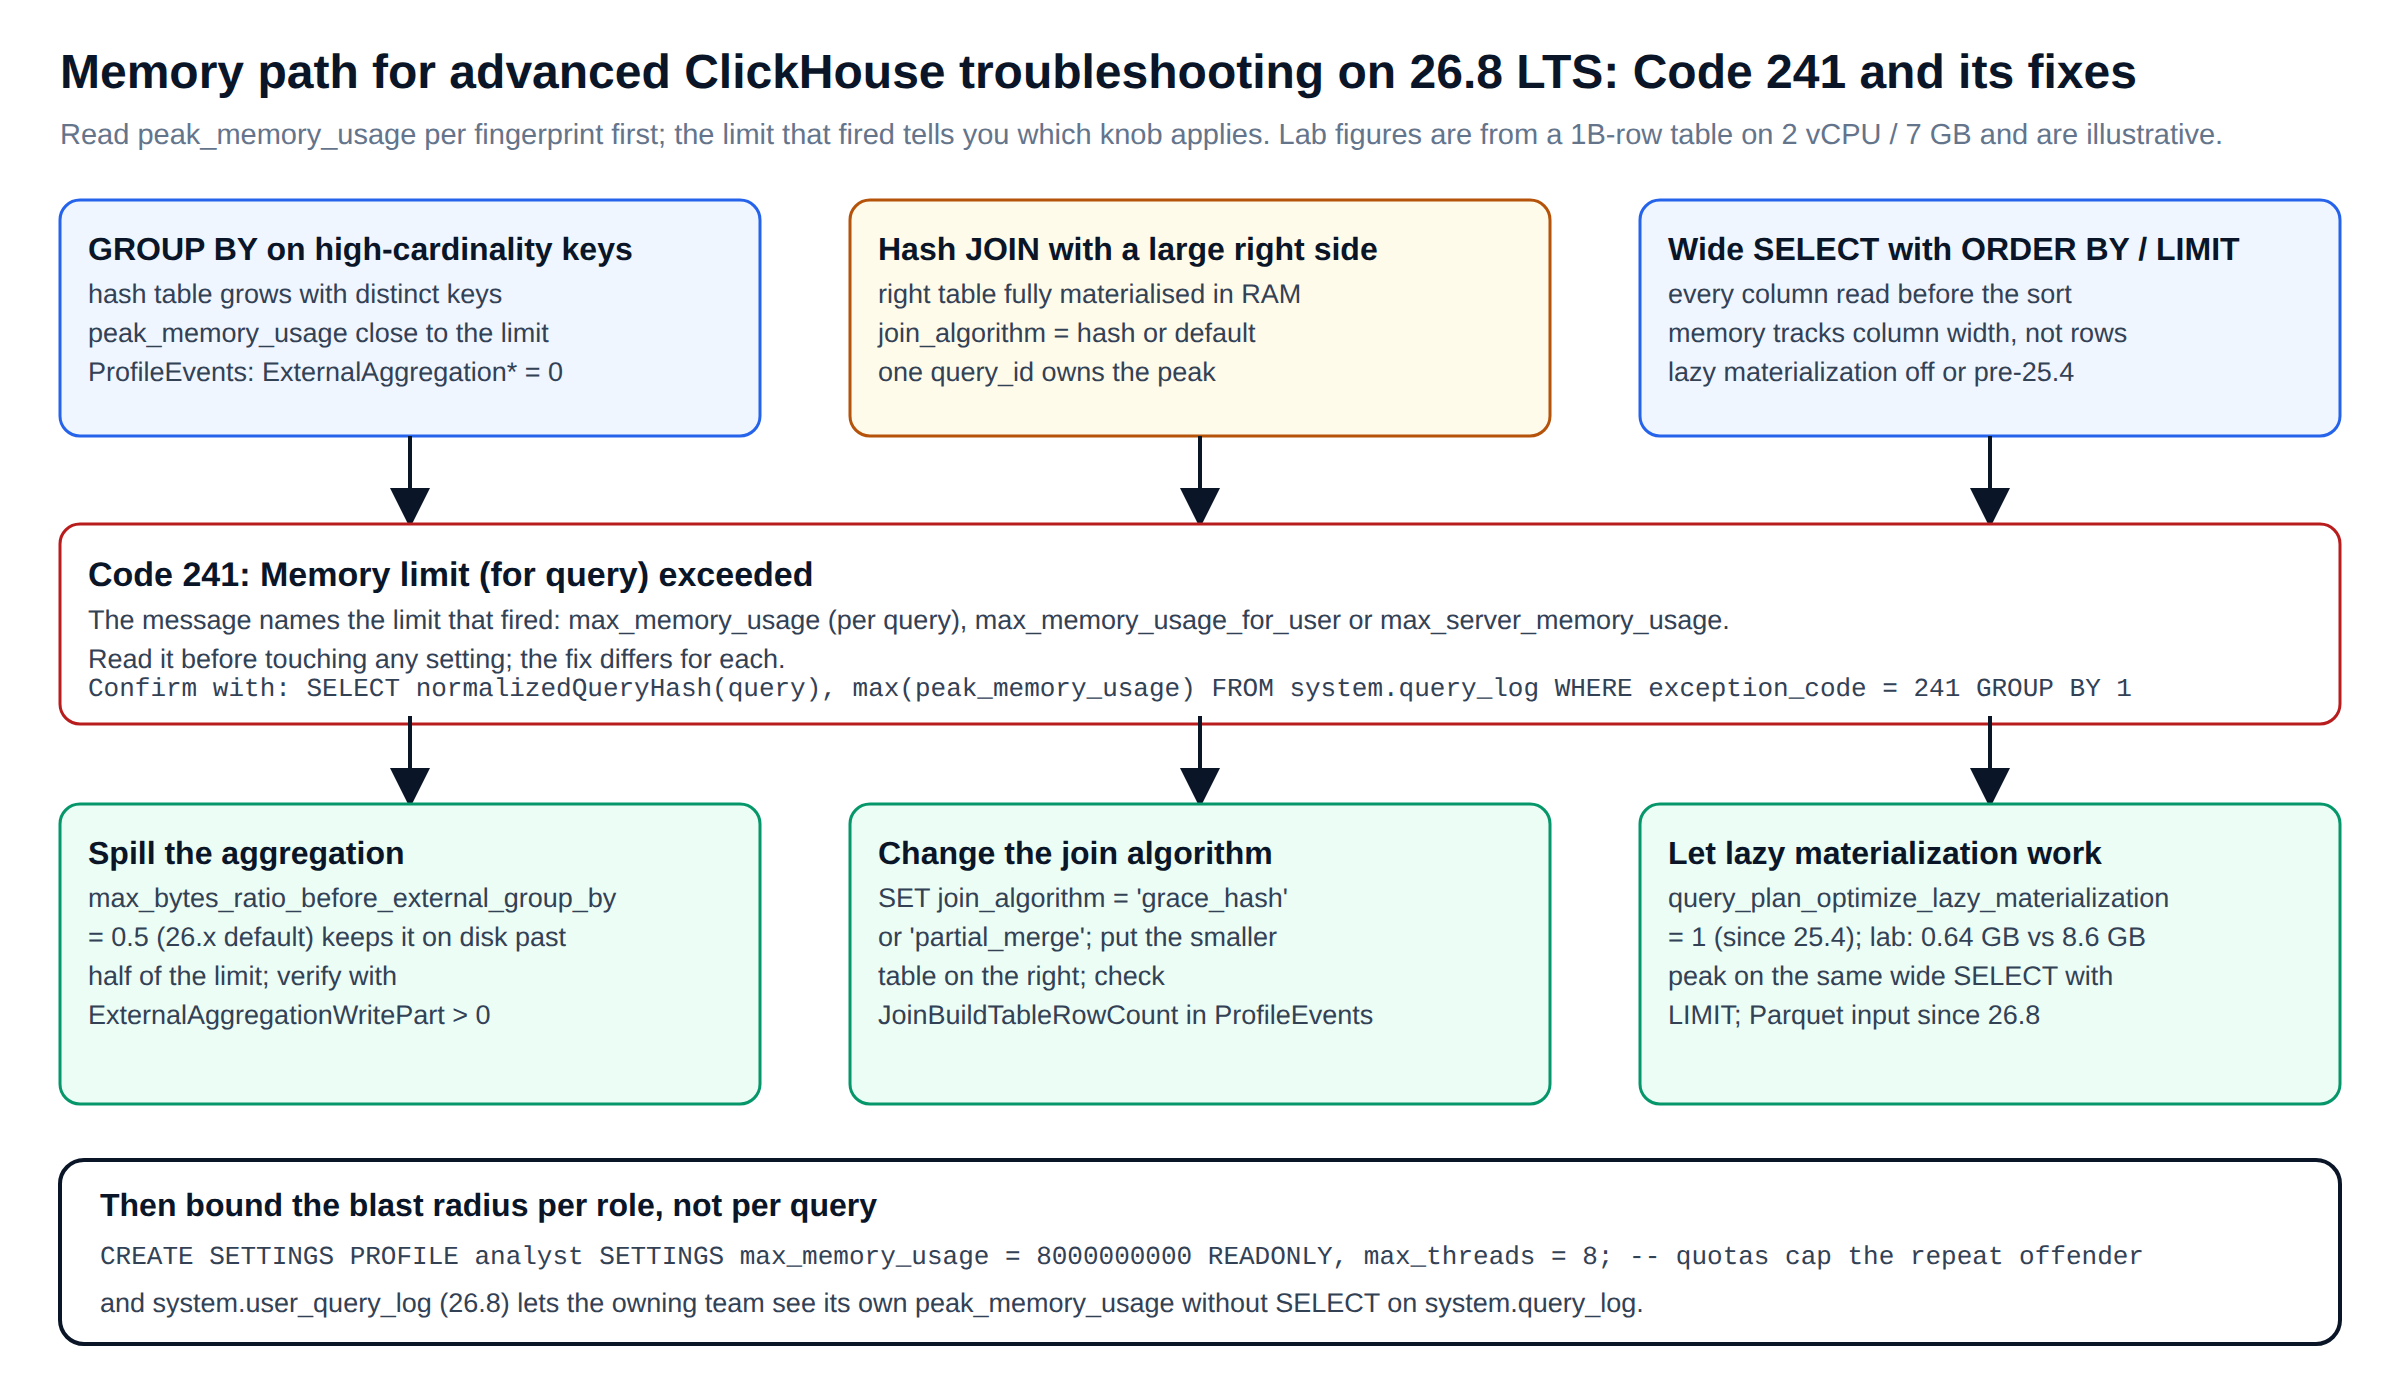
Code: 241. DB::Exception: Memory limit (for query) exceeded names a query, but in advanced ClickHouse troubleshooting the query is rarely the unit that matters. The memory belongs to an operator, almost always a hash table: a GROUP BY on a high-cardinality key, a uniqExact, or the right side of a hash join. system.query_log gives you the peak; system.query_thread_log and the memory samples in system.trace_log tell you which operator held it.
-- Peak memory per fingerprint, with the failures counted separately
SELECT normalizedQueryHash(query) AS fingerprint,
       formatReadableSize(max(peak_memory_usage)) AS peak,
       countIf(exception_code = 241)              AS oom_failures,
       any(substring(query, 1, 100))              AS sample
FROM system.query_log
WHERE event_time > now() - INTERVAL 1 DAY AND type IN ('QueryFinish', 'ExceptionWhileProcessing')
GROUP BY fingerprint HAVING oom_failures > 0 OR max(peak_memory_usage) > 8e9
ORDER BY max(peak_memory_usage) DESC LIMIT 10;

-- Memory flame graph for one query_id (requires trace_log with memory samples)
SELECT arrayStringConcat(arrayReverse(arrayMap(x -> demangle(addressToSymbol(x)), trace)), ';') AS stack,
       sum(size) AS bytes
FROM system.trace_log
WHERE trace_type = 'MemorySample' AND query_id = {qid:String}
GROUP BY trace ORDER BY bytes DESC LIMIT 20;
On 26.8 the fixes, in advanced ClickHouse troubleshooting for memory, are settings before hardware. max_bytes_ratio_before_external_group_by defaults to 0.5, so a GROUP BY can already spill at half the query’s memory limit; the reason it did not is usually that max_memory_usage itself is unset for that user, so there is nothing to spill against. Set a per-role limit and the spill engages.
For joins, join_algorithm defaults to direct,parallel_hash,hash,ie_join; adding grace_hash for the reporting role lets a large-right-side join finish slowly instead of not at all. The composite LowCardinality GROUP BY that took 18.3 s and 9.5 GB in our lab is the shape to look for: two low-cardinality keys serialised into one composite key defeats the fixed-width fast path, and a materialized view keyed on both columns is the durable fix.
Every setting in this section is a session or profile setting: apply it with ALTER ROLE ... SET or in a settings profile, verify with SELECT rolname, rolconfig equivalents in system.settings_profile_elements, and roll it back by removing the element. None of it needs a server restart.
Technique 4
Advanced ClickHouse troubleshooting on the write side: too many parts, stuck merges and the disk-full incident we caused ourselves
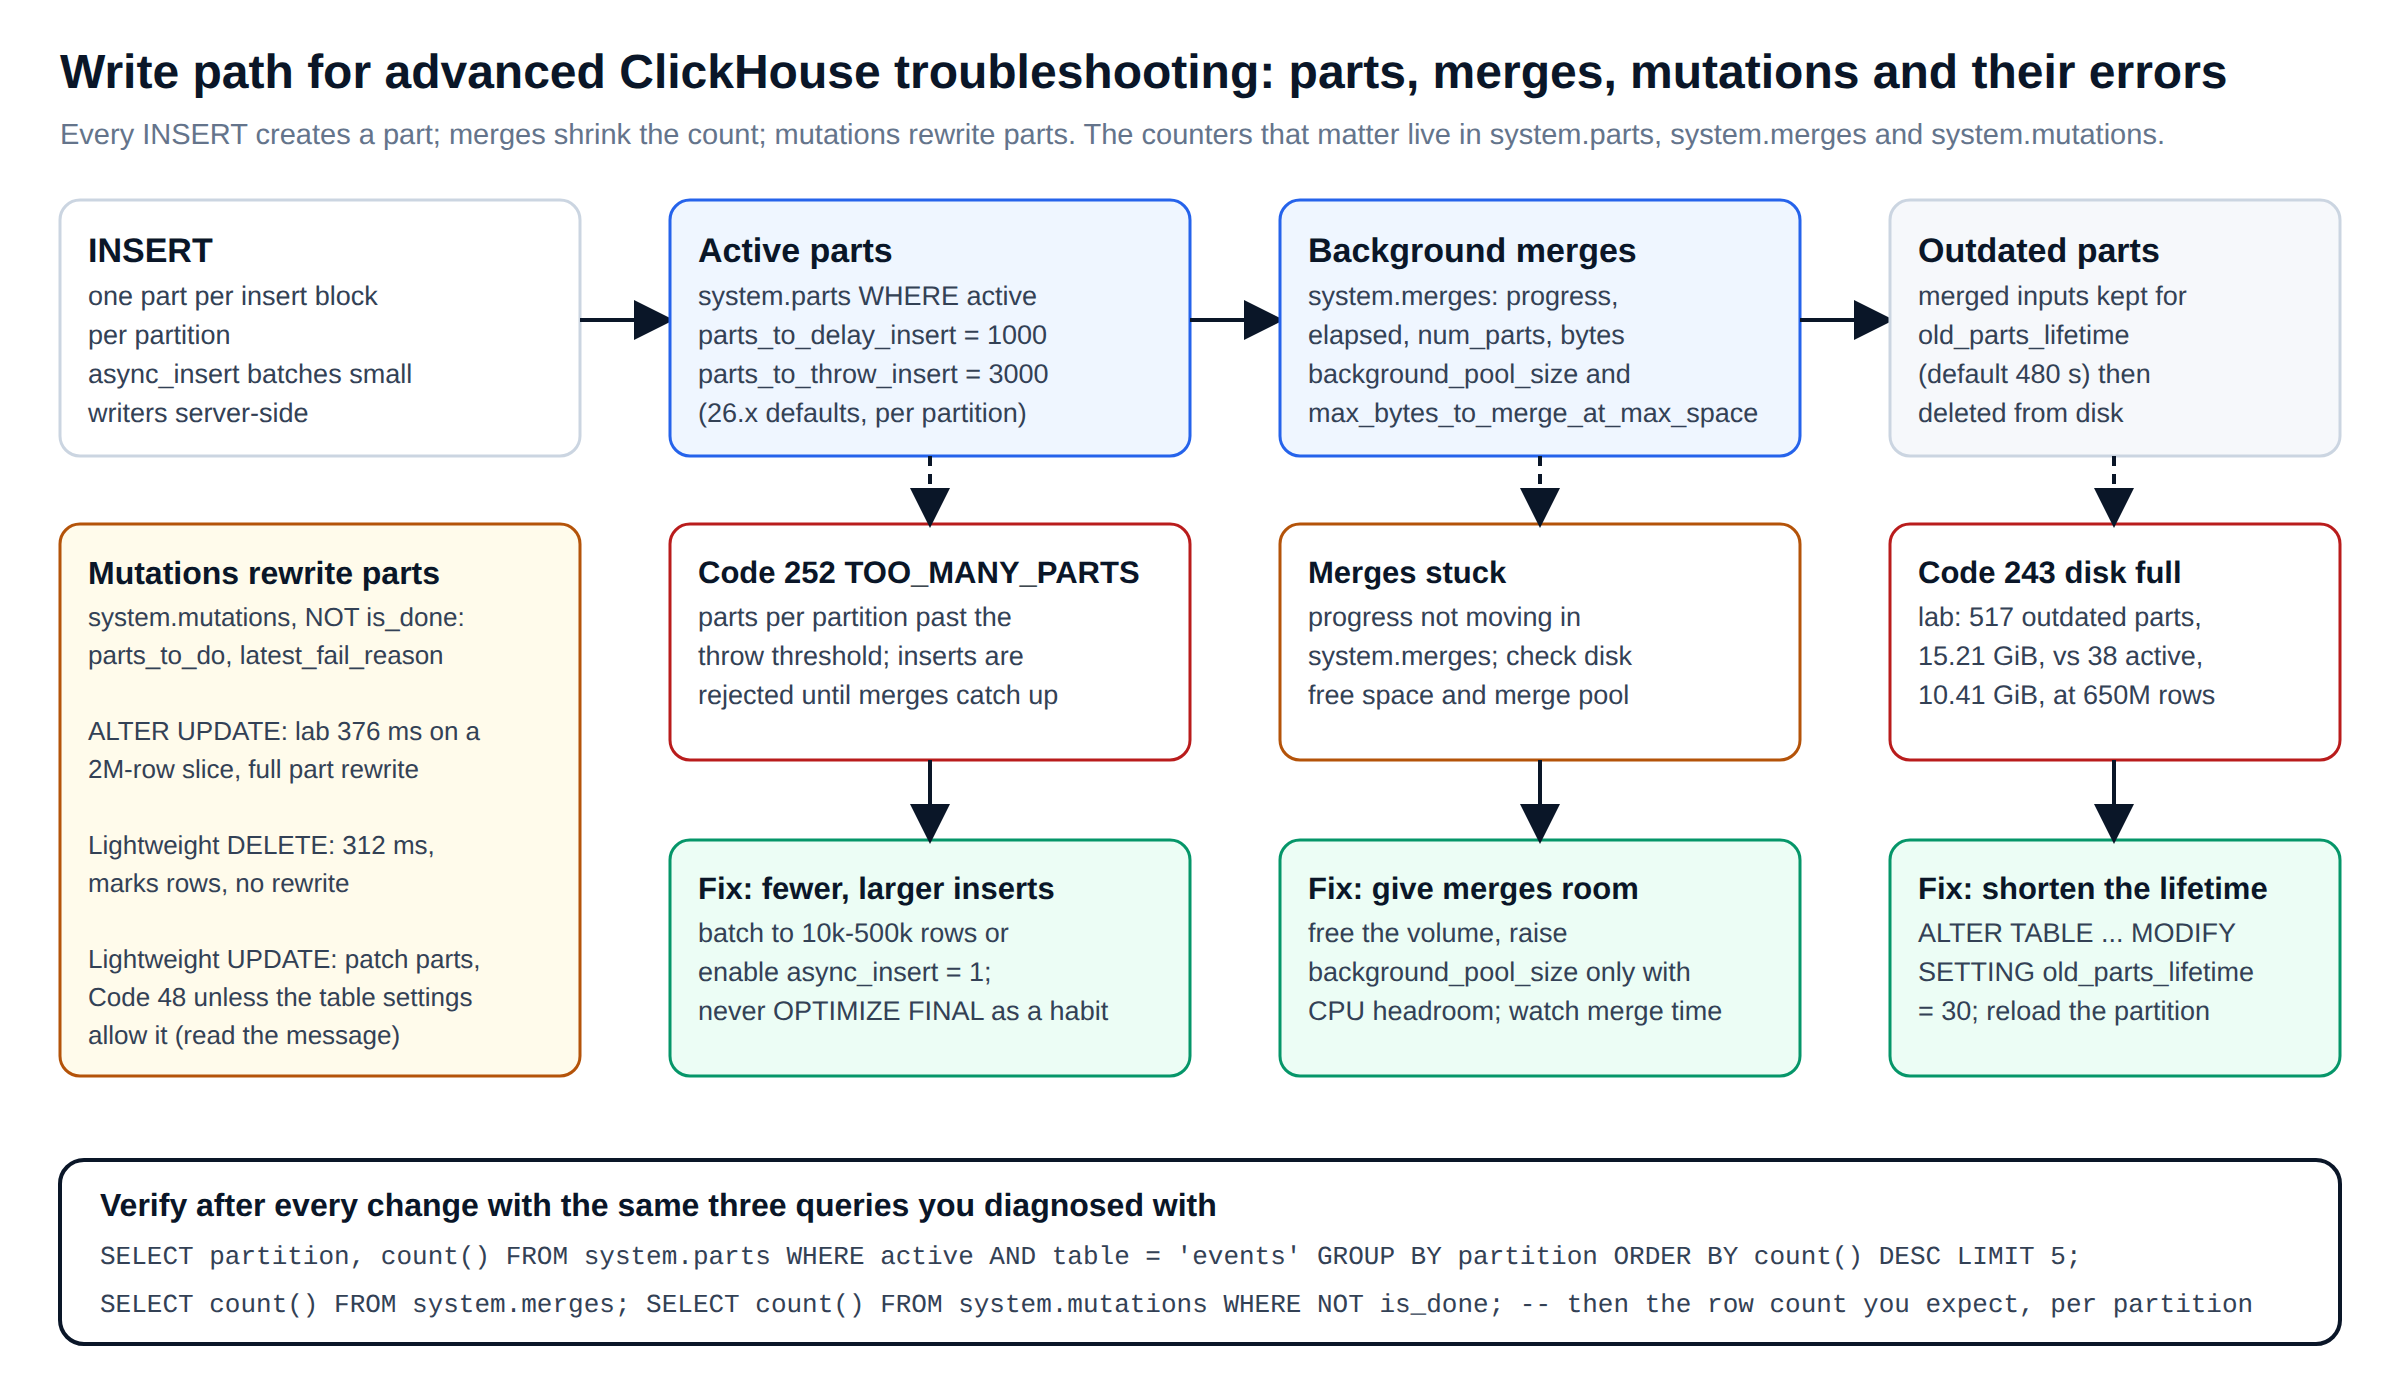
Parts are the unit of everything in MergeTree, so most of advanced ClickHouse troubleshooting on the write side is counting them. parts_to_delay_insert and parts_to_throw_insert (defaults 1,000 and 3,000 per partition on current builds; check your system.merge_tree_settings) are the guard rails, and Code: 252. DB::Exception: Too many parts means inserts arrived faster than merges could fold them. The query to run is not “how many parts” but “how many parts per partition, and are merges making progress”:
SELECT database, table, partition, count() AS parts, sum(rows) AS rows,
       formatReadableSize(sum(bytes_on_disk)) AS size, max(modification_time) AS newest_part
FROM system.parts WHERE active
GROUP BY database, table, partition
HAVING parts > 100 ORDER BY parts DESC LIMIT 20;

SELECT database, table, elapsed, round(progress, 2) AS progress, num_parts,
       formatReadableSize(total_size_bytes_compressed) AS size, is_mutation
FROM system.merges ORDER BY elapsed DESC;
Here is the incident, included because articles on advanced ClickHouse troubleshooting rarely show their authors’ own mistakes. Loading the 1,000,000,000-row lab table on 26.8.11.7, the fourteenth of twenty 50-million-row batches failed with Code: 243. DB::Exception: Cannot reserve 26.52 MiB, not enough space. (NOT_ENOUGH_SPACE). The active parts held 10.4 GiB; the disk showed 39 GB used. The gap was outdated parts: merges had already produced larger parts, but the source parts they replaced were still on disk waiting out old_parts_lifetime, which defaults to 480 seconds, and on a box with 30 GB free that was enough to run out.
-- The signal: outdated parts still holding disk
SELECT active, count() AS parts, formatReadableSize(sum(bytes_on_disk)) AS on_disk, sum(rows) AS rows
FROM system.parts WHERE database = 'lab' AND table = 'events'
GROUP BY active;
-- 0 (outdated)  517 parts  15.21 GiB
-- 1 (active)     38 parts  10.41 GiB

-- The change, table-scoped, reversible, no restart
ALTER TABLE lab.events MODIFY SETTING old_parts_lifetime = 30;
-- rollback: ALTER TABLE lab.events RESET SETTING old_parts_lifetime;
Ninety seconds later the outdated parts were gone and the load resumed. The second lesson cost us more: the failed batch had inserted 6.67 million rows before the error, so a naive re-run produced 1,006,671,718 rows. We found it by comparing per-partition row counts against what the generator should produce, dropped the one partition that was over, reloaded exactly its number range and verified the count before running a single measurement. The rule we took from it: after any failed load, reconcile per partition before you resume, because INSERT into MergeTree is atomic per block, not per statement.
Two more things from the same afternoon. OPTIMIZE TABLE ... FINAL returned in 40 seconds and silently left three partitions with ten parts each because there was not enough disk to merge them; the only evidence was in system.parts, not in the client. And merging a partition needs roughly its own size in free space, so on a tight disk merge one partition at a time with OPTIMIZE TABLE ... PARTITION and wait for cleanup between them.
Technique 5
Replication and Keeper troubleshooting: read last_exception before you restart anything
A replica that is lagging or read-only almost always says why, and this part of advanced ClickHouse troubleshooting is mostly about reading it before acting. system.replication_queue carries the failing entry with its retry count and the exception text; system.replicas carries the delay and the read-only flag. The mistake we see most is SYSTEM RESTART REPLICA as a first move, which clears the symptom for a few minutes and destroys the evidence.
SELECT database, table, type, num_tries, last_exception, create_time, postpone_reason
FROM system.replication_queue
WHERE last_exception != '' OR num_tries > 10
ORDER BY num_tries DESC LIMIT 20;

SELECT database, table, is_readonly, is_session_expired, absolute_delay,
       queue_size, inserts_in_queue, merges_in_queue, log_max_index - log_pointer AS behind
FROM system.replicas
WHERE is_readonly OR absolute_delay > 60 OR queue_size > 100;
When the exception mentions Keeper (session expired, connection loss, operation timeout), advanced ClickHouse troubleshooting moves to Keeper itself. The four-letter mntr command and, on 26.x, system.zookeeper_connection give the latency and outstanding-request numbers; average latency above roughly 10 ms under insert load, or a rising outstanding count, means Keeper is sharing disks or hosts with the data nodes, or receiving too many small inserts. 26.8 adds an LSM-tree storage mode for Keeper with an optional disk-persistence path, and the changelog reports 4x faster startup from concurrent changelog reading, which shortens the window during a Keeper restart; neither replaces the two rules that fix most Keeper incidents, which are dedicated hosts and fewer, larger inserts.
echo mntr | nc ${KEEPER_HOST} 9181 | egrep 'zk_avg_latency|zk_max_latency|zk_outstanding_requests|zk_znode_count|zk_server_state'
SELECT * FROM system.zookeeper_connection;   -- host, port, session_uptime_elapsed_seconds, keeper_api_version
Technique 6
Advanced ClickHouse troubleshooting for mutations that never finish, and the lightweight alternatives on 26.8
Mutations are the part of advanced ClickHouse troubleshooting where patience is usually the wrong instinct. ALTER TABLE ... UPDATE and DELETE rewrite every affected part, and on a large table a mutation that waits behind merges can sit for hours with nothing wrong except the queue. system.mutations tells you which it is: parts_to_do decreasing slowly is a capacity problem, latest_fail_reason set is a correctness problem, and a mutation with a failing reason blocks every mutation behind it on that table.
SELECT database, table, mutation_id, command, create_time, parts_to_do, is_done,
       latest_failed_part, latest_fail_time, latest_fail_reason
FROM system.mutations WHERE NOT is_done ORDER BY create_time;

-- After reading the reason, and only then:
KILL MUTATION WHERE database = 'lab' AND table = 'events' AND mutation_id = '{id}';
On 26.8 the alternatives are worth knowing before the mutation is written, because advanced ClickHouse troubleshooting of mutations is easiest when there is no mutation. Lightweight DELETE FROM ... WHERE marks rows instead of rewriting parts and took 312 ms on a 2-million-row slice in our lab.
Lightweight UPDATE ... SET uses patch parts, and 26.8 moves those to a v2 on-disk format; it is not available on every table, and the error is explicit about why. When we tried it on a table created with defaults the server returned Code: 48 ... Lightweight updates are not supported. Lightweight updates are supported only for ... and named the table settings it needs. Read the full message on your own build rather than a summary, because it is the documentation.
For bulk restatements, ALTER TABLE ... REPLACE PARTITION from a rebuilt table remains the cleanest tool of all: no mutation, no patch parts, one atomic swap and a validation query on either side of it.
Technique 7
Advanced ClickHouse troubleshooting at 100 percent CPU with nothing slow in the log: trace_log and the merge pool
Sometimes the query log is innocent, and advanced ClickHouse troubleshooting has to move down a layer. A node pinned at full CPU with every query under a second is either running many small queries that are individually fine and collectively not, or doing background work. system.processes shows the first; system.merges the second; and system.trace_log with flameGraph settles it in one query.
-- Who owns the CPU samples in the last five minutes?
SELECT query_id, count() AS samples, any(user) AS user
FROM system.trace_log
WHERE trace_type = 'CPU' AND event_time > now() - INTERVAL 5 MINUTE
GROUP BY query_id ORDER BY samples DESC LIMIT 10;

-- A flame graph of the busiest one, straight from SQL
SELECT arrayStringConcat(arrayReverse(arrayMap(x -> demangle(addressToSymbol(x)), trace)), ';') AS stack, count() AS samples
FROM system.trace_log
WHERE trace_type = 'CPU' AND query_id = {qid:String}
GROUP BY trace ORDER BY samples DESC LIMIT 30
SETTINGS allow_introspection_functions = 1;
If the top of the stack is decompression, the fix is usually the codec on a hot column, which is exactly the trade we measured last week: tuned ZSTD and T64 codecs cut the lab table from 15.83 GiB to 8.70 GiB and made a scan 76 percent slower on a two-core box, because the decode had nowhere to run.
If the top is aggregation, technique 3 applies. If no query owns the samples and system.merges is busy, the merge pool is the workload; size background_pool_size and max_bytes_to_merge_at_max_space_in_pool from the observed merge rate, and keep the largest merges out of business hours with a scheduled SYSTEM STOP MERGES window only if you have first confirmed the parts count can absorb it.
Technique 8
Advanced ClickHouse troubleshooting: benchmarks that lie: the query condition cache and lazy materialization
Two defaults on 26.x make careless measurements wrong in opposite directions in advanced ClickHouse troubleshooting. The query condition cache, on by default since 25.3, remembers which granules failed a predicate; the second run of a filter that scanned 1,000,000,000 rows in 1,577 ms on our lab table took 12 ms. Anyone who runs a query three times and reports the best run is reporting the cache, not the engine. Disable it per query when measuring, and remember that 26.8 extends it to ORDER BY ... LIMIT as well.
-- Cold measurement discipline in advanced ClickHouse troubleshooting on 26.x
SYSTEM DROP MARK CACHE;
SYSTEM DROP UNCOMPRESSED CACHE;
SYSTEM DROP QUERY CONDITION CACHE;
SELECT count(), avg(latency_ms) FROM lab.events WHERE user_id = 4200042
SETTINGS use_query_condition_cache = 0, log_queries = 1, query_id = 'cold-run-1';
Lazy materialization cuts the other way in advanced ClickHouse troubleshooting: a SELECT * ... ORDER BY ... LIMIT 10 that takes 3.2 s with the default on takes 11.5 s with it off, so a customer who has the setting disabled in a legacy profile will report a slowness that a fresh install cannot reproduce. When a complaint does not reproduce, diff the two sessions’ Settings maps from system.query_log before anything else. It is the cheapest step in advanced ClickHouse troubleshooting there is, and it closes more tickets than any other single query in this article.
Technique 9
Advanced ClickHouse troubleshooting as a shared practice: give the application team their own log, and keep yours
The most durable improvement to advanced ClickHouse troubleshooting on 26.8 is organisational. With system.user_query_log, an application team can be granted a view of their own history, so the first question in every incident, “what exactly did you run”, answers itself. With system.session_query_ids on 26.9, the second question, “which of the two hundred rows in the log is your request”, also answers itself. Pair them with retention you have decided rather than inherited:
-- Keep the evidence, bound the disk (server config, applied at restart or via SYSTEM RELOAD CONFIG where supported)
<query_log>
    <database>system</database><table>query_log</table>
    <engine>ENGINE = MergeTree PARTITION BY toYYYYMM(event_date) ORDER BY (event_date, event_time) TTL event_date + INTERVAL 30 DAY</engine>
</query_log>
<trace_log>
    <database>system</database><table>trace_log</table>
    <engine>ENGINE = MergeTree PARTITION BY toYYYYMM(event_date) ORDER BY (event_date, event_time) TTL event_date + INTERVAL 7 DAY</engine>
</trace_log>
Thirty days of query_log and seven of trace_log cover every incident we have worked this year in advanced ClickHouse troubleshooting; adjust the numbers to your disk, but do not set them to zero. The one thing no release can add back is the row that was never written.
Checklist
The checklist for advanced ClickHouse troubleshooting we leave with every customer
| Question | Query or command | What a bad answer looks like |
|---|---|---|
| Which shapes cost the most? | Fingerprints by total time from system.query_log | Rows read per row returned in the millions |
| Is the sort key used? | EXPLAIN indexes = 1 | Granules read close to total; generic exclusion search |
| Who is holding memory? | peak_memory_usage per fingerprint; memory samples in trace_log | One hash-table operator near the limit |
| Are merges keeping up? | system.parts per partition; system.merges | Parts per partition climbing; progress not moving |
| Is disk being held by the past? | system.parts WHERE NOT active; system.disks | Outdated bytes larger than active bytes |
| Why is the replica behind? | system.replication_queue, system.replicas | last_exception set; num_tries rising |
| Is Keeper healthy? | mntr; system.zookeeper_connection | Average latency above 10 ms; outstanding requests rising |
| Is a mutation stuck? | system.mutations WHERE NOT is_done | latest_fail_reason set |
| Does the complaint reproduce? | Diff Settings between the two sessions’ log rows | Different max_threads, cache or lazy-materialization settings |
Every query above runs on 26.8.11.7 LTS as written. Names of merge-tree settings and their defaults vary by build; read yours from system.merge_tree_settings before relying on a number in this article.
Further reading
Further reading
- Why ClickHouse is so fast: seven design choices measured on a billion rows, re-validated on 26.8 LTS
- ChistaDATA Break Fix engineering services for ClickHouse
- ClickHouse Enterprise Support, 24×7×365
- ClickHouse release 26.8 and the 26.9 release call
- system.query_log, system.trace_log and system.replication_queue in the ClickHouse documentation
ChistaDATA Inc. is not affiliated with ClickHouse, Inc. ClickHouse® is a registered trademark of ClickHouse, Inc.
Next step
When the map for advanced ClickHouse troubleshooting runs out, the desk is on
ChistaDATA has engineers doing advanced ClickHouse troubleshooting in production around the clock: a Severity 1 reaches a senior ClickHouse engineer in fifteen minutes, with the same system tables, the same discipline and a written root cause at the end. If you would rather have the method than the desk, the ChistaDATA University troubleshooting track teaches it on your own cluster.
Running ClickHouse in production? ChistaDATA provides ClickHouse consulting for architecture, performance and migrations, and 24×7 ClickHouse support with a 15-minute S1 response. For day-to-day operations see ClickHouse DBA services and ClickHouse managed services.
