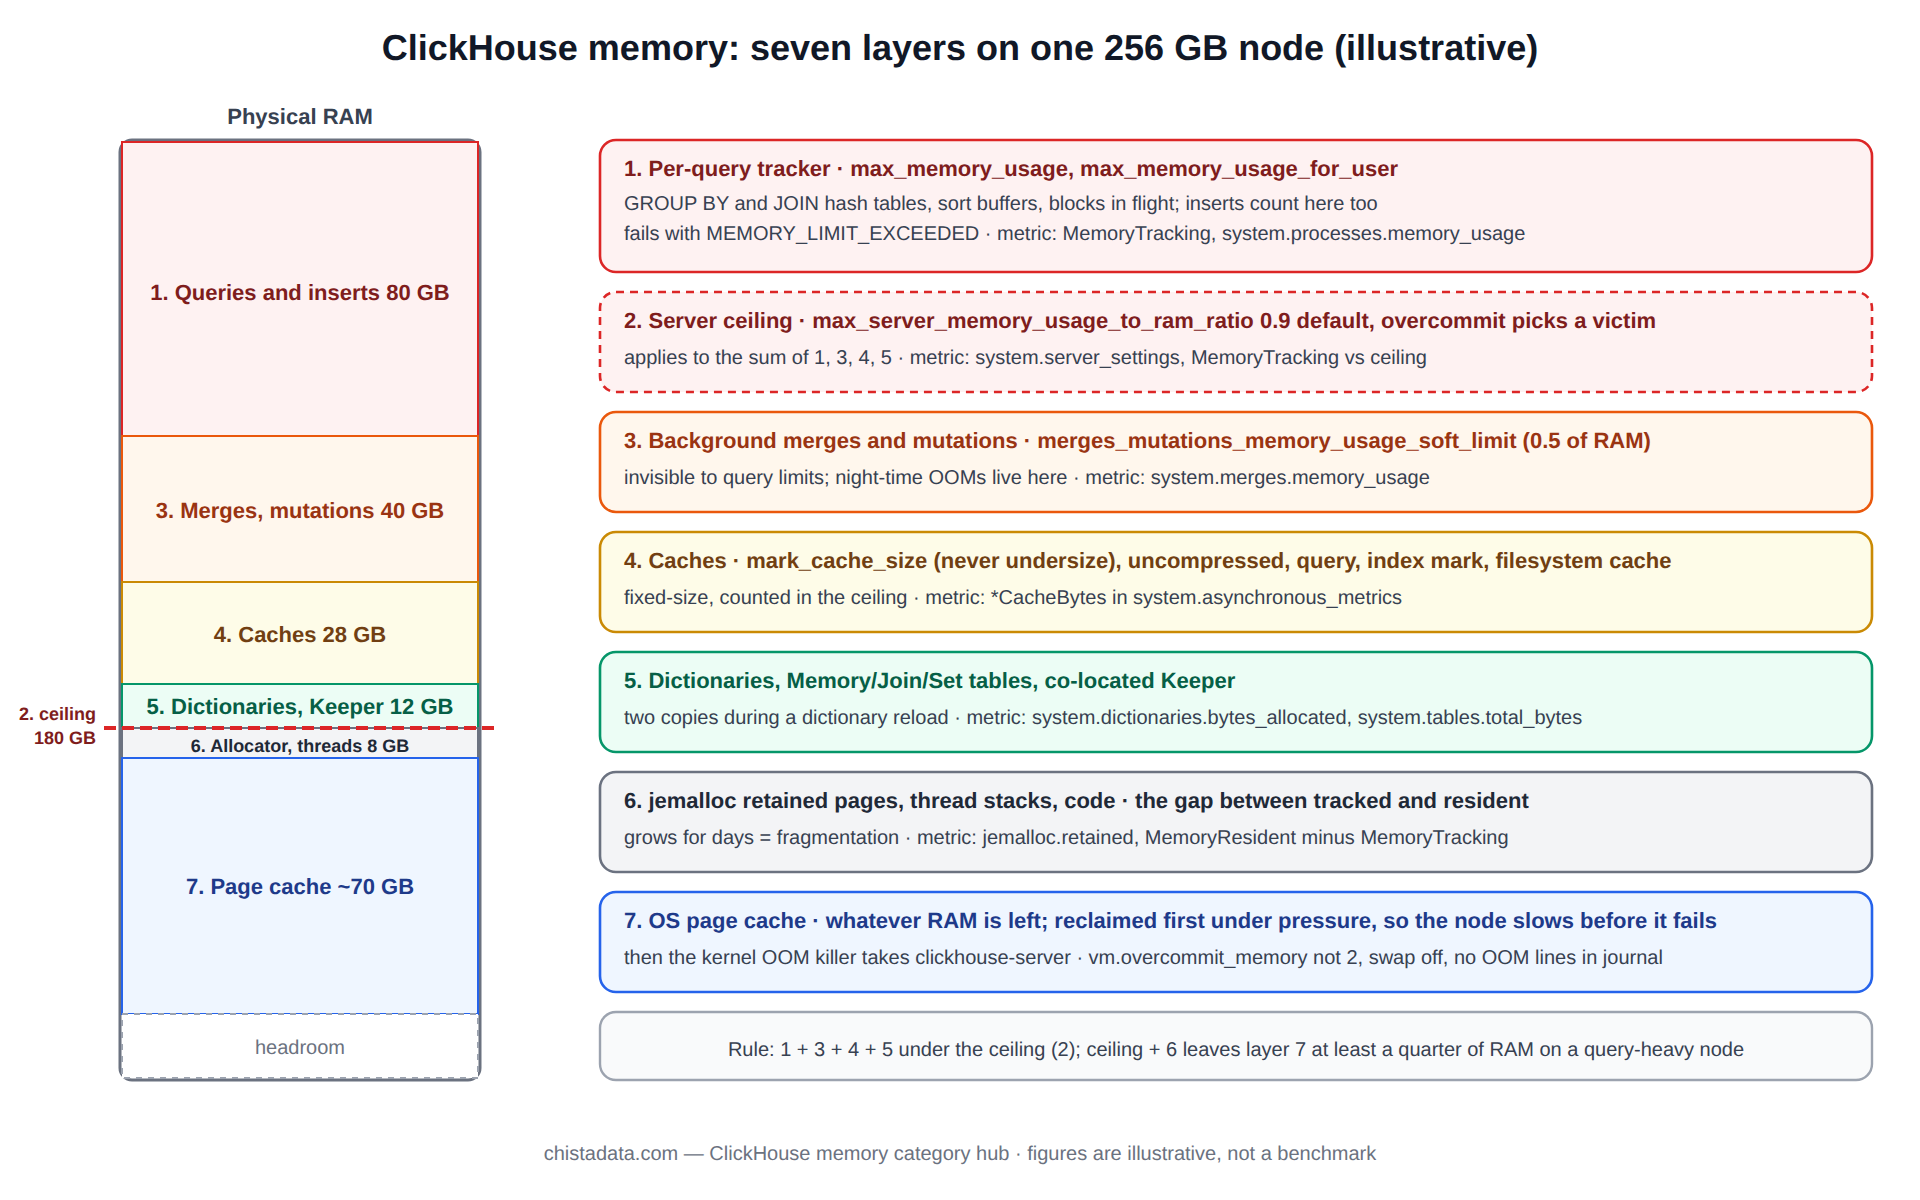
ClickHouse memory is not one pool with one limit. It is seven layers, each with its own allocator behaviour, its own limit setting and its own failure signature, stacked on top of a Linux kernel that has opinions of its own about overcommit and about which process to kill when RAM runs out. Most memory incidents on client clusters trace to one of two mistakes: treating max_memory_usage as the server’s total, or letting the sum of the layers exceed what the kernel will actually give.
This page walks the seven layers from the top of a query down to the page cache, names the setting and the metric for each, and ends with the capacity worksheet we use to size a node.
The posts in this category cover the individual pieces: how memory management works, overcommit, the OOM killer, tuning max_memory_usage and max_bytes_before_external_*, reducing query memory, wait events and the 26.8 LTS settings review. This page is the model that connects them.
Layer one: per-query ClickHouse memory and the tracker
Every query runs under a ClickHouse memory tracker that counts allocations and compares them to max_memory_usage. The count is what the query has asked the allocator for, not resident pages, so it can differ from what top shows. When the tracker exceeds the limit the query is cancelled with MEMORY_LIMIT_EXCEEDED, which is the most common exception on analytical clusters and the least dangerous, because it is ClickHouse protecting the node rather than the kernel doing it.
SELECT
    query_id,
    user,
    elapsed,
    formatReadableSize(memory_usage)      AS mem_now,
    formatReadableSize(peak_memory_usage) AS mem_peak,
    substring(query, 1, 80)               AS q
FROM system.processes
ORDER BY memory_usage DESC
LIMIT 10;

-- Which stage of a finished query allocated the most
SELECT
    query_id,
    formatReadableSize(memory_usage) AS peak,
    ProfileEvents['ExternalAggregationWritePart'] AS spilled_agg_parts,
    ProfileEvents['ExternalSortWritePart']        AS spilled_sort_parts
FROM system.query_log
WHERE type = 'QueryFinish' AND event_date = today()
ORDER BY memory_usage DESC
LIMIT 10;
What consumes this layer is hash tables for GROUP BY and JOIN, sort buffers, and the blocks in flight through the pipeline, which scale with max_threads and max_block_size. The archive post Reduce query memory usage in ClickHouse covers the query-side levers; the ClickHouse SQL engineering hub covers the rewrites that remove the need.
Layer two: per-user and server-wide ClickHouse memory limits
Above the query sits max_memory_usage_for_user, the sum across a user’s concurrent queries, and above that the server-wide max_server_memory_usage, which defaults to 90 percent of RAM through max_server_memory_usage_to_ram_ratio. When a query would push the server total past that line it fails even if its own limit has room. Since 22.x, memory overcommit adds a softer step: when the server limit is reached, ClickHouse picks the query with the largest overcommit ratio and asks it to stop, waiting memory_overcommit_ratio_denominator and memory_usage_overcommit_max_wait_microseconds before doing so. The archive’s ClickHouse’s memory overcommit explains the selection.
CREATE SETTINGS PROFILE dashboard SETTINGS
    max_memory_usage = 8000000000 READONLY,           -- 8 GB per query
    max_memory_usage_for_user = 24000000000 READONLY, -- 24 GB across the user's queries
    max_bytes_before_external_group_by = 4000000000,
    max_bytes_before_external_sort = 4000000000,
    memory_overcommit_ratio_denominator = 1073741824;

SELECT name, value FROM system.server_settings
WHERE name IN ('max_server_memory_usage', 'max_server_memory_usage_to_ram_ratio',
               'merges_mutations_memory_usage_soft_limit', 'merges_mutations_memory_usage_to_ram_ratio');
Layer three: ClickHouse memory for background merges and mutations
Merges allocate ClickHouse memory to read the parts they combine and to build the output, and mutations allocate more because they rewrite whole parts. This layer is invisible to per-query limits and is bounded by merges_mutations_memory_usage_soft_limit, which defaults to half of RAM through its ratio setting. A node that is fine at 60 percent memory during the day and OOMs at night is usually running large scheduled merges or a mutation on top of a memory-heavy report.
SELECT
    database, table,
    round(elapsed)                           AS elapsed_s,
    formatReadableSize(memory_usage)         AS mem,
    is_mutation,
    num_parts,
    formatReadableSize(total_size_bytes_compressed) AS input
FROM system.merges
ORDER BY memory_usage DESC;
Layer four: the caches ClickHouse manages
The mark cache, uncompressed cache, query cache, index mark cache, and the filesystem cache for object storage are all fixed-size server settings and are counted in the server total. The mark cache, mark_cache_size, defaults to 5 GB and is the one that must never be undersized, because a miss costs a disk read per column per part. The uncompressed cache is off by default and rarely worth turning on. The filesystem cache is sized per disk in the storage configuration and can be tens of gigabytes on an S3-backed node.
SELECT metric, formatReadableSize(value) AS size
FROM system.asynchronous_metrics
WHERE metric IN ('MarkCacheBytes', 'UncompressedCacheBytes', 'QueryCacheBytes',
                 'IndexMarkCacheBytes', 'FilesystemCacheBytes', 'MMapCacheCells');
Layer five: dictionaries, in-memory tables and Keeper
External dictionaries with the hashed, complex_key_hashed or flat layouts live entirely in RAM and are reloaded on their lifetime, which means two copies exist during a reload. Memory, Join and Set engine tables are RAM-resident by definition. And a ClickHouse Keeper process co-located on a data node holds its whole state in memory. None of these show up in query memory and all of them show up in MemoryResident.
SELECT name, type, formatReadableSize(bytes_allocated) AS ram, element_count, last_successful_update_time
FROM system.dictionaries
ORDER BY bytes_allocated DESC;

SELECT database, name, engine, formatReadableSize(total_bytes) AS ram
FROM system.tables
WHERE engine IN ('Memory', 'Join', 'Set')
ORDER BY total_bytes DESC;
Layer six: allocator overhead, the gap between tracked and resident ClickHouse memory
ClickHouse uses jemalloc, which keeps freed memory in arenas for reuse rather than returning it to the kernel immediately. The gap between MemoryTracking, what the trackers think is in use, and MemoryResident, what the kernel has mapped, is mostly jemalloc’s retained pages plus thread stacks and code. A gap of a few gigabytes is normal; a gap that grows for days is fragmentation, and the archive’s How ClickHouse memory management works and How memory management happens in ClickHouse cover the jemalloc side, including jemalloc.background_thread and purging.
SELECT metric, formatReadableSize(value) AS v
FROM system.asynchronous_metrics
WHERE metric IN ('MemoryResident', 'MemoryVirtual', 'MemoryCode', 'MemoryShared',
                 'jemalloc.resident', 'jemalloc.allocated', 'jemalloc.retained', 'jemalloc.active')
ORDER BY metric;

SELECT formatReadableSize(value) AS tracked FROM system.metrics WHERE metric = 'MemoryTracking';
Layer seven: the page cache and the kernel
Everything the server reads from disk passes through the page cache, which the kernel sizes as whatever RAM is left. This is the layer that makes ClickHouse fast on a warm cluster and it is the first thing the kernel reclaims under pressure, so a node whose server total approaches physical RAM does not fail immediately; it gets slow first, as the working set is evicted, and then fails. The ClickHouse performance IO hub covers the read side.
On the ClickHouse memory side, the rule is that the server total, layers one through six, should leave at least a quarter of RAM for the page cache on a query-heavy node.
When it does fail, it is the kernel OOM killer that acts, and it acts on the largest process, which is clickhouse-server. The archive post How to avoid the Linux OOM killer on ClickHouse covers the kernel settings; the two that matter are vm.overcommit_memory, which should not be 2 on a ClickHouse node, and swap, which should be off, because a swapping ClickHouse is slower than a restarted one.
sysctl vm.overcommit_memory vm.swappiness
free -g
journalctl -k --since "-7d" | grep -i -E "out of memory|oom-kill|Killed process"
# expected: overcommit_memory = 0 or 1, swappiness low or swap disabled, no OOM lines
ClickHouse memory on the insert path
Inserts are queries too, and they allocate under the same tracker. A native batch insert holds one block, sorted and compressed, which for a million wide rows can be several gigabytes; max_insert_block_size is the lever. Asynchronous inserts hold a per-table buffer up to async_insert_max_data_size, multiplied by the number of tables and shapes being written.
Materialized views multiply the insert’s memory by the number of views if parallel_view_processing is on, because each view’s GROUP BY hash table is built concurrently. And a Kafka engine table holds kafka_num_consumers blocks of kafka_max_block_size rows before flushing. The ClickHouse ingestion hub covers the batching decisions; the memory rule is that concurrent inserters count against layer one exactly as dashboards do, and must be in the worksheet.
Distributed queries: where ClickHouse memory lands on a cluster
A query over a Distributed table runs on every shard and merges on the initiator. Each shard allocates for its own scan and partial aggregation; the initiator allocates for the merged hash table, which is the sum of the shards’ groups, and for the final sort. A GROUP BY on a high-cardinality key therefore lands its full memory cost on one node, the initiator, while the shards stay light.
distributed_aggregation_memory_efficient = 1, on by default since 21.x, streams partial results in bucket order so the initiator holds one bucket at a time, and max_memory_usage applies per node, not per query across the cluster. Route heavy reports through a dedicated initiator or a query node with more RAM, and keep the data nodes’ layer one small.
-- Per-node memory for one distributed query, from the initiator
SELECT
    hostName()                                AS host,
    formatReadableSize(max(memory_usage))     AS peak
FROM clusterAllReplicas('analytics_cluster', system.query_log)
WHERE initial_query_id = '${QUERY_ID}' AND type = 'QueryFinish'
GROUP BY host
ORDER BY peak DESC;
ClickHouse memory settings: value, unit and reload rule
The settings below are the ones that appear in every review. Query-level and profile-level settings apply to new sessions immediately. Server-level settings in config.xml or config.d are reloaded on the fly for the cache sizes and the memory ratios since 23.x, and require a restart for the allocator settings.
| Setting | Scope | Unit | Default | Reload | Governs |
|---|---|---|---|---|---|
max_memory_usage | query / profile | bytes | 0 (unlimited) in the default profile | next session | Layer one |
max_memory_usage_for_user | profile | bytes | 0 | next session | Layer two, per user |
max_server_memory_usage_to_ram_ratio | server | ratio | 0.9 | config reload | Layer two, server |
merges_mutations_memory_usage_to_ram_ratio | server | ratio | 0.5 | config reload | Layer three |
mark_cache_size | server | bytes | 5 GiB | config reload | Layer four |
max_bytes_before_external_group_by | query / profile | bytes | 0 (off) | next session | Spill for layer one |
max_bytes_before_external_sort | query / profile | bytes | 0 (off) | next session | Spill for layer one |
memory_overcommit_ratio_denominator | query / profile | bytes | 1 GiB | next session | Overcommit selection |
max_insert_block_size | query / profile | rows | 1,048,449 | next session | Insert-path layer one |
The ClickHouse memory capacity worksheet
The worksheet below is how we size a node or diagnose an existing one. The figures are illustrative for a 256 GB node serving dashboards and streaming inserts; the real values come from the queries on this page run against the cluster over a week.
| Layer | Setting or source | Illustrative allocation on 256 GB | Metric to verify |
|---|---|---|---|
| 1. Queries, concurrent | max_memory_usage × expected concurrency | 8 GB × 10 = 80 GB | MemoryTracking, system.processes |
| 2. Server ceiling | max_server_memory_usage | 180 GB (70 %) | system.server_settings |
| 3. Merges and mutations | merges_mutations_memory_usage_soft_limit | 40 GB | system.merges.memory_usage |
| 4. Caches | mark_cache_size and others | 8 GB mark, 20 GB filesystem cache | *CacheBytes asynchronous metrics |
| 5. Dictionaries, memory tables, Keeper | system.dictionaries, system.tables | 12 GB | bytes_allocated, total_bytes |
| 6. Allocator, threads, code | jemalloc retained plus overhead | 8 GB | jemalloc.retained, MemoryResident minus tracked |
| 7. Page cache | Whatever remains | About 70 GB | OSMemoryFreeWithoutCached, OSMemoryCached |
The sum of layers one, three, four and five must sit under layer two, and layer two plus six must leave layer seven with room. When the arithmetic does not close, the choices are fewer concurrent queries, spill-to-disk settings on the heavy ones, smaller dictionaries with the sparse_hashed or cache layout, or more RAM. The archive post How to configure ClickHouse for optimal usage of available RAM works through a sizing in full, and Tuning max_memory and max_bytes settings covers the spill thresholds.
Three ClickHouse memory anti-patterns we remove on every review
The first is an unlimited default profile. A max_memory_usage of zero means one analyst’s exploratory join can take the node to the server ceiling and trigger overcommit against the streaming inserts. Every profile gets a limit, and the default profile gets the smallest one.
The second is a mark cache left at 5 GB on a node with tens of thousands of parts; the cache thrashes, every query pays mark reads, and the node looks CPU-bound. Size it from MarkCacheFiles against the total part count.
The third is a co-located Keeper with no memory reservation of its own, so that a merge storm on the data node starves Keeper and every replicated table goes read-only at once, which the monitoring hub’s rule two then catches after the fact rather than before.
Reading a ClickHouse memory incident
The order of investigation follows the layers in reverse. If the process was killed, the kernel log says so and layer seven is the story: the server total exceeded RAM, and the question is which of layers one through six grew. If the process is alive and queries are failing with MEMORY_LIMIT_EXCEEDED, it is layer one or two, and system.query_log names the query and the peak.
If nothing is failing but the node is slow, compare MemoryResident to the server ceiling and the page cache to its usual size: a shrinking page cache with a stable tracked total is layer six growing, and a jemalloc purge or a scheduled restart is the fix. The archive’s Understanding ClickHouse wait events and Inadequate ClickHouse system resources cover the symptoms in more depth.
-- The one query to run first in a memory incident
SELECT
    toStartOfFiveMinutes(event_time)                         AS t,
    formatReadableSize(max(value))                           AS peak_resident
FROM system.asynchronous_metric_log
WHERE metric = 'MemoryResident' AND event_time >= now() - INTERVAL 6 HOUR
GROUP BY t
ORDER BY t;
What a healthy node looks like
On a node that is sized correctly, MemoryResident sits at a stable plateau well under the server ceiling with a daily rhythm that follows the workload, the page cache holds the hot working set so repeated dashboard queries read almost nothing from disk, MEMORY_LIMIT_EXCEEDED appears only for the exploratory queries it was meant to stop, and the kernel log has no OOM lines for the lifetime of the deployment. That is the target the worksheet is written against.
Version notes
Memory overcommit is 22.x and later. merges_mutations_memory_usage_soft_limit arrived in 23.x. system.server_settings is 23.x. The max_server_memory_usage_to_ram_ratio default of 0.9 has held across the 24.x, 25.x and 26.x lines. Confirm the running version before relying on any of these defaults; the ClickHouse server settings documentation is the reference.
Reading the archive
Start with the two memory-management posts for the allocator model, then How to configure the global process area in ClickHouse and the RAM-usage post for sizing, and the OOM-killer post before the first production deployment. Essential ClickHouse metrics lists the memory metrics that belong on the dashboard, and the ClickHouse monitoring hub gives them thresholds.
Keep the worksheet as a living document per cluster. Re-run the seven queries quarterly, or after any change to concurrency, dictionaries or storage tiering, and compare against the previous run; ClickHouse memory problems announce themselves months ahead in that comparison, as a layer that has been growing quietly.
ChistaDATA’s ClickHouse consulting practice runs this seven-layer worksheet as part of every capacity review, and 24×7 ClickHouse support handles the OOM restarts and the memory-limit storms in between. Apply every limit change on staging under a replayed workload first, change one layer at a time, and keep the previous values recorded so a rollback is a config edit rather than a search.