Most of the performance you get from a ClickHouse upgrade does not come from a feature you switch on. It comes from a default that quietly flipped, and whether that flip helps or hurts depends on a workload the release engineers have never seen. We have now taken 26.8 LTS through our lab cluster and two customer staging estates, and this post is the settings-level view of that work: which ClickHouse performance settings changed between 26.3 LTS and 26.8 LTS, what each one does to the execution pipeline, how to measure the effect on your own cluster, and the rollout discipline we use so that a default flip never becomes an incident.
We have already written about the architecture-level changes in 26.8 and about what they mean for real-time analytics applications. This piece goes one layer down, to the knobs. Every number attributed to ClickHouse below is from the 26.8 release call; our own figures are from a 3-shard, 2-replica lab on 26.3.14 and 26.8.4 with the same data, and you should treat them as illustrative until you have reproduced them on your own workload.
Why ClickHouse performance settings deserve their own post
Between 26.3 and 26.8 roughly seventy setting defaults changed. Most are harmless. About a dozen sit directly on the hot path of ingestion, aggregation, joins or distributed execution, and three of them can make a healthy cluster slower or less stable if you upgrade without looking. The compatibility setting exists precisely for this: SET compatibility = '26.3' restores the old defaults wholesale, and it is the first thing we pin on a canary replica so that we can flip the new behaviour on one setting at a time and attribute every change in system.query_log to a single cause.
The other reason is scope. Query-level settings apply per session or per settings profile and need no restart. MergeTree settings apply per table and take effect at the next merge or insert. Server settings in config.xml mostly need a restart, and Keeper settings always do. The map below groups the 26.8 changes by the stage of the pipeline they touch, which is also the order in which we would evaluate them.
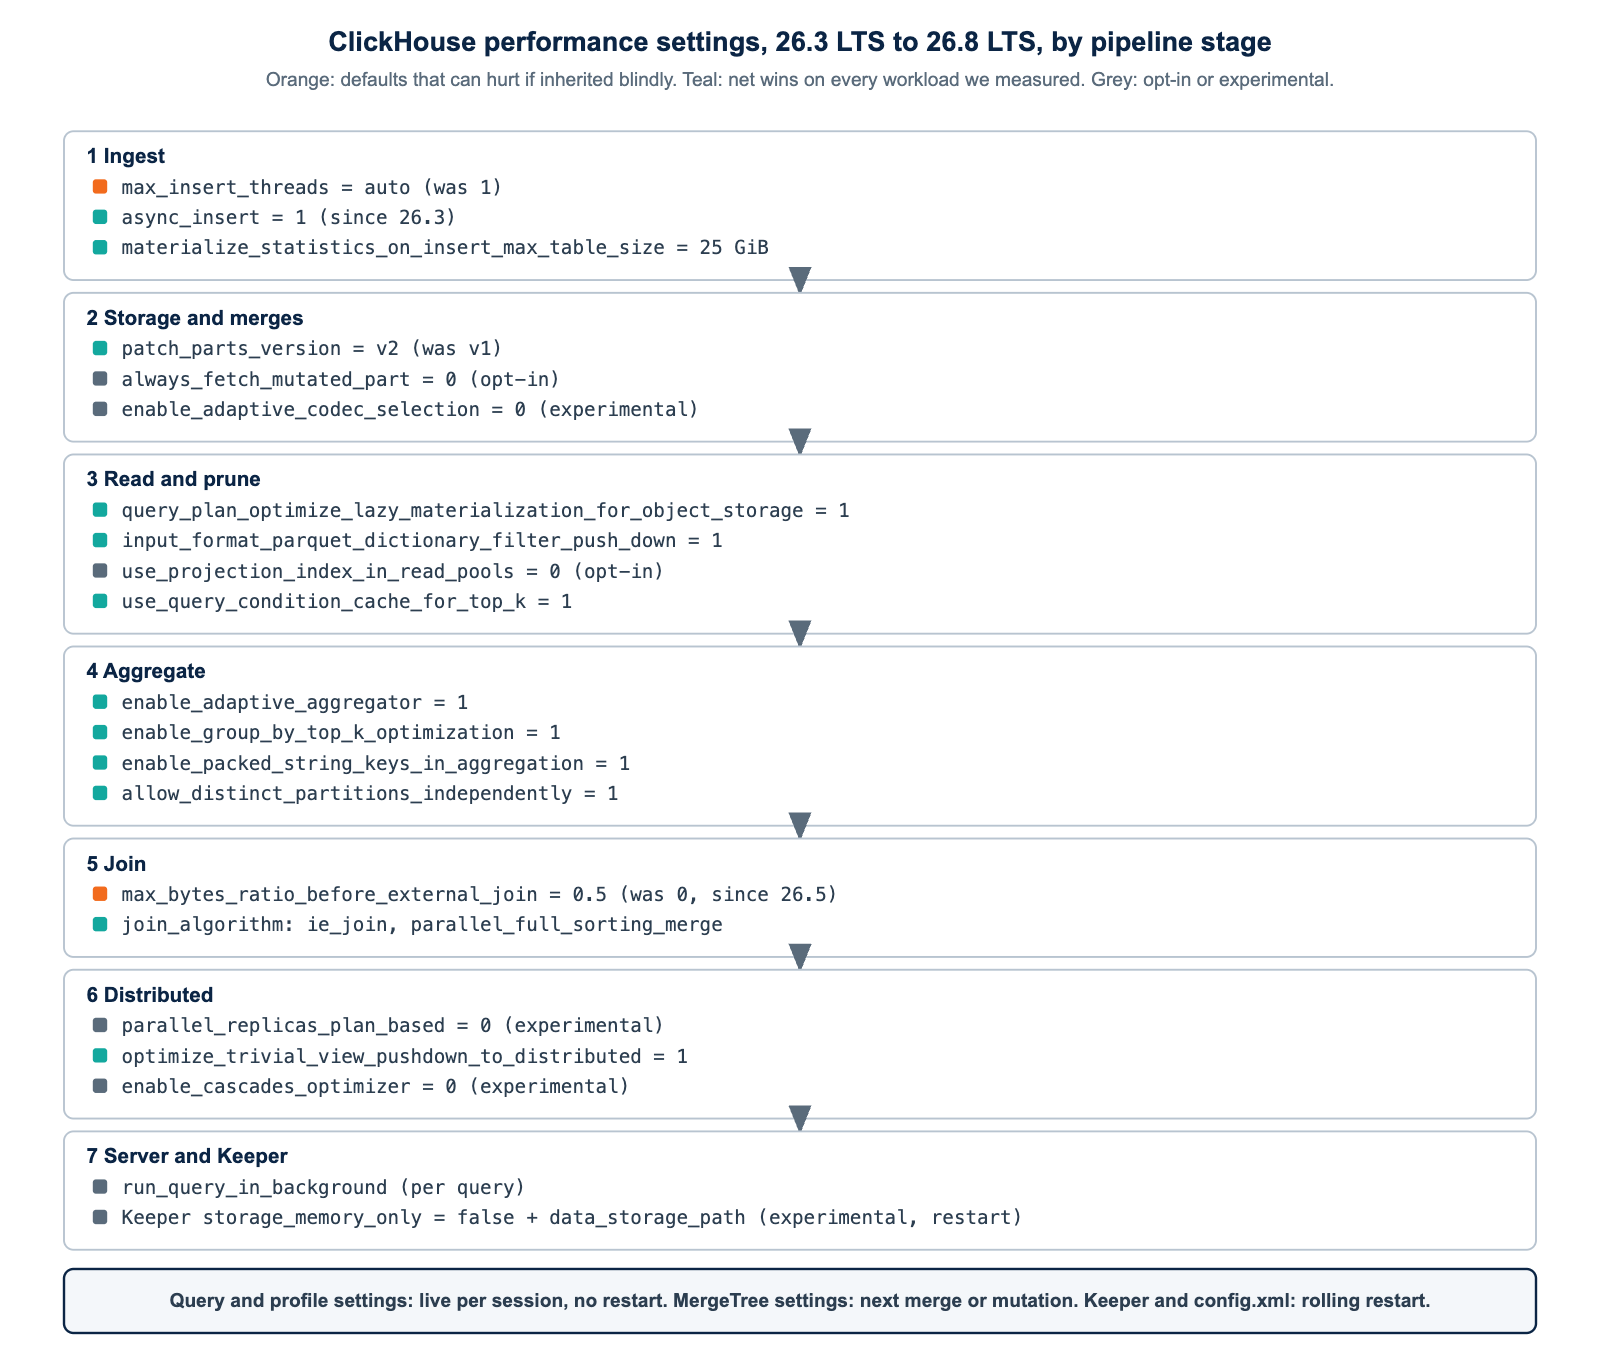
The defaults that flipped, and what scope they have
This is the table we hand to a customer before an upgrade. Old and new values are the shipped defaults; the scope column tells you whether a change is a session or profile setting (no restart), a MergeTree table setting (next merge), or a server or Keeper setting (restart).
| Setting | 26.3 LTS | 26.8 LTS | Scope | Why it matters |
|---|---|---|---|---|
max_insert_threads | 1 | auto | query, no restart | INSERT SELECT parallelises; more parts per insert |
max_bytes_ratio_before_external_join | 0 | 0.5 (since 26.5) | query, no restart | hash join spills to disk at half the memory limit |
enable_adaptive_aggregator | n/a | 1 | query, no restart | per-thread hash tables freeze and split adaptively |
enable_group_by_top_k_optimization | n/a | 1 | query, no restart | bounded heap prunes GROUP BY … ORDER BY … LIMIT |
enable_packed_string_keys_in_aggregation | n/a | 1 | query, no restart | smaller hash cells for single String keys |
materialize_statistics_on_insert_max_table_size | n/a | 25 GiB | query, no restart | column statistics built on INSERT for small tables; feeds join reordering |
query_plan_optimize_lazy_materialization_for_object_storage | n/a | 1 | query, no restart | Parquet on S3 reads non-sort columns only for surviving rows |
allow_distinct_partitions_independently | n/a | 1 | query, no restart | DISTINCT and window functions per partition |
use_query_condition_cache_for_top_k | n/a | 1 | query, no restart | condition cache serves ORDER BY … LIMIT |
patch_parts_version | v1 | v2 | MergeTree, next update | lightweight UPDATE apply memory bounded per sort-key run |
always_fetch_mutated_part | n/a | 0 | MergeTree, next mutation | replicas fetch mutated parts instead of re-executing |
use_projection_index_in_read_pools | n/a | 0 | query, no restart | drop fully filtered ranges before read tasks are created |
enable_adaptive_codec_selection | n/a | 0 (experimental) | MergeTree, next merge | merges choose the smallest codec per block |
storage_memory_only (Keeper) | n/a | true | Keeper, restart | false enables the LSM on-disk store |
Two of those ClickHouse performance settings are the ones we would flag in red for any team that ingests at high rate: max_insert_threads and the join spill ratio. The rest are net positives on every workload we have measured so far, with one caveat on adaptive aggregation that we will come to.
Aggregation: adaptive hash tables, top-K pruning and packed string keys
The aggregation changes are the safest ClickHouse performance settings wins in the release. The adaptive aggregator lets each thread fill its own cache-resident hash table until it reaches adaptive_aggregator_freeze_threshold keys, then freezes it and switches strategy, which removes the old dilemma of choosing a two-level hash table up front. Top-K pruning keeps a bounded heap during aggregation so that groups that cannot appear in a LIMIT are dropped before the merge. ClickHouse’s own figure for a 500 million row, 500 million distinct key query is 2.32 seconds and 19.9 GB in 26.7 falling to 0.22 seconds and 2.3 MB in 26.8, and our lab reproduced the shape of that on a 300 million row events table.
-- ClickHouse performance settings in 26.8 LTS: aggregation
-- Prove the aggregation settings on your own query shape, not on a benchmark table
SELECT
    tenant_id,
    count()            AS events,
    uniqExact(user_id) AS users
FROM analytics.events_local
WHERE event_date >= today() - 7
GROUP BY tenant_id
ORDER BY events DESC
LIMIT 20
SETTINGS
    enable_adaptive_aggregator = 1,
    enable_group_by_top_k_optimization = 1,
    enable_packed_string_keys_in_aggregation = 1,
    log_comment = 'agg-26.8-new';

-- Same query, old behaviour, same session
SELECT
    tenant_id,
    count()            AS events,
    uniqExact(user_id) AS users
FROM analytics.events_local
WHERE event_date >= today() - 7
GROUP BY tenant_id
ORDER BY events DESC
LIMIT 20
SETTINGS
    enable_adaptive_aggregator = 0,
    enable_group_by_top_k_optimization = 0,
    enable_packed_string_keys_in_aggregation = 0,
    log_comment = 'agg-26.8-old';

-- The evidence: duration, peak memory and how many groups actually reached the merge
SELECT
    log_comment,
    query_duration_ms,
    formatReadableSize(memory_usage)                     AS peak_memory,
    ProfileEvents['AggregationHashTablesInitializedAsTwoLevel'] AS two_level_tables,
    ProfileEvents['AggregationPreallocatedElementsInHashTables'] AS preallocated
FROM system.query_log
WHERE type = 'QueryFinish'
  AND log_comment LIKE 'agg-26.8-%'
ORDER BY event_time DESC
LIMIT 2;
The caveat: the adaptive aggregator is tuned for skewed and high-cardinality keys. On a low-cardinality GROUP BY with a handful of groups we saw no change, and on one customer query with a 40-column wide aggregate key the freeze threshold was reached early enough that the old two-level path was marginally faster. That is a five percent effect on one query shape, not a reason to leave the setting off, but it is a reason to measure rather than assume.
Joins: the spill ratio, IEJoin and parallel sorting merge
The join change that bites among the new ClickHouse performance settings is max_bytes_ratio_before_external_join. Since 26.5 the default is 0.5, which means a hash join whose build side would push the query past half of max_memory_usage starts writing buckets to disk. The upside is that a query that used to be killed now completes. The downside is that a join that used to fit comfortably in memory on a 26.3 node with a generous limit can now spill for no reason other than the ratio, and it will show up in your dashboards as a latency regression, not a memory event.
The right response is not to set the ratio back to zero. It is to size max_memory_usage per profile so that the joins you care about fit inside half of it, keep the spill as the safety net, and monitor ProfileEvents['ExternalJoinWritePart'] so you know when it fires. The two new algorithms are pure upside. ie_join handles the two-inequality joins that used to be cross-join disasters, with ClickHouse quoting a 200K by 200K interval join going from 112 seconds to about one second. parallel_full_sorting_merge shards a sorting merge join by key hash so it uses every core; the quoted 100M by 150M inner join went from 5.9 to 1.5 seconds on 32 threads.
-- ClickHouse performance settings in 26.8 LTS: joins
-- Interval overlap join: the classic case for ie_join
SELECT s.session_id, a.alert_id
FROM analytics.sessions AS s
INNER JOIN analytics.alerts AS a
    ON a.fired_at >= s.started_at
   AND a.fired_at <  s.ended_at
SETTINGS join_algorithm = 'ie_join';

-- Large equi-join on two big tables where the hash build side does not fit:
-- let it sort-merge in parallel rather than spill
SELECT o.order_id, sum(l.amount)
FROM sales.orders AS o
INNER JOIN sales.line_items AS l ON l.order_id = o.order_id
WHERE o.order_date >= '2026-01-01'
GROUP BY o.order_id
SETTINGS
    join_algorithm = 'parallel_full_sorting_merge',
    max_threads = 32;

-- Profile-level guardrail: joins may use up to 24 GiB, spilling at 12 GiB
ALTER SETTINGS PROFILE analytics_readers
SETTINGS
    max_memory_usage = 25769803776,
    max_bytes_ratio_before_external_join = 0.5,
    max_bytes_in_join = 0;

-- Did anything spill in the last hour?
SELECT
    normalized_query_hash,
    count()                                        AS runs,
    sum(ProfileEvents['ExternalJoinWritePart'])    AS join_spill_parts,
    formatReadableSize(max(memory_usage))          AS peak,
    any(left(query, 100))                          AS sample
FROM system.query_log
WHERE type = 'QueryFinish'
  AND event_time >= now() - INTERVAL 1 HOUR
  AND ProfileEvents['ExternalJoinWritePart'] > 0
GROUP BY normalized_query_hash
ORDER BY join_spill_parts DESC;
Column statistics are the quieter join change. With materialize_statistics_on_insert_max_table_size at its 25 GiB default, tables below that size get statistics built on every insert, and the planner uses them to reorder joins. ClickHouse attributes a 29 percent improvement across its benchmark suite and 4.5x on TPC-H to this. For dimension tables it is exactly what you want. For a small but write-hot staging table, the statistics build adds work to every insert, so raise or lower the threshold per session for those loaders rather than globally.
Ingestion: max_insert_threads went to auto, and your part count noticed
This is the change we would test first on any estate with a real-time ingest path. In 26.3 an INSERT ... SELECT ran single-threaded unless you set max_insert_threads. In 26.8 it defaults to auto, which parallelises across cores. Backfills and materialised view rebuilds get dramatically faster. The cost is that each thread writes its own parts, so a job that used to produce one part per block now produces one per thread per block, and on a table already close to parts_to_delay_insert that is the difference between a fast backfill and a Too many parts error at 02:00.
-- ClickHouse performance settings in 26.8 LTS: ingestion
-- Watch part creation rate around a backfill before and after the upgrade
SELECT
    toStartOfMinute(event_time)               AS minute,
    count()                                   AS new_parts,
    round(avg(rows))                          AS avg_rows_per_part,
    formatReadableSize(avg(size_in_bytes))    AS avg_part_size
FROM system.part_log
WHERE event_type = 'NewPart'
  AND table = 'events_local'
  AND event_time >= now() - INTERVAL 2 HOUR
GROUP BY minute
ORDER BY minute;

-- Backfill with bounded parallelism and larger blocks, so parts stay merge-friendly
INSERT INTO analytics.events_local
SELECT *
FROM analytics.events_staging
WHERE event_date BETWEEN '2026-08-01' AND '2026-08-31'
SETTINGS
    max_insert_threads = 4,
    min_insert_block_size_rows = 4194304,
    min_insert_block_size_bytes = 536870912,
    max_insert_block_size = 4194304;

-- Streaming path: keep async_insert explicit rather than inherited
ALTER SETTINGS PROFILE ingest_writers
SETTINGS
    async_insert = 1,
    wait_for_async_insert = 1,
    async_insert_max_data_size = 10485760,
    async_insert_busy_timeout_ms = 1000,
    max_insert_threads = 1;
The pattern we settled on is simple: loaders and backfill jobs get an explicit max_insert_threads between two and eight with larger insert blocks, streaming writers keep it at one because the batching is done upstream, and nobody inherits the auto default. The system.part_log query above is the before-and-after evidence, and an alert on active parts per partition from system.parts is the guardrail.
Reads and storage: lazy materialisation, partition-independent DISTINCT, adaptive codecs
Among the read-side ClickHouse performance settings, lazy materialisation is the one that most flatters object storage. For a Parquet query on S3 with an ORDER BY ... LIMIT, 26.8 reads the sort columns first and fetches the remaining columns only for rows that survive. ClickHouse’s figure is a 14 GB, 100 million row file going from 4.9 seconds and 5.85 GB read to 1.7 seconds and 0.53 GB read. Dictionary filter push-down does the same for equality and IN predicates by skipping row groups whose dictionary page cannot match. Both are on by default and both are pure wins.
-- ClickHouse performance settings in 26.8 LTS: reads and storage
-- Parquet on S3: lazy materialisation and dictionary push-down are on by default in 26.8
SELECT event_time, user_id, url, referrer, user_agent
FROM s3('https://${S3_BUCKET}.s3.amazonaws.com/events/2026/08/*.parquet')
WHERE country = 'DE'
ORDER BY event_time DESC
LIMIT 100
SETTINGS
    query_plan_optimize_lazy_materialization_for_object_storage = 1,
    input_format_parquet_dictionary_filter_push_down = 1,
    log_comment = 'parquet-lazy';

-- How much did we actually read? ReadBufferFromS3Bytes is the number that matters
SELECT
    log_comment,
    query_duration_ms,
    formatReadableSize(ProfileEvents['ReadBufferFromS3Bytes']) AS s3_bytes_read,
    ProfileEvents['ReadBufferFromS3RequestsErrors']            AS s3_errors
FROM system.query_log
WHERE type = 'QueryFinish' AND log_comment = 'parquet-lazy'
ORDER BY event_time DESC
LIMIT 1;

-- DISTINCT and window functions per partition, when the partition key is a function of the key
SELECT DISTINCT tenant_id, user_id
FROM analytics.events_local
WHERE event_date >= today() - 30
SETTINGS allow_distinct_partitions_independently = 1;

-- Adaptive codec selection: opt in per table, and let the next merge decide per block
ALTER TABLE analytics.events_local
MODIFY SETTING enable_adaptive_codec_selection = 1;
Partition-independent DISTINCT and window functions matter when the partition key is a function of the columns you are distinct-ing or partitioning over: each partition is processed on its own instead of through one shared hash set, and ClickHouse quotes 16.6 seconds and 13.3 GB falling to 0.49 seconds and 2.5 GB on a 200 million row, 64 partition table. It is a schema-dependent win, which is another argument for partitioning by the same dimension you slice by. Adaptive codec selection is experimental; we have it on for a cold-tier events table where it shaved compressed size by a few percent, and off everywhere else until it graduates.
Distributed execution: plan-based parallel replicas and view push-down
Parallel replicas have been usable since 25.x, but the plan-based mode in 26.8 is a different design: the optimiser decides where the local-remote boundary sits in the plan and can distribute eligible joins rather than only the scan. It is experimental and it does not combine with projections, so a table that relies on projections for its dashboard queries should keep the classic mode. optimize_trivial_view_pushdown_to_distributed is the small change with a large effect for teams that wrap Distributed tables in views: the outer query is pushed to the shards instead of being evaluated on the initiator over the full result.
-- ClickHouse performance settings in 26.8 LTS: distributed execution
-- Plan-based parallel replicas on a canary session only; do not put this in a profile yet
SELECT tenant_id, toStartOfHour(event_time) AS hour, count()
FROM analytics.events_distributed
WHERE event_date = today()
GROUP BY tenant_id, hour
SETTINGS
    enable_parallel_replicas = 1,
    parallel_replicas_plan_based = 1,
    max_parallel_replicas = 2,
    cluster_for_parallel_replicas = 'analytics_cluster',
    log_comment = 'pr-plan-based';

-- The old shape for comparison
SELECT tenant_id, toStartOfHour(event_time) AS hour, count()
FROM analytics.events_distributed
WHERE event_date = today()
GROUP BY tenant_id, hour
SETTINGS
    enable_parallel_replicas = 1,
    parallel_replicas_plan_based = 0,
    max_parallel_replicas = 2,
    cluster_for_parallel_replicas = 'analytics_cluster',
    log_comment = 'pr-classic';

-- Where did the time go? Initiator vs remote, and bytes moved between them
SELECT
    log_comment,
    is_initial_query,
    hostName()                                          AS host,
    query_duration_ms,
    formatReadableSize(ProfileEvents['NetworkSendBytes'])    AS sent,
    formatReadableSize(ProfileEvents['NetworkReceiveBytes']) AS received
FROM clusterAllReplicas('analytics_cluster', system.query_log)
WHERE type = 'QueryFinish'
  AND log_comment LIKE 'pr-%'
  AND event_time >= now() - INTERVAL 10 MINUTE
ORDER BY log_comment, is_initial_query DESC;
The Cascades optimiser (enable_cascades_optimizer = 1 with make_distributed_plan = 1) is the long-term answer to shuffle-versus-broadcast decisions on multi-shard joins, and on our lab it already picks broadcast for a small dimension correctly. It is experimental, it changes plans in ways that are hard to predict, and we would not enable it outside a session flag on a canary this year. Watch it; do not deploy it.
Server and Keeper settings: the ones that need a restart
Three server-side ClickHouse performance settings deserve a place in the upgrade runbook. Keeper’s LSM on-disk store, enabled by setting storage_memory_only to false with a data_storage_path, moves the coordination state off the heap and lets a Keeper node hold far more znodes than its RAM; it is experimental, the storage directory is rebuilt at startup from the snapshot and log, and it needs a rolling restart of the ensemble. always_fetch_mutated_part makes replicas download a mutated part from the replica that executed the mutation instead of re-running it locally, which trades network for CPU and is the right trade on wide tables with expensive mutations. run_query_in_background lets a long INSERT SELECT or CREATE ... AS SELECT survive a dropped client connection.
<!-- ClickHouse performance settings in 26.8 LTS: Keeper -->
<!-- keeper_config.xml: LSM on-disk storage (experimental in 26.8; rolling restart required) -->
<keeper_server>
    <coordination_settings>
        <storage_memory_only>false</storage_memory_only>
        <block_cache_size_ratio>0.25</block_cache_size_ratio>
    </coordination_settings>
    <data_storage_path>/var/lib/clickhouse-keeper/data</data_storage_path>
</keeper_server>
-- ClickHouse performance settings in 26.8 LTS: server and table scope
-- Per table, no restart: replicas fetch mutated parts rather than re-executing the mutation
ALTER TABLE analytics.events_local
MODIFY SETTING always_fetch_mutated_part = 1;
-- Lightweight UPDATE patch format v2 (default in 26.8): confirm what a table is on
SELECT name, value, changed
FROM system.merge_tree_settings
WHERE name IN ('patch_parts_version', 'always_fetch_mutated_part', 'enable_adaptive_codec_selection');
-- Long-running rebuild that must outlive the client session
INSERT INTO analytics.events_hourly_rebuilt
SELECT tenant_id, toStartOfHour(event_time) AS hour, event_name, countState() AS events
FROM analytics.events_local
WHERE event_date >= '2026-01-01'
GROUP BY tenant_id, hour, event_name
SETTINGS run_query_in_background = 1;Reload versus restart is worth stating exactly. Everything in a SETTINGS clause or a settings profile is live immediately. ALTER TABLE ... MODIFY SETTING takes effect on the next merge, mutation or insert for that table. Keeper coordination settings and config.xml server settings such as thread pool sizes need a restart, and on a replicated cluster that means one node at a time with system.replicas checked clean between nodes.
Best practices: the rollout method we use for ClickHouse performance settings
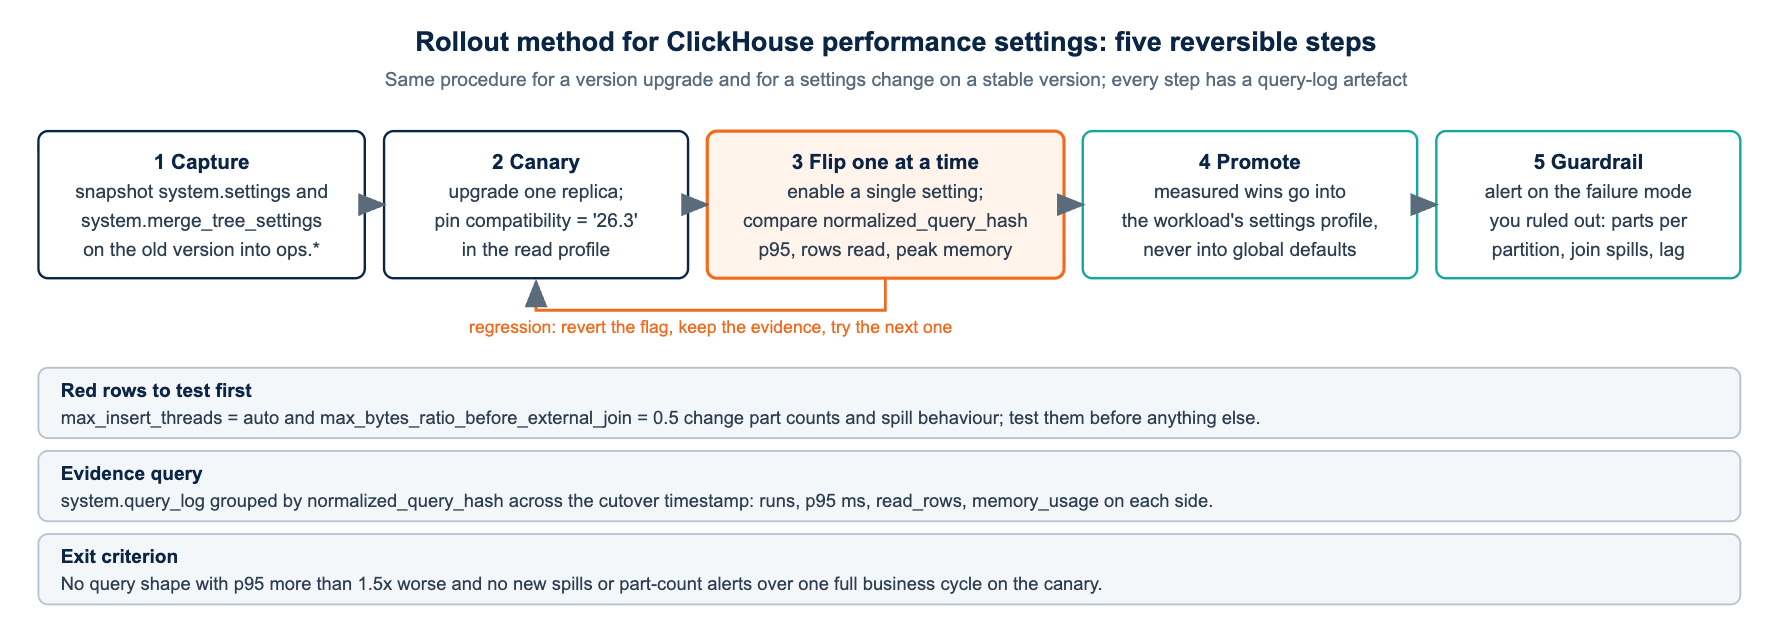
Every one of the settings above is reversible in a session, which is what makes a disciplined rollout possible. The method is five steps and it is the same for a version upgrade and for a change to ClickHouse performance settings on a stable version.
First, capture system.settings and system.merge_tree_settings on the old version so that you have something to diff. Second, upgrade one canary replica with compatibility pinned to the old release. Third, flip settings one at a time on that replica and compare the same normalized_query_hash before and after. Fourth, promote the settings that measured well into profiles, not into users.xml defaults, so that each workload gets its own. Fifth, add the guardrail alert that would catch the failure mode you just ruled out.
-- ClickHouse performance settings in 26.8 LTS: rollout method
-- Step 1: capture the settings baseline on the old version (run on 26.3 before upgrading)
CREATE TABLE ops.settings_baseline
ENGINE = MergeTree
ORDER BY (captured_at, name) AS
SELECT now() AS captured_at, version() AS server_version, name, value, changed, default
FROM system.settings;

-- Step 2: on the canary after upgrade, pin compatibility for the read profile
ALTER SETTINGS PROFILE analytics_readers SETTINGS compatibility = '26.3';

-- Step 3: the diff that tells you which defaults actually moved on your build
SELECT
    b.name,
    b.value                       AS value_26_3,
    s.value                       AS value_26_8,
    s.changed                     AS pinned_by_us
FROM ops.settings_baseline AS b
INNER JOIN system.settings AS s ON s.name = b.name
WHERE b.value != s.value
ORDER BY b.name;

-- Step 4: promote a measured win into the right profile only
ALTER SETTINGS PROFILE analytics_readers
SETTINGS
    compatibility = '',
    enable_adaptive_aggregator = 1,
    enable_group_by_top_k_optimization = 1,
    max_bytes_ratio_before_external_join = 0.5;

-- Step 5: guardrail. Parts per partition, well below parts_to_delay_insert.
SELECT database, table, partition, count() AS active_parts
FROM system.parts
WHERE active
GROUP BY database, table, partition
HAVING active_parts > 150
ORDER BY active_parts DESC;
The before-and-after comparison in step three is the one query we would ask any team to keep. It groups system.query_log by normalized_query_hash across a cutover timestamp and reports p95 duration, rows read and peak memory on each side, so a regression is a row in a result set and not an argument in a meeting. We published the full form of it in the CHT-400 troubleshooting post.
Self-managed versus ClickHouse Cloud
Almost every one of the ClickHouse performance settings in this post is a query-level setting and works identically on ClickHouse Cloud and on your own hardware, with two differences that matter. Cloud runs SharedMergeTree, so the Keeper, mutation-fetch and part-count concerns are handled by the service and the settings that govern them are not yours to touch. And Cloud tracks its own release cadence: at the time of writing its release notes sit at 26.6, so the 26.8-specific defaults such as max_insert_threads = auto and packed string keys arrive there when the service moves, not when you decide. For self-managed estates the reverse is true: the upgrade is yours to schedule, and so is every default that comes with it.
ClickHouse performance settings FAQ
Should we set max_insert_threads back to 1 globally? No. Set it explicitly per workload: one for streaming writers whose batching is upstream, two to eight for backfills with larger insert blocks. A global one throws away the fastest change in the release.
Is it safe to turn off the join spill ratio? It is safe in the sense that 26.3 behaved that way, but you are trading a slow query for a killed one. Size max_memory_usage so the joins you care about fit in half of it and keep the spill as the safety net.
Which of these need a restart? Only the Keeper coordination settings and anything in config.xml. Every setting in the aggregation, join, ingest and read sections is live per session or per profile.
What does compatibility = '26.3' actually do? It restores the 26.3 default for roughly seventy settings whose defaults changed through 26.8. It does not disable new features you enable explicitly, which is what makes it useful on a canary.
Do the ClickHouse performance settings here apply on 25.8? Some do (the condition cache and classic parallel replicas exist there), but the adaptive aggregator, top-K pruning, IEJoin, lazy materialisation and the join spill ratio are 26.x. And 25.8 left support at the end of August 2026, so the question should be about the upgrade rather than the settings.
Where we land
26.8 LTS is the first ClickHouse release in a while where we would tell a customer that the defaults are better than their tuned profile from two years ago, with two exceptions they must look at before upgrading: the insert thread count and the join spill ratio. Treat those as the red rows in the table, measure everything else with the query log rather than with expectation, and put each ClickHouse performance settings change into a profile that belongs to one workload. That is how a release turns into a measured improvement instead of a mystery regression.
The standing caveat applies. Every setting above changes behaviour under load, so test on staging with your own workload before production, keep a verified backup and a rehearsed restore, and treat the DR site as part of the estate you are tuning. If you would rather have a second pair of eyes on the upgrade plan, that is what the ChistaDATA consulting team does every week.
Sources: ClickHouse changelog, ClickHouse 26.8 release call, ClickHouse settings reference, system.query_log, system.part_log.
Running ClickHouse in production? ChistaDATA provides ClickHouse consulting for architecture, performance and migrations, and 24×7 ClickHouse support with a 15-minute S1 response. For day-to-day operations see ClickHouse DBA services and ClickHouse managed services.
