ClickHouse 26.8 LTS shipped on 27 August 2026, two days before 25.8 LTS fell out of upstream support. If you run ClickHouse in production, that timing is the whole story: this is the release you will be living on for the next year, and it is the first LTS since 26.3 that changes how the server aggregates, joins, coordinates through Keeper, and recovers replicas.
We have spent the last week reading the changelog against the estates we support at ChistaDATA, and this post is the operational reading of ClickHouse 26.8 LTS for performance, scalability and high availability, for self-managed clusters and for ClickHouse Cloud, with the settings you will actually touch and the checks we would run before trusting any of it.
A word on numbers before we start. Every speedup quoted below is ClickHouse Inc.’s own figure from the 26.8 release call, on their hardware and their datasets. We have not reproduced them yet on customer workloads, and you should not treat them as anything more than a signal of where to look. Where we give you a query, it is a query to measure your own before-and-after, not a promise.
Where ClickHouse 26.8 LTS sits in the LTS cycle
ClickHouse cuts an LTS twice a year, in March and August, each supported for twelve months. That gives us this picture as of early September 2026: 26.8 LTS is current and supported until roughly the end of August 2027; 26.3 LTS remains supported until 26 March 2027; 25.8 LTS reached end of upstream support on 29 August 2026 (Altinity Stable extends 25.8 to 2029 for estates that need it); anything on 25.3 or earlier has been unsupported since March.
The release itself is large even by ClickHouse standards: 98 new features, 128 performance optimizations and 556 bug fixes, per the release call. If you are on 26.3 LTS, the hop to ClickHouse 26.8 LTS crosses 57 backward-incompatible changes accumulated across 26.4 through 26.8. If you are still on 25.8, you cross those plus the 26.3 set, most notably async_insert defaulting to on. Neither hop is a “just upgrade the binary” event, and we cover the checklist near the end. If you want the broader feature tour first, we published what is new in ClickHouse 26.8 LTS for real-time analytics last week; this post is the operations-side companion to it.
Our stance, dated 7 September 2026: greenfield goes to 26.8 LTS now. Estates on 26.3 LTS should stage ClickHouse 26.8 LTS this quarter and cut over before December, because 26.3 has six months left and you do not want the upgrade and the year-end freeze in the same window. Estates on 25.8 have no supported option other than moving, and we would go straight to 26.8 rather than parking on 26.3 for six months and doing it twice.
Performance: what changed in the query engine
The ClickHouse 26.8 LTS performance work clusters in three places: aggregation, joins, and reading columnar files from object storage. Aggregation is where most ClickHouse CPU goes on analytical workloads, so that is where we would look first.
Adaptive aggregation and top-K fusion
The parallel GROUP BY now runs under an adaptive algorithm (enable_adaptive_aggregator, on by default in ClickHouse 26.8 LTS) that switches between merging thread-local hash tables and splitting them into buckets depending on the observed key distribution. The older behaviour committed to one strategy up front, which is why GROUP BY on a few hundred keys and GROUP BY on a hundred million keys behaved so differently under the same thread count.
The second change is the one we expect to matter most on dashboards. GROUP BY ... ORDER BY agg DESC LIMIT n is the most common query shape in analytics, and until now ClickHouse built the full aggregation state for every key before sorting and cutting to n. With enable_group_by_top_k_optimization, the aggregator keeps a bounded heap and prunes keys that cannot make the top n. ClickHouse’s release figure: 500 million rows with roughly 500 million distinct keys went from 2.32 s and 19.9 GB of memory to 0.22 s and 2.3 MB. The memory number is the one that matters operationally, because it is exactly this query shape that trips max_memory_usage on a shared cluster at month end.
String keys got their own treatment: enable_packed_string_keys_in_aggregation packs short string keys into fixed-width slots, for a quoted 1.8× on GROUP BY String. And DISTINCT and window functions over a partitioned sort order can now run per partition without the cross-thread reshuffle (allow_distinct_partitions_independently, allow_window_partitions_independently), which the release call put at 34× on a 200-million-row DISTINCT with 64 partitions.
Here is how we would baseline before turning any of this into a claim. Run your top-K queries on 26.3 and 26.8 with the same warm state, then pull the comparison from system.query_log:
SELECT
    normalized_query_hash,
    count()                                        AS runs,
    quantile(0.95)(query_duration_ms)              AS p95_ms,
    formatReadableSize(max(memory_usage))          AS peak_mem,
    sum(ProfileEvents['AggregationHashTablesInitializedAsTwoLevel']) AS two_level_inits,
    any(Settings['enable_adaptive_aggregator'])    AS adaptive,
    any(Settings['enable_group_by_top_k_optimization']) AS topk
FROM system.query_log
WHERE type = 'QueryFinish'
  AND event_time >= now() - INTERVAL 1 DAY
  AND query ILIKE '%GROUP BY%'
  AND query ILIKE '%LIMIT%'
GROUP BY normalized_query_hash
ORDER BY p95_ms DESC
LIMIT 20;
If peak_mem does not fall on your top-K queries, the optimization did not engage. The usual reason is a HAVING clause or an ORDER BY on an expression the heap cannot bound; EXPLAIN PLAN will show you whether the aggregating step carries the limit.
Joins: IEJoin, parallel sort-merge, and statistics on insert
Two join changes are worth a paragraph each. Inequality joins (a.ts BETWEEN b.start AND b.end and friends) used to fall through to a filtered CROSS JOIN, which is why sessionization and interval-overlap queries were the ones people gave up on and pre-computed. ClickHouse 26.8 LTS adds IEJoin, a sort-based inequality join, selectable through join_algorithm. The quoted figure is 200K × 200K rows from 112 s to 1.06 s. That is the kind of ratio you only get by changing the algorithm class, and it is the first time we would consider running interval joins directly on a fact table in ClickHouse.
parallel_full_sorting_merge shards both join inputs by key hash and runs the merge on every core, where the older full_sorting_merge merged on one thread. And column statistics are now materialized on INSERT by default for tables up to materialize_statistics_on_insert_max_table_size (25 GiB), so the join reorderer has cardinality estimates without anyone running ALTER TABLE ... MATERIALIZE STATISTICS. The experimental Cascades cost-based optimizer (enable_cascades_optimizer = 1 together with make_distributed_plan = 1) consumes those estimates for distributed plans; we would not enable it in production this quarter, but we would run it on a staging replay to see what it does to your worst three joins.
-- Interval join on 26.8: sessions to events, without a CROSS JOIN blow-up
SET join_algorithm = 'IEJoin';

SELECT
    s.session_id,
    count() AS events_in_session
FROM events AS e
INNER JOIN sessions AS s
    ON e.user_id = s.user_id
   AND e.event_time >= s.started_at
   AND e.event_time <  s.ended_at
GROUP BY s.session_id
ORDER BY events_in_session DESC
LIMIT 50;

-- Confirm which algorithm actually ran
SELECT
    query_id,
    query_duration_ms,
    ProfileEvents['JoinBuildTableRowCount']  AS build_rows,
    ProfileEvents['JoinProbeTableRowCount']  AS probe_rows,
    Settings['join_algorithm']               AS algorithm
FROM system.query_log
WHERE type = 'QueryFinish'
  AND query ILIKE '%sessions AS s%'
ORDER BY event_time DESC
LIMIT 5;
One default flip in this window bites joins specifically: hash joins now spill to disk at 50 percent of the memory limit. That is safer than the old out-of-memory kill, but a join that used to fit and now spills will look like a regression in query_duration_ms while memory_usage looks better. Watch ProfileEvents['ExternalJoinWritePart'] after the upgrade.
Object storage and Parquet reads
For anyone querying Parquet on S3 or a data lake, ClickHouse 26.8 LTS adds lazy materialization (query_plan_optimize_lazy_materialization_for_object_storage) so that an ORDER BY ... LIMIT reads only the sort columns first and fetches the rest for the surviving rows. The release call figure is 4.9 s and 5.85 GB read down to 1.7 s and 0.53 GB on a 14 GB dataset. Dictionary-page filtering (input_format_parquet_dictionary_filter_push_down) skips row groups whose dictionary cannot contain the predicate value. Neither touches MergeTree; both matter if you tier cold data to Parquet or run ClickHouse over Iceberg.
The last performance item is memory rather than speed. Part schema metadata is now interned and shared across parts, which the release call put at 840 MB down to 240 MB for a 231-column table with 3,000 small parts. If you have wide tables and a part-count problem you have been tolerating, your server RSS will drop after the upgrade. That is not a reason to keep the part-count problem.
Scalability: parallel replicas, background queries and Keeper at scale
Scale in ClickHouse 26.8 LTS means two different things: reading one query across more machines, and running more concurrent queries without the coordination layer becoming the bottleneck. 26.8 moves both, though with different maturity levels.
Plan-based parallel replicas
Parallel replicas, where a single query is split across all replicas of a shard by mark range, has been a production primitive since the 26.x line. What ClickHouse 26.8 LTS changes is the experimental parallel_replicas_plan_based mode, which now optimizes the query plan first and then chooses where the local/remote boundary sits, rather than pushing a fixed shape to the replicas. It can also parallelize queries over views containing a UNION, distributes JOIN stages, and collects runtime statistics to decide automatically whether fan-out is worth it.
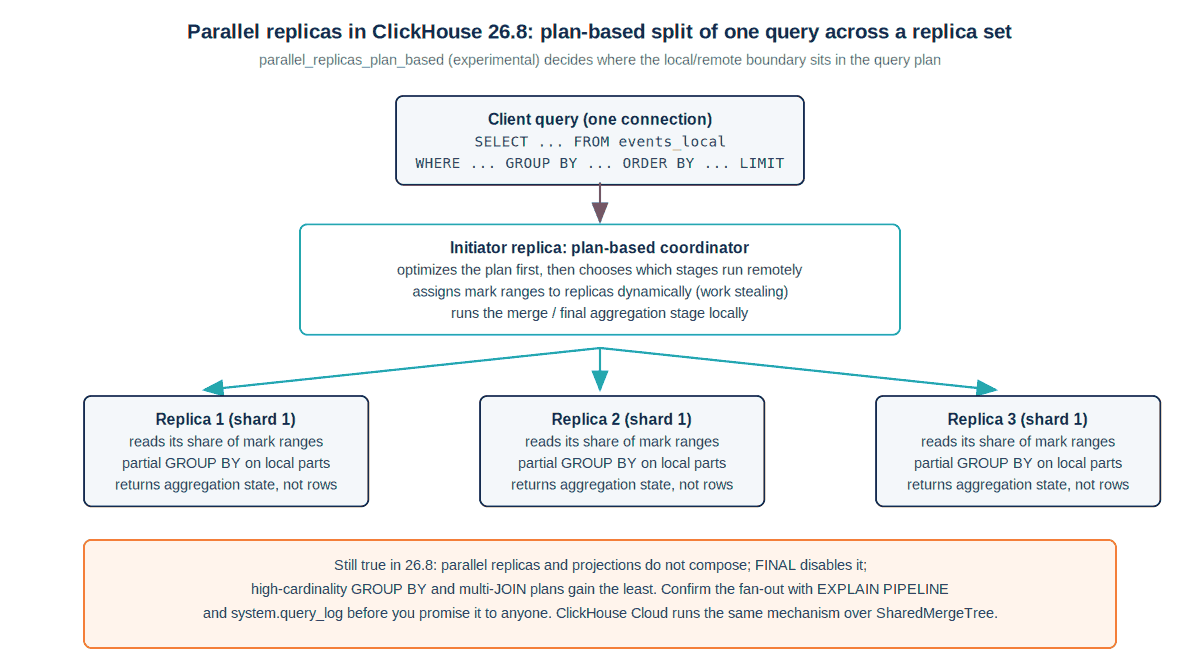
The constraints that mattered in 26.3 still hold in ClickHouse 26.8 LTS, and they are the things we see architecture reviews get wrong: parallel replicas and projections do not compose, FINAL disables the fan-out, and plans dominated by high-cardinality GROUP BY or multiple joins gain the least because the merge stage on the initiator becomes the bottleneck. Check the fan-out before you design around it:
SET enable_parallel_replicas = 1,
    max_parallel_replicas = 3,
    cluster_for_parallel_replicas = 'analytics_cluster';

EXPLAIN PIPELINE
SELECT
    toStartOfHour(event_time) AS hour,
    tenant_id,
    count()
FROM events_local
WHERE event_date >= today() - 7
GROUP BY hour, tenant_id;

-- After running the real query, verify how many replicas participated
SELECT
    query_id,
    ProfileEvents['ParallelReplicasReadAssignedMarks']  AS assigned_marks,
    ProfileEvents['ParallelReplicasStealingByHashMicroseconds'] AS stealing_us,
    Settings['parallel_replicas_plan_based']            AS plan_based
FROM system.query_log
WHERE type = 'QueryFinish'
  AND event_time >= now() - INTERVAL 10 MINUTE
ORDER BY event_time DESC
LIMIT 5;
We wrote up the dynamic-shard side of this in Parallel Replicas with Dynamic Shards in ClickHouse; the plan-based mode does not change the topology advice there, it changes how much of the plan can leave the initiator.
Background queries and the introspection port
Two small features in ClickHouse 26.8 LTS fix two old operational pains. run_query_in_background makes the server accept a query, return immediately, and run it to completion even if the client disconnects. Every DBA who has watched a six-hour INSERT ... SELECT die because a laptop went to sleep will understand why this is in the scalability section: long backfills no longer need a screen session on a bastion host. Track them in system.processes and system.query_log as usual.
The introspection port is a separate listener, served by a dedicated thread pool, that an operator can reach with clickhouse-client when the main ports are saturated. If you have ever been unable to run SHOW PROCESSLIST on a server that was at max_concurrent_queries, this is the fix. Configure it and put it in your runbooks before you need it.
Keeper on disk
The scalability change we care about most is in ClickHouse Keeper, because Keeper is where large ClickHouse estates actually hit their ceiling. Keeper has always held the entire znode tree in memory, so a cluster with hundreds of tables, deep replication queues, and a wide replicated_deduplication_window ends up with a coordination service whose RSS is the binding constraint. ClickHouse 26.8 LTS introduces an experimental on-disk backend: a custom LSM tree, enabled with use_lsmt_storage = true and storage_memory_only = false under coordination_settings, with the tree written under data_storage_path or to a named data_storage_disk, which can be an s3_plain disk.
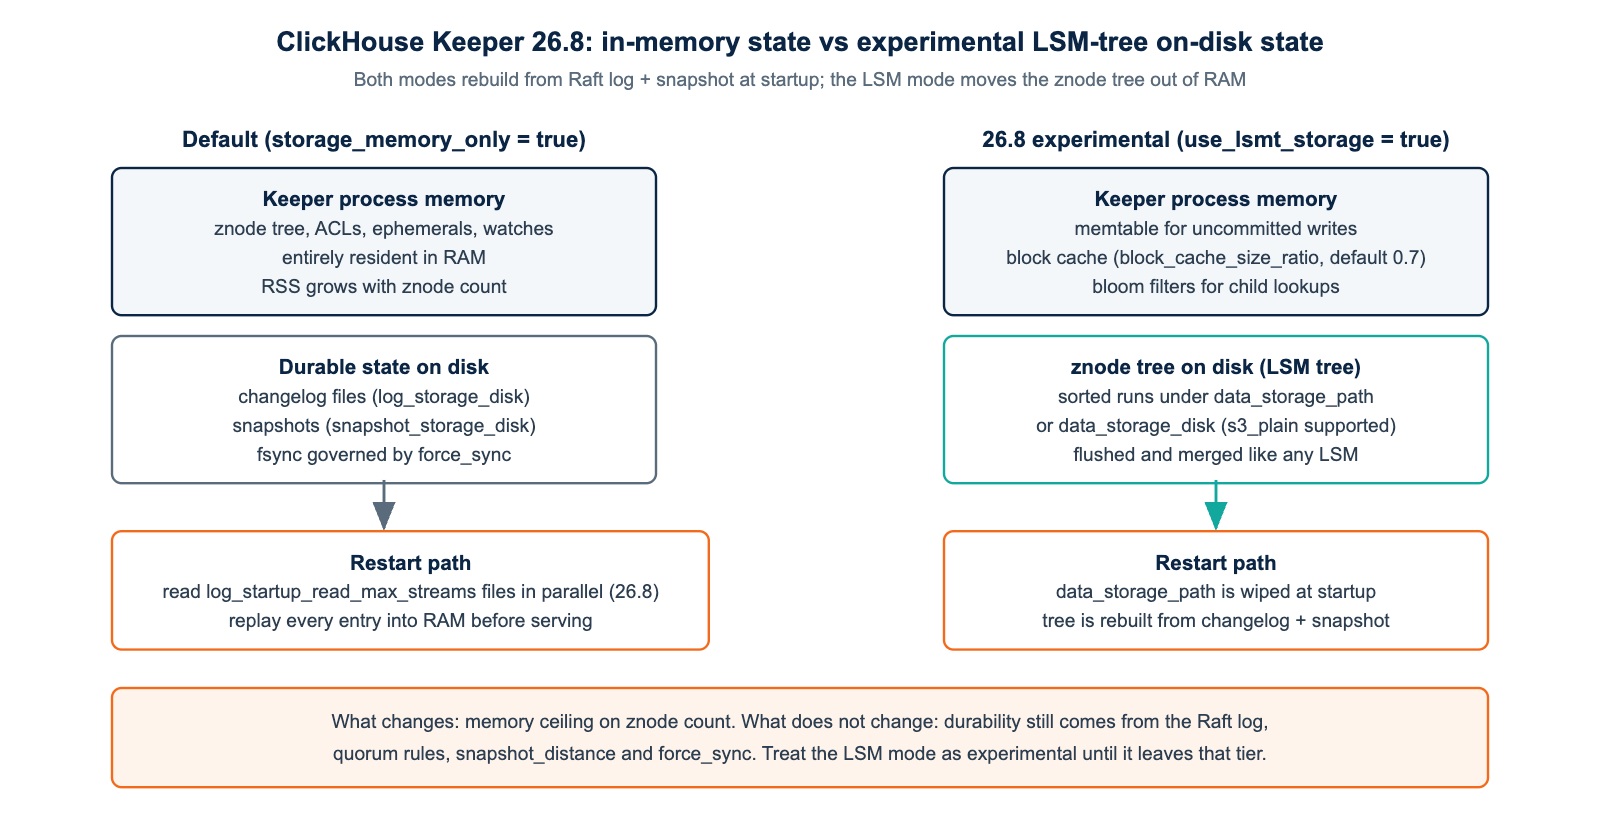
Read the pull request before you get excited, because the detail matters. The on-disk tree is not the durability layer. The data_storage_path directory is wiped at startup and rebuilt from the Raft changelog and snapshot, exactly as the earlier RocksDB experiment behaved. What you gain is a memory ceiling that no longer tracks znode count, with a block cache (block_cache_size_ratio, default 0.7) and bloom filters keeping hot paths fast.
What you do not gain is any change to quorum, force_sync, snapshot_distance or recovery semantics. The PR itself notes that RemoveRecursive over large subtrees can consume significant memory during preprocessing and that stress testing is still limited. We would run this on a staging ensemble under a replayed system.zookeeper_log workload and nowhere else until it leaves the experimental tier.
<!-- keeper_config.xml on a 26.8 Keeper node: STAGING ONLY while use_lsmt_storage is experimental -->
<clickhouse>
    <keeper_server>
        <tcp_port>9181</tcp_port>
        <server_id>1</server_id>
        <log_storage_path>/var/lib/clickhouse-keeper/coordination/log</log_storage_path>
        <snapshot_storage_path>/var/lib/clickhouse-keeper/coordination/snapshots</snapshot_storage_path>

        <coordination_settings>
            <operation_timeout_ms>10000</operation_timeout_ms>
            <session_timeout_ms>30000</session_timeout_ms>
            <force_sync>true</force_sync>
            <snapshot_distance>100000</snapshot_distance>
            <max_requests_batch_size>1000</max_requests_batch_size>
            <!-- 26.8: parallel changelog read at startup -->
            <log_startup_read_max_streams>4</log_startup_read_max_streams>
            <!-- 26.8 experimental: znode tree on disk instead of RAM -->
            <use_lsmt_storage>true</use_lsmt_storage>
            <storage_memory_only>false</storage_memory_only>
            <data_storage_path>/var/lib/clickhouse-keeper/coordination/data</data_storage_path>
            <block_cache_size_ratio>0.7</block_cache_size_ratio>
        </coordination_settings>

        <raft_configuration>
            <server><id>1</id><hostname>keeper-1.internal</hostname><port>9234</port></server>
            <server><id>2</id><hostname>keeper-2.internal</hostname><port>9234</port></server>
            <server><id>3</id><hostname>keeper-3.internal</hostname><port>9234</port></server>
        </raft_configuration>
    </keeper_server>
</clickhouse>
The changelog names the switch use_lsmt_storage; the pull request that landed it used use_new_storage during development. Check clickhouse-keeper --help or the coordination settings documentation for your exact build before copying the block above; a misnamed Keeper setting is rejected at startup, which on a live ensemble means one fewer voter. Either way, a Keeper restart is required. That is not a reload.
Less glamorous but immediately useful on every ClickHouse 26.8 Keeper: log_startup_read_max_streams reads multiple changelog files concurrently at startup, which shortens the window where a restarted Keeper node is not yet voting. On ensembles with large changelogs between snapshots, that window was measured in minutes; shorten it and your rolling Keeper upgrades get safer for free.
High availability: replica recovery, observability across replicas, atomic POPULATE
None of the HA changes in ClickHouse 26.8 LTS are headline features, and that is fine. HA improvements that matter are usually the ones that remove a manual step from a 3 a.m. runbook.
always_fetch_mutated_part
When a mutation runs on a replicated table, every replica executes it independently on its own copy of each part. On a wide table with a heavy ALTER TABLE ... UPDATE, that is N times the CPU and I/O for the same result, and it is why a mutation storm degrades every replica at once instead of one.
The new always_fetch_mutated_part setting lets a replica download the mutated part from a replica that has already produced it, the way it already fetches merged parts under always_fetch_merged_part. For estates with a designated “merge leader” pattern, or where replicas are asymmetric in CPU, this closes a long-standing gap. Watch system.replication_queue for MUTATE_PART entries and system.part_log for DownloadPart events to confirm the fetch path is being taken:
SELECT
    hostName()                                   AS replica,
    event_type,
    count()                                      AS parts,
    formatReadableSize(sum(size_in_bytes))       AS bytes,
    round(avg(duration_ms))                      AS avg_ms
FROM clusterAllReplicas('analytics_cluster', system.part_log)
WHERE event_time >= now() - INTERVAL 1 HOUR
  AND event_type IN ('MutatePart', 'DownloadPart')
GROUP BY replica, event_type
ORDER BY replica, event_type;
Union system log tables
The query above uses clusterAllReplicas, which is what everyone does and which breaks the moment one replica is down. The new create_union_system_log_tables server configuration section asks the server to create and maintain all_query_log, all_part_log and similar tables that union the system logs across replicas. During an incident, being able to query system.all_query_log from any surviving node without hand-writing a clusterAllReplicas call, and without it failing because the node you are investigating is the one that is unreachable, is exactly the kind of small thing that shortens an S1.
Keeper cluster view and atomic materialized-view backfill
The Keeper HTTP dashboard, which arrived in 26.1, gains a Cluster tab in 26.8 showing Raft membership as a topology graph with health colours. It complements system.zookeeper_info and is the first place we would send a first responder who does not know Keeper. Alongside, CREATE MATERIALIZED VIEW ... POPULATE is now locally atomic (materialized_views_populate_atomically, on by default), so inserts arriving during the backfill are neither lost nor doubled. Anyone who has rebuilt an aggregating MV on a live table and then spent an afternoon reconciling counts knows why that was a real HA defect and not a convenience.
One thing ClickHouse 26.8 LTS does not change: Keeper is still a single Raft group per ensemble, there is no multi-Raft partitioning, and zero-copy replication over object storage remains experimental in open-source ClickHouse. The honest cheap-storage story for self-managed estates is still tiering to Parquet or Iceberg, not zero-copy.
Getting to ClickHouse 26.8 LTS on-premises versus on ClickHouse Cloud
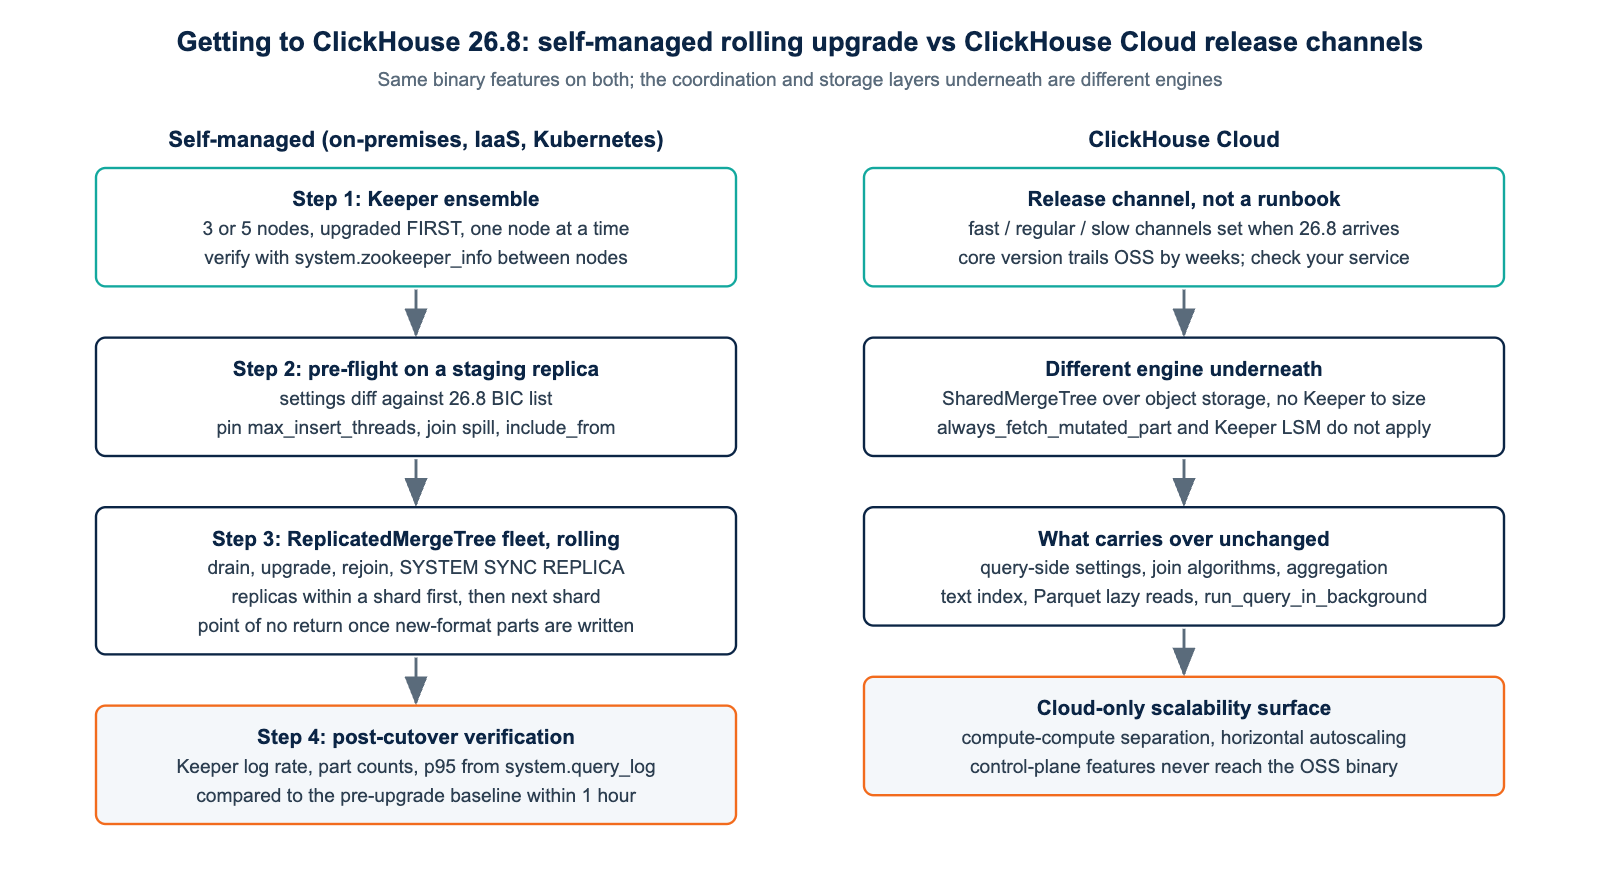
Everything above is in the open-source binary and therefore available wherever you run it: bare metal, VMs, Kubernetes under either the Altinity operator or ClickHouse Inc.’s own Apache-2.0 operator. The path to get there is where self-managed and Cloud diverge completely.
Self-managed: Keeper first, then a rolling fleet upgrade
Upgrade the Keeper ensemble first and separately, one node at a time, confirming with system.zookeeper_info that the node has rejoined and the leader is stable before moving to the next. Only then touch the servers, replicas within a shard first, then shard by shard, with SYSTEM SYNC REPLICA and a replication-queue check between nodes. Before any of that, run the pre-flight diff on a staging replica loaded from a recent backup: capture system.settings where changed = 1, and grep system.query_log for the constructs the breaking changes touch.
-- Pre-flight on the staging replica BEFORE upgrading to 26.8.
-- 1. Which settings do we pin explicitly today? (compare against the 26.8 BIC list)
SELECT name, value, default
FROM system.settings
WHERE changed = 1
ORDER BY name;

-- 2. Anything relying on Arrow reader/writer settings removed in 26.8?
SELECT count() AS arrow_queries
FROM system.query_log
WHERE event_date >= today() - 30
  AND (query ILIKE '%input_format_arrow_use_native_reader%'
    OR query ILIKE '%output_format_arrow_use_native_writer%');

-- 3. Consumers that depend on the old per-CPU asynchronous_metrics rows (dashboards break)
SELECT metric
FROM system.asynchronous_metrics
WHERE metric LIKE 'OSUserTimeCPU%' OR metric LIKE 'OSIdleTimeCPU%'
LIMIT 5;

-- 4. JSON inserts with unquoted numbers into DateTime columns (now read as Unix timestamps)
SELECT count() AS json_inserts_to_datetime
FROM system.query_log
WHERE event_date >= today() - 30
  AND query_kind = 'Insert'
  AND query ILIKE '%FORMAT JSONEachRow%';
State the point of no return in the runbook: once 26.8 writes new-format parts, a binary rollback to 26.3 is no longer a clean operation. Take a verified backup before the first server node, rehearse the restore, and re-compare Keeper request rate, part counts and query p95 against the pre-upgrade baseline within an hour of completing the fleet. That last step is the one that catches the max_insert_threads default change (now auto, was 1), which on a write-heavy estate will change part sizes and merge pressure immediately.
ClickHouse Cloud: a release channel, and a different engine
On ClickHouse Cloud you do not upgrade anything; your service’s release channel (fast, regular or slow) determines when the ClickHouse 26.8 LTS core reaches you, and at the time of writing the Cloud release notes run to 26.6, so 26.8 will land over the coming weeks depending on channel. Check SELECT version() on your service rather than assuming. The query-side features carry over unchanged: adaptive aggregation, top-K fusion, IEJoin, Parquet lazy reads, run_query_in_background, the text-index improvements.
What does not carry over is anything below the query layer. Cloud runs SharedMergeTree over object storage rather than ReplicatedMergeTree over local disks, and coordination is handled by the platform. So the Keeper LSM backend, log_startup_read_max_streams, always_fetch_mutated_part and the whole rolling-upgrade section simply do not apply, and merge, mutation and part behaviour you observe in system.merges and system.mutations will not match a self-managed cluster running the same version. Sizing models, benchmarks and merge tuning do not transfer in either direction; a Cloud-to-self-managed move is an engine change, not a hosting change.
In the other direction, Cloud has scalability surface that never reaches the open-source binary: compute-compute separation (independent compute groups over one storage layer), horizontal autoscaling on concurrent query count, and the agentic tooling. If you are designing on Cloud with an eye on later self-hosting, do not architect around those, because the open-source substitutes are parallel replicas plus topology design, or Altinity’s Project Antalya for compute-storage separation. We have seen more than one team discover this drift after the fact.
The 26.3 to 26.8 breaking-change checklist for this area
The full ClickHouse 26.8 list is 57 items across 26.4 to 26.8; these are the ones that touch performance, scale and availability directly.
| Change | Version | Blast radius | What to do before cutover |
|---|---|---|---|
max_insert_threads default 1 → auto | 26.8 | Part sizes and merge pressure change fleet-wide on INSERT SELECT | Pin the old value in the profile, re-enable deliberately |
| Hash joins spill to disk at 50% of memory limit | 26.x window | Latency regressions that look like memory improvements | Watch ExternalJoinWritePart; raise limits for known-large joins |
| x86 builds require AVX2 | 26.6 | Server refuses to start on pre-Haswell hardware | Check grep avx2 /proc/cpuinfo on every node, including DR |
s3() from SQL no longer uses instance credentials | 26.7 | Every IAM-implicit s3() call fails | Explicit credentials, named collections, or NOSIGN |
Legacy dedup removed behind insert_deduplication_version | 26.7 | Server refuses to start with deprecated dedup settings | Migrate settings on staging first |
| Per-CPU asynchronous metrics consolidated into Map types | 26.8 | Grafana panels on per-CPU series go blank | Set asynchronous_metrics_key_values_mode or rewrite panels |
| Arrow library reader/writer removed | 26.8 | Settings become no-ops; native path only | Verify Arrow ingestion on staging |
| JSON unquoted numbers into DateTime read as Unix timestamps | 26.8 | Silent data correctness change on JSONEachRow ingestion | Diff a sample insert before and after |
include_from no longer defaults to /etc/metrika.xml | 26.8 | Substitutions silently missing from config | Set include_from explicitly |
EXPLAIN PLAN output format legacy → pretty | 26.x window | Scripts parsing EXPLAIN break | Update tooling |
Datetime parsing defaults also changed in 26.5 (date_time_input_format and cast_string_to_date_time_mode moved to best_effort), which is a correctness concern rather than a performance one, and worth pinning in every ingestion profile regardless of which side of the upgrade you are on.
Where we land on ClickHouse 26.8 LTS
Adopt the LTS. Take the aggregation, join and Parquet improvements as they come, because they are on by default and they mostly make the same query cheaper. Turn on always_fetch_mutated_part and create_union_system_log_tables on self-managed replicated estates once the fleet is fully on 26.8; both are low-risk operational wins. Leave parallel_replicas_plan_based, the Cascades optimizer and the Keeper LSM backend in staging under a replayed workload until they graduate from the experimental tier, and measure them against your own system.query_log and system.zookeeper_log, not against the release call.
And the usual line, which we mean literally: test every setting in this post on your own workload before it reaches production, keep a verified backup and a rehearsed restore ahead of the upgrade, and make sure your DR site is upgraded on the same schedule as primary. If you want a second pair of eyes on a 26.3 or 25.8 estate before it moves, that is what our ClickHouse support and ClickHouse consulting teams do every week.
Sources: ClickHouse 26.8 LTS changelog, ClickHouse 26.8 LTS release call, Keeper LSM-tree storage pull request #113903, ClickHouse release lifecycle, ClickHouse Keeper documentation.
Running ClickHouse in production? ChistaDATA provides ClickHouse consulting for architecture, performance and migrations, and 24×7 ClickHouse support with a 15-minute S1 response. For day-to-day operations see ClickHouse DBA services and ClickHouse managed services.
