Most of the real-time analytics on ClickHouse work we get called into has nothing to do with scan speed. The tables scan fine. What is broken is the budget between the event being written and the dashboard showing it, and the tail latency when two hundred people open that dashboard at 9 a.m. ClickHouse 26.8 LTS, released on 27 August 2026, moves several of the pieces that decide that budget, and this post walks through them in the order the data flows: ingestion, storage layout, query serving, concurrency, and then how you measure the whole thing. We cover both a self-managed cluster and ClickHouse Cloud, because the levers are not the same on the two.
This is not a feature tour of the release; we published that already, along with a separate read on 26.8 for performance, scalability and HA. This one is about one class of application: a user-facing product where a query has to come back in well under a second against data that landed seconds ago. Every figure quoted is ClickHouse Inc.’s own from the 26.8 release call unless we say otherwise, and where we give a query it is for you to measure your own system, not a promise about it.
The latency budget for real-time analytics on ClickHouse
Before touching a setting, write the budget down. For a typical product analytics or observability front end we work with, the contract is something like: an event is visible in the dashboard within 5 seconds of being produced, the p95 of a panel query is under 500 ms, and the p99 does not exceed 2 seconds at the concurrency the product actually sees.
Those three numbers live in three different parts of the system, and a change that helps one routinely hurts another. Batching inserts harder improves part counts and query latency but pushes freshness out. Adding a projection helps a panel but disables parallel replicas for that query. The diagram below is the shape we draw at the start of every engagement, with the 26.8 changes placed where they act.
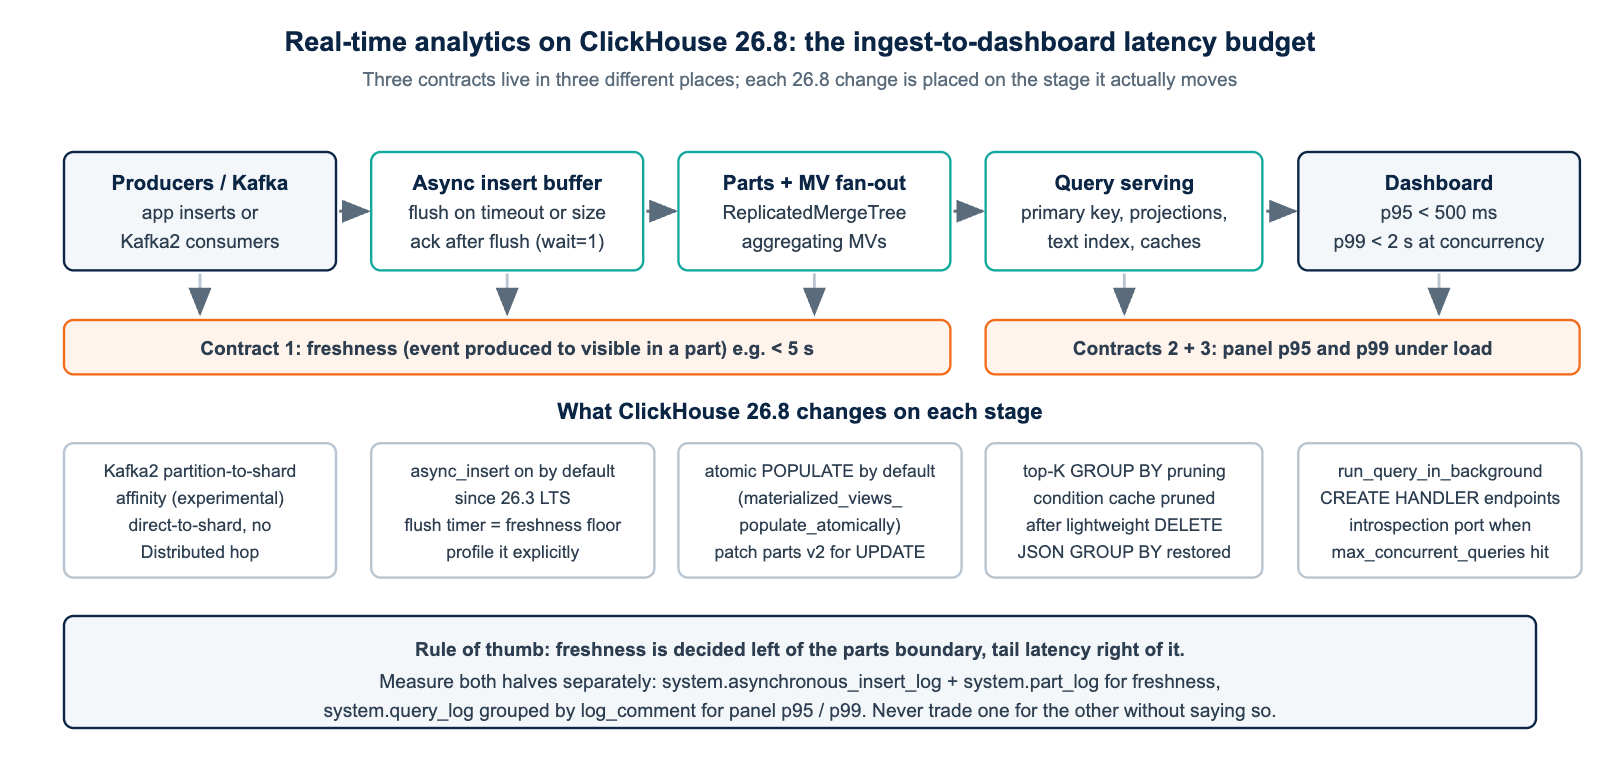
Ingestion freshness for real-time analytics on ClickHouse: async inserts are the default now
Since 26.3 LTS, async_insert is on by default, which means 26.8 is the first LTS most estates will run where the server, not the producer, decides the batch. For real-time analytics on ClickHouse this is mostly good news: the classic failure mode, an application issuing thousands of single-row inserts and drowning the cluster in parts, is absorbed by the server-side buffer. The catch is that the buffer flush now defines your freshness floor.
The two settings that matter are async_insert_busy_timeout_max_ms (default 200 ms in the adaptive mode) and async_insert_max_data_size; the buffer flushes on whichever fires first. If your contract is five seconds of freshness, 200 ms is fine. If your contract is 500 ms, you need to know that the flush timer plus the merge into a readable part is inside it, and the adaptive timeout can stretch under load.
The other decision is durability. wait_for_async_insert = 1 (the default) acknowledges the insert only after the buffer is flushed to a part, so the application knows the row is queryable. Setting it to 0 gives the producer a fast ack and moves the durability risk onto the server; we have seen teams do this to hit a throughput number and discover it at the first crash. For an analytics product, keep 1 and size the producers so the flush is not the bottleneck.
-- Profile for the ingestion user on 26.8: explicit, not inherited defaults
CREATE SETTINGS PROFILE IF NOT EXISTS rta_ingest
SETTINGS
    async_insert = 1,
    wait_for_async_insert = 1,
    async_insert_busy_timeout_max_ms = 200,
    async_insert_max_data_size = 10485760,        -- 10 MiB
    async_insert_use_adaptive_busy_timeout = 1,
    deduplicate_insert = 1,                        -- 26.2+: unified dedup switch
    insert_deduplication_token = '';               -- set per batch from the producer

ALTER USER ${CH_INGEST_USER} SETTINGS PROFILE 'rta_ingest';

-- Is the freshness floor what you think it is? (flush latency per table, last hour)
SELECT
    table,
    count()                                        AS flushes,
    round(avg(flush_time - event_time), 3)         AS avg_wait_s,
    quantile(0.99)(flush_time - event_time)        AS p99_wait_s,
    round(avg(rows))                               AS avg_rows_per_flush
FROM system.asynchronous_insert_log
WHERE event_time >= now() - INTERVAL 1 HOUR
  AND status = 'Ok'
GROUP BY table
ORDER BY p99_wait_s DESC;
Two 26.8-specific items sit on this stage. For Kafka-fed pipelines, the newer Kafka2 engine (offsets stored in Keeper, still behind allow_experimental_kafka_offsets_storage_in_keeper) gained partition-to-shard affinity in 26.5 and extended it in 26.8 through kafka_partition_shard_num and kafka_shard_count, so each shard consumes a deterministic subset of partitions and you stop paying a Distributed-table hop on the way in.
And CREATE MATERIALIZED VIEW ... POPULATE is now atomic by default (materialized_views_populate_atomically), which matters for freshness pipelines because rebuilding an aggregating MV on a live stream no longer loses or doubles the rows that arrive during the backfill. If you have been doing the “create the MV without POPULATE, then backfill with an INSERT SELECT bounded by a timestamp” dance, 26.8 lets you stop.
Storage layout for real-time analytics on ClickHouse: the sort key still decides more than any 26.8 setting
None of the release changes rescue a table whose ORDER BY does not match the dashboard’s filter columns. The pattern that works for real-time analytics on ClickHouse is unchanged: a low-cardinality tenant or account key first, then time, with the finest-grained identifier last, so every panel query reads a contiguous range of granules. What 26.8 changes is what you put around that sort key.
For string search over event payloads, the text index is production since 26.2 and in 26.8 gains lazy posting-list decoding (text_index_posting_list_apply_mode = 'lazy') plus cardinality metadata that lets a count() over a token be answered from the index. If your table still carries a tokenbf_v1 index for LIKE '%token%' panels, that index type is deprecated and the text index is the designed replacement. For numeric and temporal columns, minmax skip indexes are now auto-generated (add_minmax_index_for_numeric_columns, add_minmax_index_for_temporal_columns), so hand-placing them is the exception.
CREATE TABLE rta.events_local
(
    tenant_id     UInt32,
    event_time    DateTime64(3, 'UTC'),
    event_date    Date MATERIALIZED toDate(event_time),
    user_id       UInt64,
    event_name    LowCardinality(String),
    properties    JSON,
    message       String,
    fraud_flag    UInt8 DEFAULT 0,
    INDEX idx_message message TYPE text(tokenizer = 'splitByNonAlpha') GRANULARITY 1,
    PROJECTION prj_event_name_hourly
    (
        SELECT
            tenant_id,
            event_name,
            toStartOfHour(event_time) AS hour,
            count(),
            uniqState(user_id)
        GROUP BY tenant_id, event_name, hour
    )
)
ENGINE = ReplicatedMergeTree('/clickhouse/tables/{shard}/rta/events_local', '{replica}')
PARTITION BY toYYYYMM(event_date)
ORDER BY (tenant_id, event_time, user_id)
TTL event_date + INTERVAL 13 MONTH
SETTINGS
    index_granularity = 8192,
    enable_block_number_column = 1,   -- required for lightweight UPDATE below
    enable_block_offset_column = 1;
Two things about that DDL deserve a warning. First, the projection and parallel replicas do not compose in 26.8; a query that uses prj_event_name_hourly will not fan out across replicas. That is a deliberate trade for a dashboard panel that hits one shard’s worth of data anyway, but it means the choice is per query class, not per table, and you confirm which one won with EXPLAIN indexes = 1.
Second, the JSON column type is production since 25.3 and 26.8 restores GROUP BY performance on JSON and Dynamic columns that had regressed in the 26.x line, plus faster hashing and sorting on shared JSON data. If your properties column is still String with JSONExtract* at query time, the move to a typed JSON column is the single largest panel-latency win in this release for event data, and it is a schema change rather than a setting.
Serving sub-second: top-K, the condition cache, and the query cache
Almost every panel in real-time analytics on ClickHouse is one of three shapes: a time-bucketed count or sum, a top-N by some aggregate, or a distinct count of users. 26.8 touched all three.
The top-N shape gets enable_group_by_top_k_optimization, which stops the aggregator from materializing every key before sorting and cutting to LIMIT n; the release-call figure was a 500-million-key GROUP BY ... ORDER BY ... LIMIT going from 2.32 s and 19.9 GB to 0.22 s and 2.3 MB. Distinct counts over a partition key benefit from allow_distinct_partitions_independently. Time-bucketed counts already ran fast; what they gain is the per-partition window optimization and the adaptive aggregator switching strategies on skewed tenant distributions, which is exactly what multi-tenant analytics produces.
The two caches deserve more attention than they get. The query condition cache (use_query_condition_cache, since 25.3) remembers which granules failed a WHERE predicate and skips them on the next query with the same predicate, which is what a dashboard refreshing every 30 seconds with the same filters does. 26.8 fixes the interaction with lightweight DELETE: the cache is now pruned after a delete, so a corrected row cannot be hidden by a stale cache entry.
The query cache (use_query_cache) is the coarser tool: it stores the result set for a TTL. For a panel that fifty users open with identical parameters, a 10-second TTL means one execution instead of fifty. Set it per user profile, not globally, and never on queries carrying tenant filters unless query_cache_share_between_users is off and the cache key includes the user.
-- Profile for the dashboard service account
CREATE SETTINGS PROFILE IF NOT EXISTS rta_dashboard
SETTINGS
    max_execution_time = 5,
    max_memory_usage = 8589934592,                 -- 8 GiB per query
    max_threads = 8,
    use_query_condition_cache = 1,
    use_query_cache = 1,
    query_cache_ttl = 10,                          -- seconds; below the panel refresh interval
    query_cache_min_query_runs = 2,
    query_cache_share_between_users = 0,
    enable_group_by_top_k_optimization = 1,
    log_comment = 'rta_dashboard';                 -- overridden per panel by the app

-- Top-N panel: the shape that changed most in 26.8
SELECT
    event_name,
    count()             AS events,
    uniq(user_id)       AS users
FROM rta.events_local
WHERE tenant_id = {tenant:UInt32}
  AND event_time >= now() - INTERVAL 15 MINUTE
GROUP BY event_name
ORDER BY events DESC
LIMIT 10
SETTINGS log_comment = 'panel:top_events';

-- Did the projection or the base table serve it? Did the caches hit?
SELECT
    query_id,
    query_duration_ms,
    read_rows,
    ProfileEvents['QueryCacheHits']                       AS qc_hits,
    ProfileEvents['QueryConditionCacheHits']              AS qcc_hits,
    ProfileEvents['QueryConditionCacheMisses']            AS qcc_misses,
    projections
FROM system.query_log
WHERE type = 'QueryFinish'
  AND log_comment = 'panel:top_events'
ORDER BY event_time DESC
LIMIT 5;
The other serving-side change that real-time products should notice is CREATE HANDLER: parameterised HTTP endpoints defined in SQL, so the application calls /api/top_events?tenant=42 instead of shipping SQL over the wire. It is a convenience, but it also means the query text is fixed on the server side, which makes system.query_log analysis by normalized_query_hash clean and closes the door on ad hoc SQL from the front end. Use it together with VALID FOR <interval> on the service credentials.
Corrections without FINAL: lightweight UPDATE and patch parts
Data behind real-time analytics on ClickHouse is never quite immutable. Late-arriving attributes, a user merging two identities, a fraud flag applied an hour later. The traditional ClickHouse answers were a ReplacingMergeTree with FINAL on every read, which costs you on every panel, or a mutation, which rewrites parts and lands minutes later. Since 25.7 there is a third path: lightweight UPDATE writes only the changed columns into small patch parts that are applied at read time and folded in at merge. 26.8 ships the second version of the patch-part format with a new merging strategy, and the feature remains beta behind enable_lightweight_update, requiring the two block-tracking table settings in the DDL above.
SET enable_lightweight_update = 1;

-- Apply a late fraud flag without a mutation and without FINAL on the read path
UPDATE rta.events_local
SET fraud_flag = 1
WHERE tenant_id = {tenant:UInt32}
  AND user_id = {user:UInt64}
  AND event_time >= now() - INTERVAL 1 DAY;

-- Budget check: patch parts should stay a small fraction of the table
SELECT
    table,
    countIf(startsWith(partition, 'patch-'))                        AS patch_parts,
    countIf(NOT startsWith(partition, 'patch-'))                    AS data_parts,
    formatReadableSize(sumIf(bytes_on_disk, startsWith(partition, 'patch-'))) AS patch_bytes
FROM system.parts
WHERE database = 'rta' AND active
GROUP BY table;
The operating rule we apply: updates touching more than roughly 10 percent of rows go back to being a mutation or a rebuild, because patch parts are applied on read and the cost is paid by the very panels you are protecting. Watch the ratio above, and expect system.mutations to trend towards empty if patch parts are doing their job. Note that this is beta in 26.8; it goes to staging first, under the same replayed query workload as everything else.
Concurrency and tail latency in real-time analytics on ClickHouse: where self-managed and Cloud diverge
The p99 in the budget for real-time analytics on ClickHouse is a concurrency problem, not a single-query problem. The 200 dashboards at 9 a.m. compete with the ingestion merges, the hourly MV refresh, and the analyst who just ran an unbounded query. On a self-managed cluster the tools are the ones you already know, and 26.8 sharpens two of them. The introspection port gives you a dedicated listener and thread pool so an operator can still reach the server when max_concurrent_queries is exhausted, which is precisely when you need SHOW PROCESSLIST most. And run_query_in_background lets the long backfill or export run to completion server-side while the connection is released, so a disconnected client no longer leaves a half-finished job behind.
Isolation between ingestion and serving is the harder problem, and this is where the two deployment models split. On a self-managed ReplicatedMergeTree cluster you isolate by topology: dedicate replicas to serving with load_balancing and a read-only user, keep inserts landing on the others, and use the workload scheduler to cap what the analyst profile can take. Parallel replicas, GA in the 26.x line with the plan-based mode still experimental in 26.8, let a single heavy panel fan out across the serving replicas when it does not use a projection.
On ClickHouse Cloud the same problem is solved by compute-compute separation: a second compute group over the same storage, with its own endpoint, so ingestion and dashboards never share a CPU. That is genuinely useful, and it has no open-source equivalent from ClickHouse Inc.; the self-managed substitutes are topology plus parallel replicas, or Altinity’s Project Antalya if you want stateless swarms over object storage.
Self-managed isolation knobs that actually hold at 9 a.m.
Topology does the coarse isolation; the settings profile does the fine work. Three limits do most of it for real-time analytics on ClickHouse. max_concurrent_queries_for_user on the dashboard account caps the blast radius of a client-side retry storm, which is the usual cause of a p99 spike that looks like a server problem. max_execution_time at a few seconds on the same account guarantees that a pathological panel fails fast instead of holding threads.
And the analyst account gets a lower priority plus a max_memory_usage_for_user ceiling, so a curious query on the same replicas yields CPU to the product traffic rather than competing with it. The workload scheduler (CREATE WORKLOAD and CREATE RESOURCE, in the server since the 24.x line) formalises the same idea when you have more than two classes of user; it is worth adopting once the profiles stop being enough, not before.
-- Fine-grained isolation on the serving replicas (self-managed)
ALTER SETTINGS PROFILE rta_dashboard
SETTINGS
    max_concurrent_queries_for_user = 40,
    max_execution_time = 5,
    priority = 1;

CREATE SETTINGS PROFILE IF NOT EXISTS rta_analyst
SETTINGS
    max_execution_time = 120,
    max_memory_usage_for_user = 34359738368,       -- 32 GiB across all of this user's queries
    max_threads = 4,
    priority = 10;                                  -- higher number = lower priority

-- Who is actually holding the threads right now? (works on the introspection port too)
SELECT
    user,
    count()                                        AS running,
    sum(memory_usage)                              AS mem,
    max(elapsed)                                   AS longest_s
FROM system.processes
GROUP BY user
ORDER BY running DESC;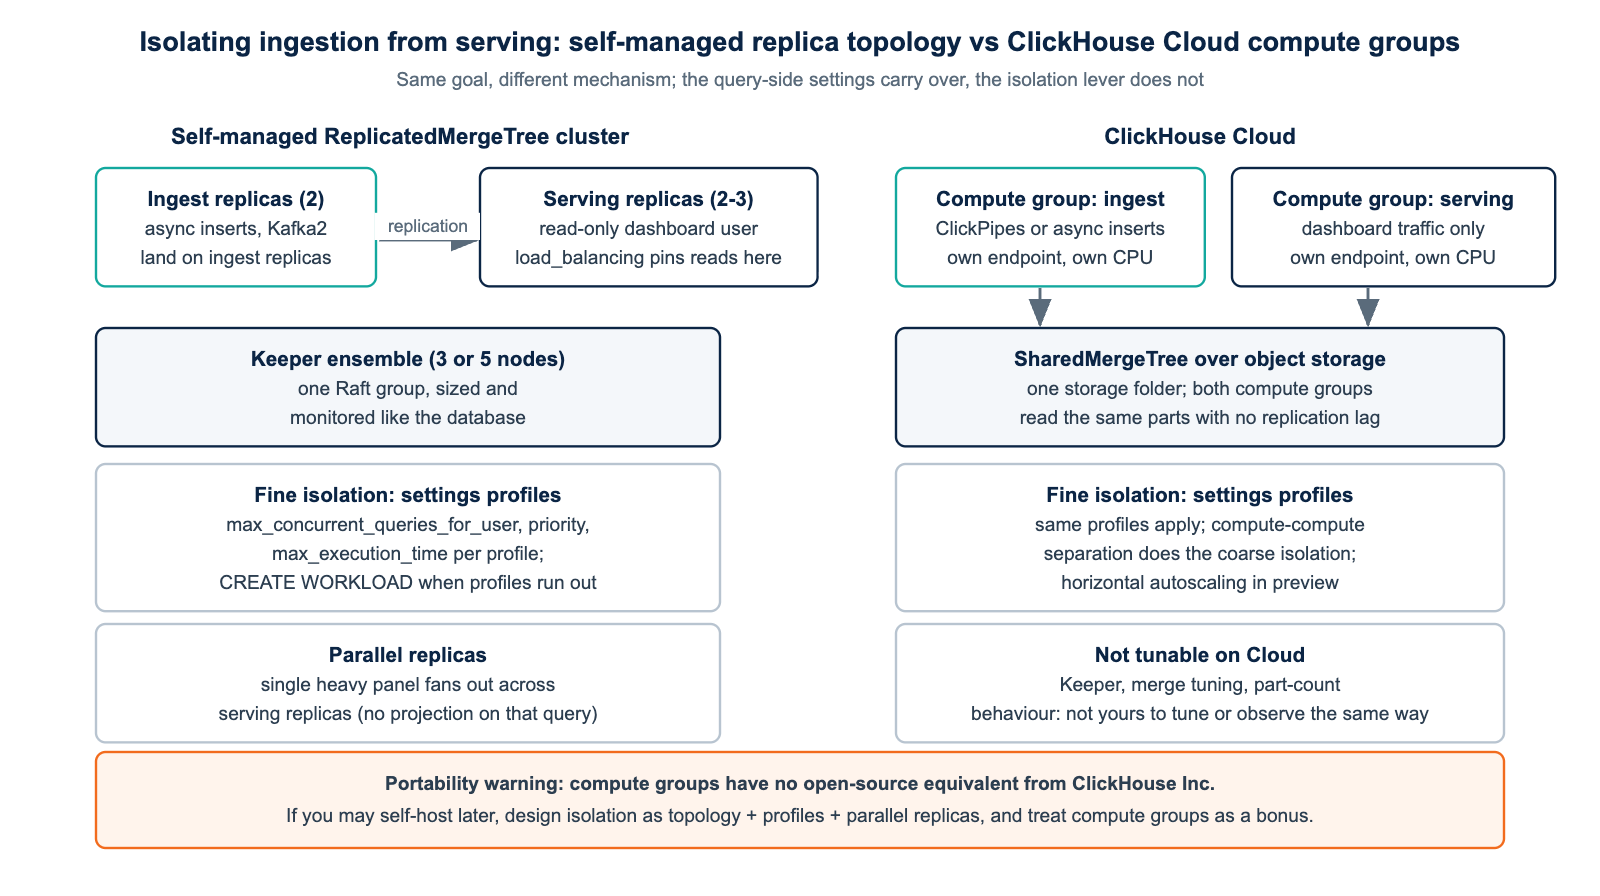
What carries over between the two: every query-side setting in this post, the sort-key and projection design, the text index, the caches, top-K, lightweight UPDATE, and CREATE HANDLER. What does not: on Cloud, SharedMergeTree replaces ReplicatedMergeTree, so part counts, merge timing and the freshness floor behave differently, there is no Keeper for you to tune, and the 26.8 core reaches your service on its release channel rather than on your schedule; at the time of writing the Cloud release notes run to 26.6, so check SELECT version() before assuming any of the above is live. Kafka ingestion on Cloud goes through ClickPipes rather than the Kafka table engine, which is still marked experimental in the open-source docs.
Application-side habits that undo the 26.8 gains
Half the real-time analytics on ClickHouse latency problems we look at are created above the database. A dashboard that sends SELECT ... FINAL on a ReplacingMergeTree defeats parallel replicas and the condition cache in one line; move deduplication to the write side or to a lightweight UPDATE as described above. A panel with no time bound, or one that filters on a tenant identifier passed as a String against a LowCardinality(String) column with a cast in the predicate, cannot use the primary key and will read the whole partition regardless of what the aggregator does afterwards.
Bind the parameters with typed placeholders, {tenant:UInt32} as in the examples here, so the type matches the column and the predicate stays sargable. uniqExact where uniq would do turns a fixed-memory sketch into an unbounded hash set, and it shows up first on exactly the top-N panels 26.8 made cheaper. And a refresh interval that is shorter than the query cache TTL means every refresh is a cache hit for a stale result, which is fine for a count and wrong for an alert; set the TTL per panel class, not per service.
The other habit that hurts real-time analytics on ClickHouse is issuing the same panel from every browser tab a user has open. query_cache_min_query_runs = 2 in the profile above means the second identical execution is served from cache; if your front end deduplicates in-flight requests per user, you get most of that benefit before the query ever reaches ClickHouse. None of this is new in 26.8, but 26.8 makes the database side fast enough that the application side becomes the visible bottleneck, which is a good problem to have and a real one to plan for.
Measuring real-time analytics on ClickHouse: the budget, not the benchmark
The release-call speedups tell you where to look for real-time analytics on ClickHouse; they do not tell you what your users see. The measurement we insist on before and after any 26.8 change is the panel-level tail latency, tagged from the application through log_comment, alongside the freshness lag from the async insert log. Together they are the two halves of the budget, and a change that improves one at the expense of the other shows up immediately.
-- Panel tail latency for the last hour, one row per dashboard panel
SELECT
    log_comment                                         AS panel,
    count()                                             AS runs,
    quantile(0.50)(query_duration_ms)                   AS p50_ms,
    quantile(0.95)(query_duration_ms)                   AS p95_ms,
    quantile(0.99)(query_duration_ms)                   AS p99_ms,
    round(avg(read_rows))                               AS avg_read_rows,
    round(100 * countIf(ProfileEvents['QueryCacheHits'] > 0) / count(), 1) AS cache_hit_pct,
    max(memory_usage)                                   AS peak_mem
FROM system.query_log
WHERE type = 'QueryFinish'
  AND event_time >= now() - INTERVAL 1 HOUR
  AND log_comment LIKE 'panel:%'
GROUP BY panel
ORDER BY p99_ms DESC;

-- Freshness: time from insert arrival to the part being active, per table
SELECT
    table,
    quantile(0.95)(duration_ms) / 1000                  AS p95_new_part_s,
    count()                                             AS parts_created,
    round(avg(rows))                                    AS avg_rows_per_part
FROM system.part_log
WHERE event_type = 'NewPart'
  AND event_time >= now() - INTERVAL 1 HOUR
  AND database = 'rta'
GROUP BY table;
For real-time analytics on ClickHouse the discipline is simple: run both on 26.3 for a week, upgrade, run both for a week, and compare medians and p99s rather than best runs. If the p99 moved and the p50 did not, look at concurrency and the caches before you look at the aggregator. If freshness moved, look at the async insert timeout and the part count before you look at Kafka. Those two rules resolve most of what we see.
Real-time analytics on ClickHouse: self-managed versus Cloud, lever by lever
| Budget stage | Self-managed 26.8 | ClickHouse Cloud |
|---|---|---|
| Ingestion freshness | async_insert profile, Kafka2 shard affinity, direct-to-shard inserts | async_insert profile, ClickPipes; SharedMergeTree flush and merge timing differs |
| Storage layout | Sort key, text index, projections, JSON type | Same, on SharedMergeTree; projection behaviour identical at the SQL level |
| Serving | Top-K, condition cache, query cache, CREATE HANDLER | Same, when 26.8 reaches your release channel |
| Corrections | Lightweight UPDATE (beta), patch parts v2 | Same, subject to Cloud enabling the beta setting |
| Isolation | Replica topology, workload scheduler, parallel replicas | Compute-compute separation; horizontal autoscaling in preview |
| Coordination | Keeper you size and monitor; 26.8 adds experimental LSM on-disk state | Not your problem, and not tunable |
| Upgrade path | Rolling, Keeper first, with the 26.3 to 26.8 breaking-change list | Release channel; verify with SELECT version() |
Where we land
For real-time analytics on ClickHouse, 26.8 LTS is worth the upgrade for three things in this order: the top-K aggregation change, because it is the most common panel shape and it is on by default; the condition-cache fix after lightweight deletes, because it removes a correctness trap on refreshing dashboards; and atomic POPULATE, because it makes MV pipelines safe to rebuild live. Design the ingestion profile explicitly rather than inheriting the async-insert default, move event payloads to the JSON type if you have not, and pick projections or parallel replicas per panel class with EXPLAIN in hand. Leave lightweight UPDATE and Kafka2 affinity in staging until they leave beta and experimental respectively.
And the standing caveat, which is not a formality: every setting here changes behaviour under load in ways that depend on your data distribution. Test on a staging replica with a replayed query log before production, keep a verified backup and a rehearsed restore before the upgrade, and upgrade your DR site on the same schedule. If you want us to read your system.query_log against your latency budget before you move, that is a normal week for the ChistaDATA ClickHouse consulting and 24×7 support teams.
Sources: ClickHouse 26.8 changelog, ClickHouse 26.8 release call, Asynchronous inserts, Query cache, Parallel replicas, ClickHouse Cloud changelog 2026.
Running ClickHouse in production? ChistaDATA provides ClickHouse consulting for architecture, performance and migrations, and 24×7 ClickHouse support with a 15-minute S1 response. For day-to-day operations see ClickHouse DBA services and ClickHouse managed services.
