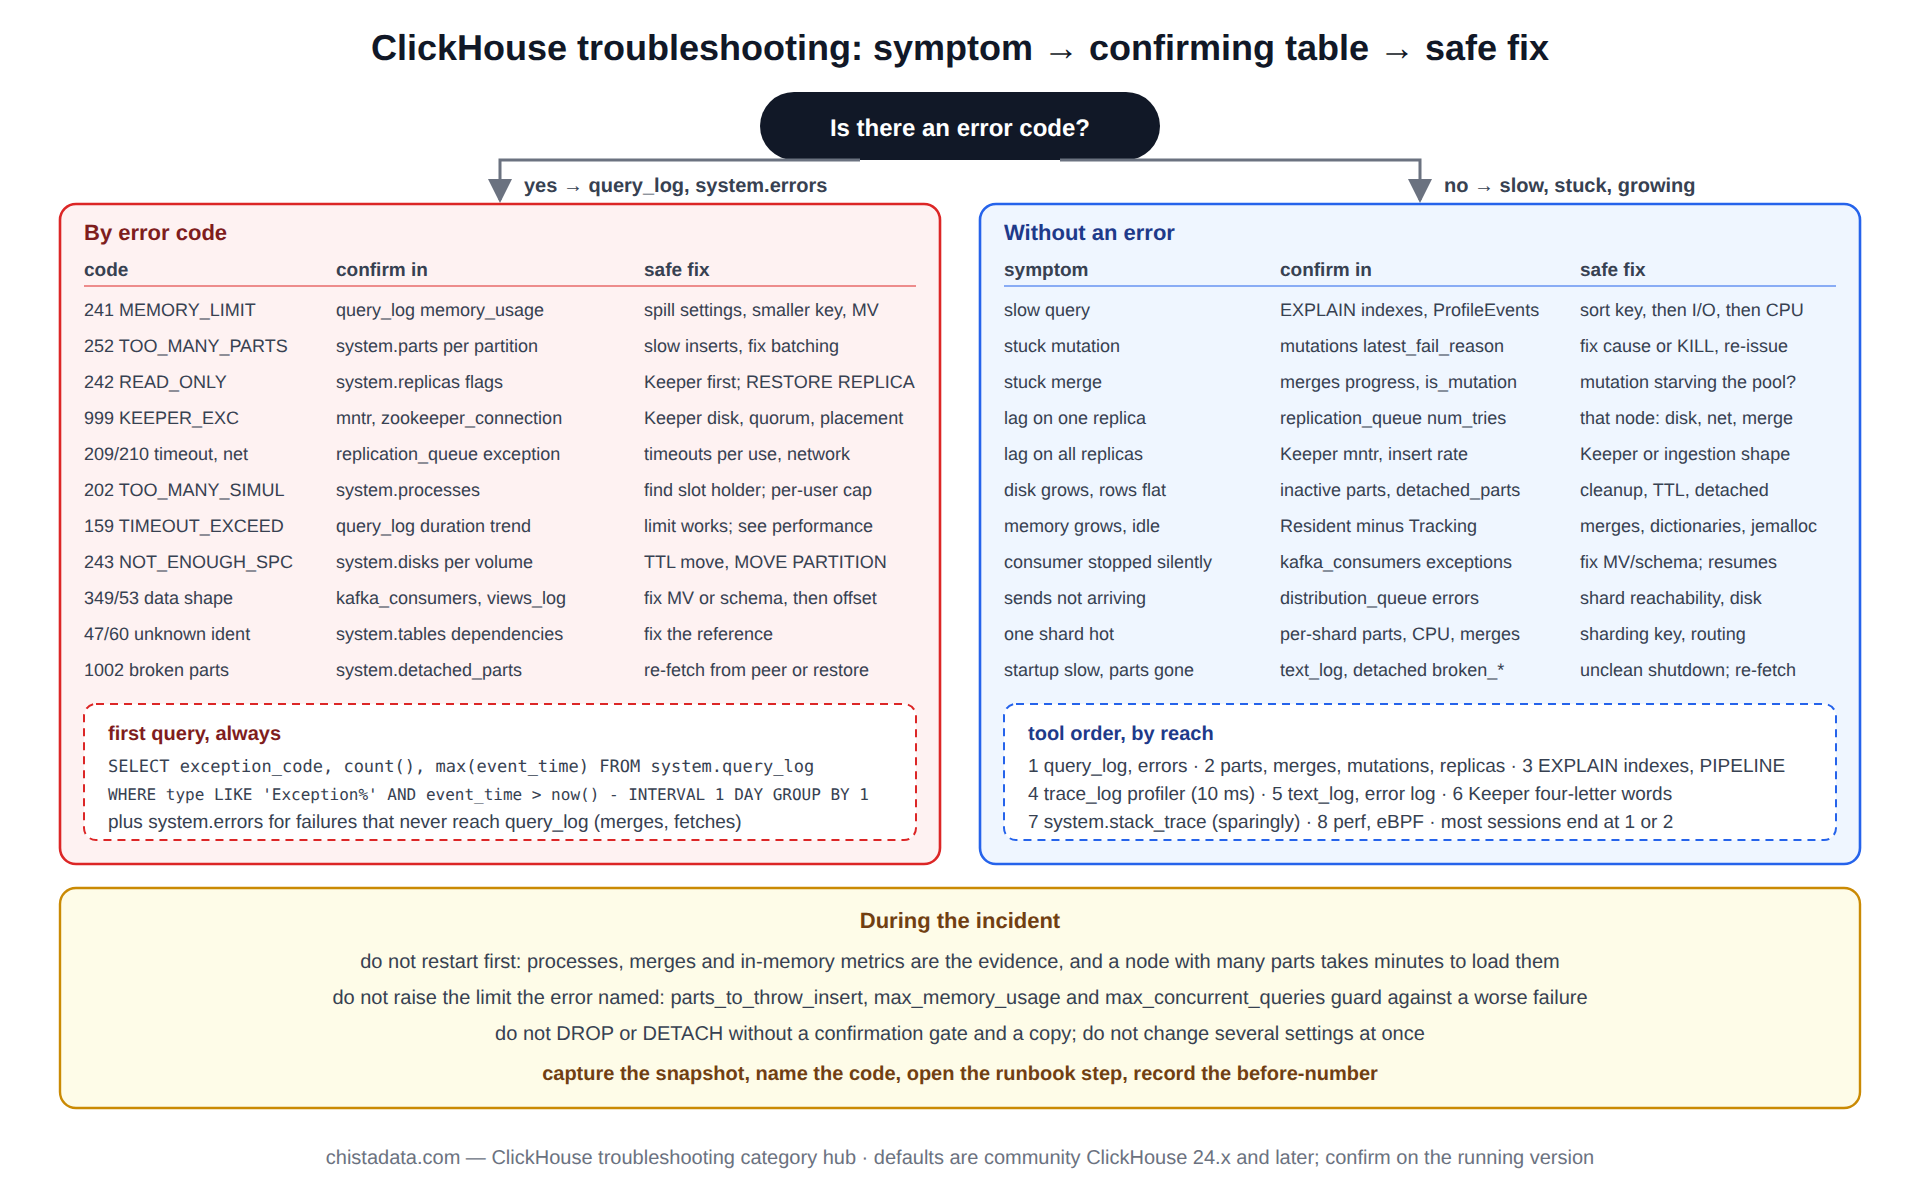
ClickHouse troubleshooting is faster when it starts from the exact error, because ClickHouse names its failures precisely: every exception carries a numeric code and a stable symbolic name, and most of the codes that reach production map to one or two causes each. This page is organised as a reference by symptom, from the error text an engineer sees to the system table that confirms the cause to the fix that is safe on a running cluster.
It covers the twelve failures that account for most production tickets, then the symptoms that arrive without an error at all (slow, stuck, growing), and finally the tools that make any ClickHouse troubleshooting session shorter.
The posts in this category go deeper on each entry: the CHT-400 techniques post, the OOM-killer post, the sharding and shard-contention posts, the index-selection and under-utilised-index posts, the high-CPU post, and the EXPLAIN guides. This page is the index that routes a symptom to the right one.
ClickHouse troubleshooting by error code: the twelve that matter
Code 241, MEMORY_LIMIT_EXCEEDED. A query, or the whole server, crossed a memory limit. The message says which: “for query” means max_memory_usage, “for user” means max_memory_usage_for_user, “total” means max_server_memory_usage. Confirm in system.query_log with exception_code = 241 and read memory_usage of the offenders. The fix is a spill setting (max_bytes_before_external_group_by), a smaller aggregation key, or pre-aggregation in a materialized view; raising the limit is the last option, not the first.
Code 252, TOO_MANY_PARTS. A partition crossed parts_to_throw_insert (default 3,000 since 24.x). Confirm with the parts-per-partition query below. The cause is almost always small inserts or a partition key that is too fine. Stop or slow the inserts, let merges catch up, then fix the batching; raising the threshold only moves the failure later and makes queries slower meanwhile.
Code 242, TABLE_IS_READ_ONLY. A replicated table lost its Keeper session or found its metadata diverged from Keeper’s. Confirm in system.replicas (is_readonly, is_session_expired, zookeeper_exception). Session loss usually self-heals once Keeper is reachable; divergence needs SYSTEM RESTORE REPLICA (21.x and later) after the cause is understood.
Code 999, KEEPER_EXCEPTION. The coordinator itself: connection loss, session expiry, or a znode operation that failed. Check Keeper’s four-letter mntr and srvr commands for leader state and outstanding requests, and system.zookeeper_connection on the server. Keeper on a slow disk or a co-located busy node is the usual root cause.
Code 209, SOCKET_TIMEOUT, and code 210, NETWORK_ERROR. A client or an interserver call timed out. For clients, receive_timeout and send_timeout (default 300 s) are usually being hit by a legitimately long query; for interserver, replication fetches are timing out on a large part or a saturated network. system.replication_queue with last_exception shows the interserver case.
Code 202, TOO_MANY_SIMULTANEOUS_QUERIES. max_concurrent_queries (default 100 per server since 22.x) was reached. Confirm in system.processes. The fix is rarely to raise it; it is to find what is holding slots (a dashboard with no query timeout, a retry storm) and to give heavy users their own max_concurrent_queries_for_user.
Code 159, TIMEOUT_EXCEEDED. max_execution_time was hit. This is the limit working as designed; the ClickHouse troubleshooting question is why the query got slower, which the performance hub answers in ten questions.
Code 243, NOT_ENOUGH_SPACE. A merge or an insert could not reserve disk. system.disks shows free space per disk; on tiered storage the full disk may be the hot volume while cold has room, and the fix is the TTL move or a manual ALTER TABLE ... MOVE PARTITION TO VOLUME.
Code 349, CANNOT_INSERT_NULL_IN_ORDINARY_COLUMN, and code 53, TYPE_MISMATCH. Data-shape errors, most often from a Kafka engine table whose upstream message changed. Confirm in system.kafka_consumers (since 23.x) and the materialized view’s exception in system.query_views_log; fix the view or the schema, then reset the consumer offset if messages were skipped.
Code 47, UNKNOWN_IDENTIFIER, and code 60, UNKNOWN_TABLE, after a deploy. A rename or drop that a materialized view, a Distributed table or a dictionary still references. system.tables with dependencies_table lists what depends on what; the fix is the reference, and the lesson is to check dependencies before renaming.
Code 1002, UNKNOWN_EXCEPTION, with “broken” parts on start-up. After an unclean shutdown, parts that fail checksum verification are moved to detached/ with a broken_ prefix. system.detached_parts lists them; on a replicated table the replica re-fetches them from a peer, on a non-replicated table they are gone unless a backup holds them.
-- the first ClickHouse troubleshooting query: what has been failing, and with which code
SELECT
    exception_code,
    any(substring(exception, 1, 140)) AS sample_message,
    count()                           AS occurrences,
    max(event_time)                   AS last_seen,
    uniq(normalized_query_hash)       AS distinct_shapes
FROM system.query_log
WHERE type IN ('ExceptionBeforeStart', 'ExceptionWhileProcessing')
  AND event_time > now() - INTERVAL 24 HOUR
GROUP BY exception_code
ORDER BY occurrences DESC;

-- system.errors covers exceptions that never reach query_log (background merges, fetches)
SELECT name, code, value, last_error_time, last_error_message
FROM system.errors
WHERE last_error_time > now() - INTERVAL 24 HOUR
ORDER BY last_error_time DESC;
ClickHouse troubleshooting without an error: slow, stuck, growing
Slow queries, no exception. The ten-question review on the performance hub is the full method; the short ClickHouse troubleshooting version is three checks. EXPLAIN indexes = 1 to see whether the sort key prunes. system.query_log ProfileEvents to see whether time is I/O (OSReadBytes) or CPU (OSCPUVirtualTimeMicroseconds). And system.trace_log with the profiler on for a single slow run to see which function dominates. The archive’s high CPU usage and under-utilised index posts are the two most common outcomes.
Stuck mutation or merge. system.mutations with is_done = 0 and a latest_fail_reason is a mutation that will never finish; system.merges with a merge whose progress has not moved in an hour is starved or enormous. The cure for a failing mutation is to fix the cause or KILL MUTATION and re-issue; for a starved merge, check whether mutations are consuming the pool (is_mutation = 1 rows in system.merges).
Growing replication lag. system.replicas.absolute_delay rising on one replica while others are fine points at that node (disk, network, a long merge holding the queue); rising on all replicas points at Keeper or the insert rate. system.replication_queue with num_tries and last_exception shows the entry that is blocking the queue.
Growing disk with stable row count. Either old parts are not being cleaned (system.parts with active = 0 and old remove_time), the TTL is not firing (ttl_only_drop_parts and the merge schedule), or detached/ has accumulated parts nobody looked at. system.detached_parts and a size query on the store/ directory answer it.
Growing memory with no queries. Merges, dictionary reloads, or jemalloc fragmentation (MemoryResident minus MemoryTracking growing for days). The memory hub has the seven-layer model; SYSTEM JEMALLOC PURGE (since 23.x) is the immediate relief for fragmentation.
-- the three "no error" queries, in one pass
SELECT 'parts_per_partition' AS check, max(cnt) AS value
FROM (SELECT count() cnt FROM system.parts WHERE active GROUP BY table, partition)
UNION ALL
SELECT 'max_replica_delay_s', max(absolute_delay) FROM system.replicas
UNION ALL
SELECT 'stuck_mutations', count() FROM system.mutations WHERE NOT is_done AND latest_fail_reason != ''
UNION ALL
SELECT 'inactive_parts_older_than_1h', count()
FROM system.parts WHERE NOT active AND remove_time < now() - INTERVAL 1 HOUR
UNION ALL
SELECT 'resident_minus_tracked_bytes',
    (SELECT value FROM system.asynchronous_metrics WHERE metric = 'MemoryResident')
  - (SELECT value FROM system.metrics WHERE metric = 'MemoryTracking');
Reading the server log during ClickHouse troubleshooting
The error log (/var/log/clickhouse-server/clickhouse-server.err.log by default) and system.text_log hold what the query log cannot: background merge failures, fetch retries, Keeper session events, start-up part loading and the OOM killer’s aftermath.
Three line patterns are worth knowing by sight. Code: 999. Coordination::Exception: Session expired marks the start of a read-only episode and its timestamp anchors the incident timeline. Renaming unexpected part and Detaching broken part on start-up mean the previous shutdown was unclean and the parts named are in detached/. And Too many parts (N). Merges are processing significantly slower than inserts is the warning that arrives minutes before error 252, which is why the five-minute parts check exists.
-- the same log, queryable: text_log is off by default, enable it in config.xml for ClickHouse troubleshooting
SELECT
    event_time,
    level,
    logger_name,
    substring(message, 1, 200) AS message
FROM system.text_log
WHERE level IN ('Error', 'Fatal')
  AND event_time > now() - INTERVAL 6 HOUR
ORDER BY event_time DESC
LIMIT 50;
Log level is a setting worth checking before an incident, not during one. trace is the default in the packaged config and produces gigabytes per day on a busy node; information is enough for production, with debug enabled on one replica for the duration of a specific investigation. A node whose log volume is itself filling the disk is a ClickHouse troubleshooting case that the log level created.
Keeper: the ClickHouse troubleshooting cases that live outside clickhouse-server
ClickHouse Keeper (or ZooKeeper on older estates) is a separate process with its own failure modes, and half of the read-only and replication-lag incidents on replicated clusters begin there. The four-letter commands answer the first questions: mntr for zk_server_state (leader or follower), zk_outstanding_requests (a queue that grows means the Keeper node cannot keep up), zk_avg_latency and zk_znode_count; srvr for the connection count; ruok for liveness.
On the ClickHouse side, system.zookeeper_connection shows which Keeper host each server is attached to and for how long, and a session age of seconds on a server that has been up for days means it is reconnecting repeatedly.
# on each Keeper host
echo mntr | nc localhost 9181 | grep -E 'zk_server_state|zk_outstanding_requests|zk_avg_latency|zk_znode_count|zk_followers'

# from clickhouse-client: which Keeper host, how old is the session
SELECT host, port, index, connected_time, session_uptime_elapsed_seconds, is_expired
FROM system.zookeeper_connection;
The causes that recur are a Keeper log directory on the same disk as ClickHouse data (fsync latency under merge load makes Keeper miss heartbeats), a quorum of two (a single failure loses the majority), and a Keeper node co-located with a ClickHouse server that swaps or stalls under memory pressure. Each is a topology fix rather than a setting, and the replication archive covers the sizing rules.
Ingestion pipeline symptoms: when the error is upstream
A Kafka engine table that has stopped consuming produces no error in system.query_log, because no query ran. The symptom is consumer lag in Kafka’s own metrics or an empty target table for the last hour. system.kafka_consumers (since 23.x) shows each consumer’s assignments, last poll time and, critically, exceptions with the message and timestamp of the failure that stopped it; system.query_views_log records every materialized-view execution, including the exception that a malformed message raised.
The fix is at the view or the schema, and after it the consumer resumes on its own; if messages were skipped by kafka_skip_broken_messages, the count is in the same table and the replay decision belongs to the data owner. The Kafka hub and the ingestion hub cover the pipeline designs behind these tables.
The ClickHouse troubleshooting toolkit, in order of reach
| Tool | Answers | Cost to run on production |
|---|---|---|
| system.query_log, system.errors | what failed, how often, which shape | none |
| system.parts, merges, mutations, replicas | storage-layer and replication state | none |
| EXPLAIN indexes = 1, EXPLAIN PIPELINE | why a query reads or runs the way it does | none (plans only) |
| system.trace_log with profiler settings | where CPU or wall time goes inside a query | low at 10 ms sampling |
| system.text_log, server error log | background failures, Keeper events, start-up | none |
| clickhouse-keeper-client, four-letter words | coordinator health, znode state | none |
| system.stack_trace | what every thread is doing right now | brief pause; use sparingly |
| perf, eBPF (bcc, bpftrace) | below the process: I/O latency, scheduler, page cache | low to moderate |
The order is deliberate, and it is the order a ClickHouse troubleshooting session should follow even when the engineer already suspects the answer. Most ClickHouse troubleshooting ends at the first two rows, and an engineer who reaches for perf before reading system.query_log spends an hour learning what the log would have said in a minute. The query profiling and EXPLAIN guide posts cover rows three and four; the EXPLAIN PIPELINE post is the reference for reading a plan’s parallelism.
Cluster-level ClickHouse troubleshooting: when one node is not the problem
On a sharded cluster the failure is often distributed even when the symptom is local. A Distributed table’s inserts queue on the sending node when a shard is unreachable (system.distribution_queue, with error_count and last_exception), and the sender’s disk fills with pending blocks while the receiving shard looks healthy.
A query that is slow only from one initiator points at that initiator’s role in the final merge. And a shard that is hot because the sharding key sends it a disproportionate share of rows shows up as one node’s parts, merges and CPU all being higher than its peers’ by the same factor. The sharding troubleshooting and shard contention posts cover the three cases with the per-shard queries.
-- distributed sends that are not arriving
SELECT
    database,
    table,
    data_path,
    is_blocked,
    error_count,
    data_files,
    formatReadableSize(data_compressed_bytes) AS pending,
    last_exception
FROM system.distribution_queue
WHERE error_count > 0 OR data_files > 0
ORDER BY error_count DESC;
What not to do during ClickHouse troubleshooting
Do not restart first. A restart clears system.processes, system.merges and the in-memory metrics that explain the incident, and on a node with many parts it takes minutes to come back while it loads them. Do not raise a limit to make an error go away: parts_to_throw_insert, max_memory_usage and max_concurrent_queries are all set where they are because the failure past them is worse.
Do not DROP or DETACH anything during an incident without a confirmation gate and a copy; a detached part can be re-attached, a dropped partition needs a restore. And do not change several settings at once, because the one that fixed it cannot then be identified and the one that broke something else cannot be isolated.
Version notes
Error codes are stable across releases, but defaults are not: parts_to_throw_insert rose from 300 to 3,000 in 24.x, max_concurrent_queries is 100 per server since 22.x (earlier versions used a different default and semantics), system.kafka_consumers is 23.x and later, SYSTEM JEMALLOC PURGE is 23.x and later, SYSTEM RESTORE REPLICA is 21.x and later. The complete list of error codes is in the ClickHouse source (ErrorCodes.cpp); confirm all of the above against SELECT version() on the cluster in question.
Reading the archive
The archive is organised the way this page is: by what the engineer sees first. Posts named for an error or a symptom are the fastest route in; posts named for a tool (EXPLAIN, the profiler, PMM integration) are the ones to read once, before the incident.
Start with the CHT-400 techniques post for the method, then follow the symptom: the OOM-killer and system-resources posts for memory, the index posts for slow reads, the sharding posts for cluster symptoms, and the EXPLAIN and profiling posts for the tools. The DBA support hub maps the same symptoms to severities and response targets.
ChistaDATA’s 24×7 ClickHouse support works from this router, and consulting engagements turn the recurring entries into standing checks. Test every fix on staging with a production-sized sample before applying it to a live cluster, keep a tested restore, and capture the evidence before the restart.