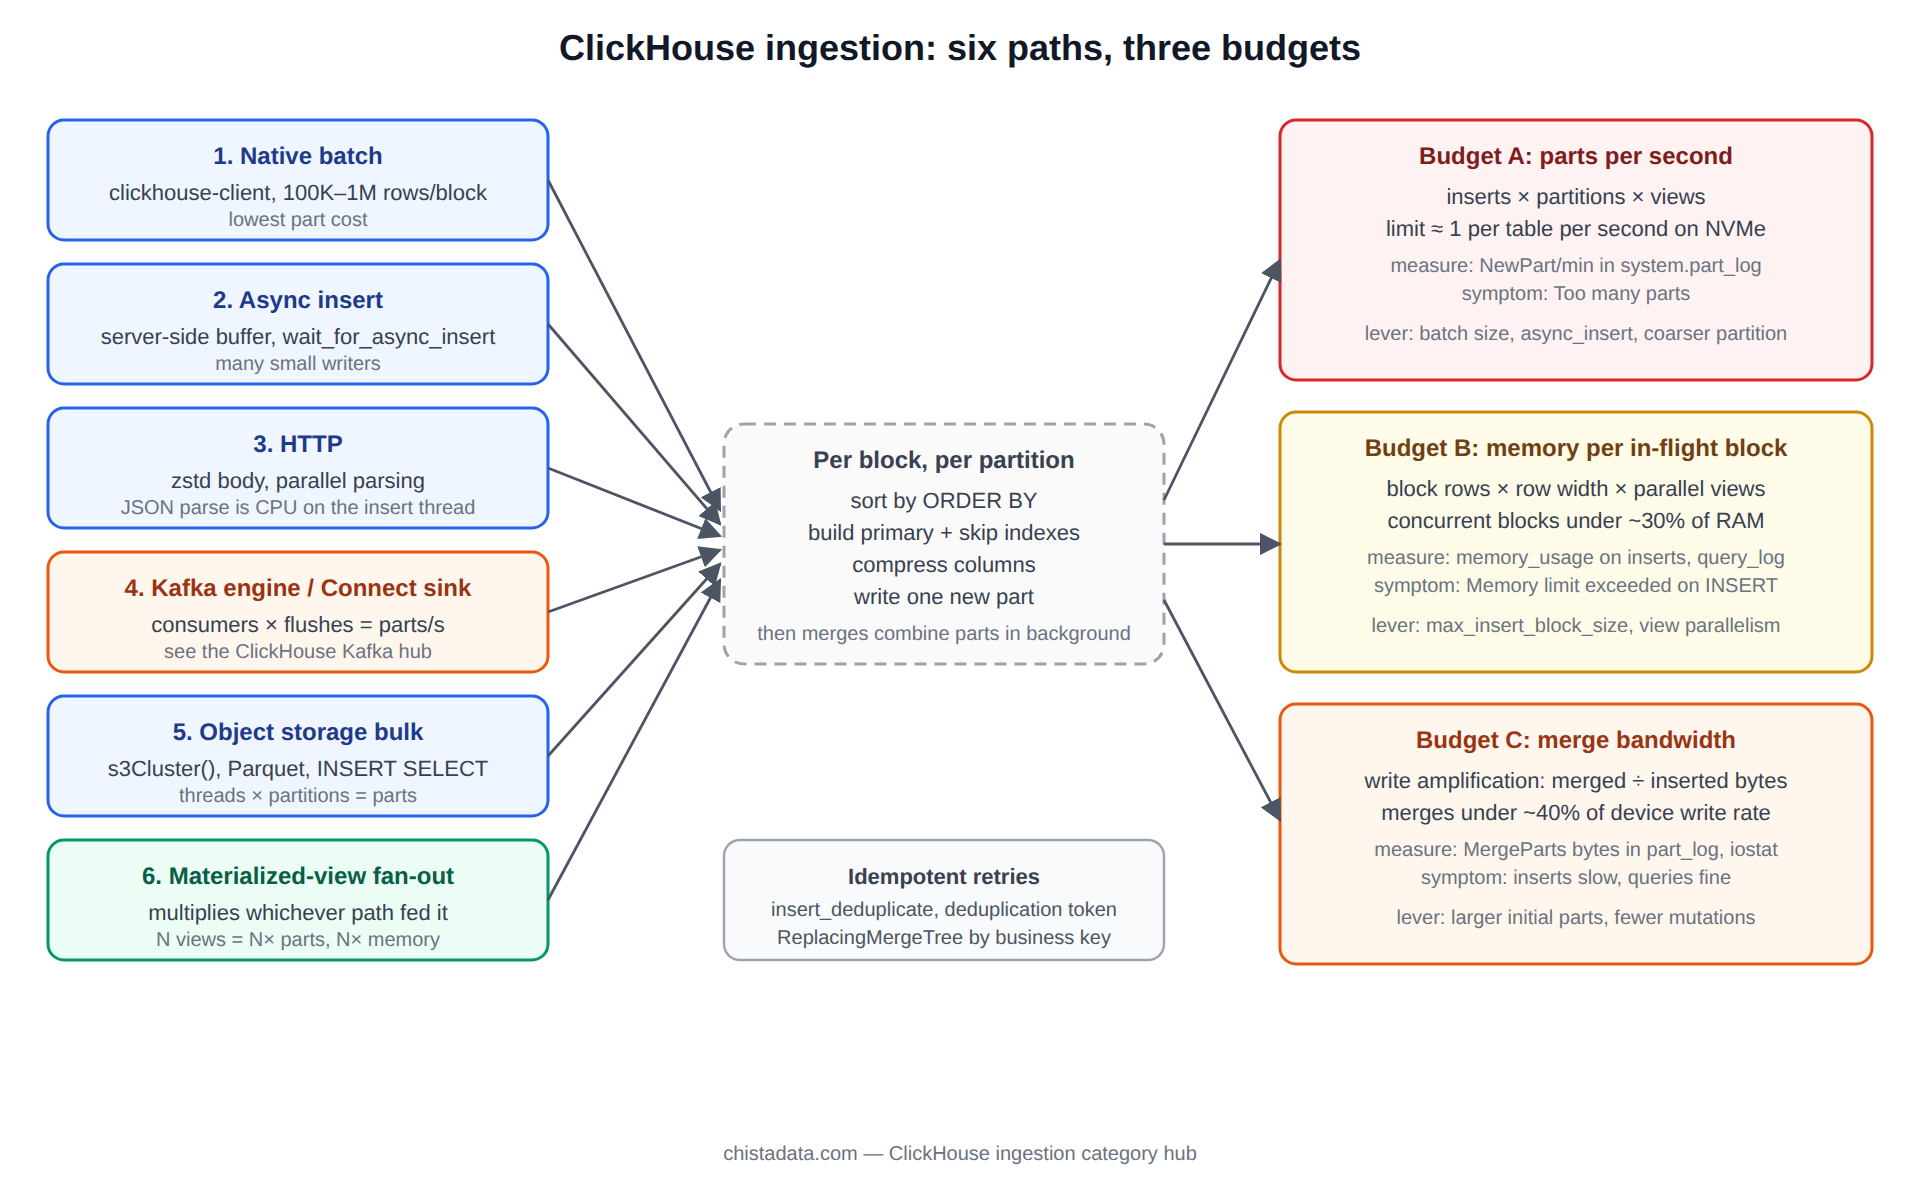
ClickHouse ingestion capacity is decided by three budgets, not by one throughput number. There is a part budget, because every insert creates parts and merges have to absorb them. There is a memory budget, because each in-flight insert block is held, sorted and compressed in RAM before it touches disk. And there is a network and CPU budget on the path the data takes in, which differs by a factor of ten between a native-protocol batch insert and a stream of small HTTP JSON requests.
This page works through the six ingestion paths we run for clients, what each one costs against those three budgets, and the settings and queries that keep a pipeline inside them.
The posts filed under this category cover the individual mechanisms: asynchronous inserts, JSON handling, high-volume loading, vector data, the Elasticsearch-to-ClickHouse migration path, and the 26.8 LTS settings review. This page is the budget model that sits above them.
What one INSERT costs: the ClickHouse ingestion unit of work
An insert into a MergeTree table arrives as one or more blocks. For each block, ClickHouse sorts the rows by the table’s ORDER BY, builds the sparse primary index and any skip indexes, compresses each column, and writes one new part per partition the block touches. The part is then visible to queries and to the background merge scheduler, which will eventually combine it with neighbours. That sequence is the same whether the block came from a client, from a Kafka consumer or from a materialized view.
The cost that scales badly is the part count. A block of one million rows and a block of one hundred rows both produce a part with a full set of column files and mark files. Ten thousand tiny inserts per minute therefore produce ten thousand parts per minute, and the merge scheduler cannot combine them faster than the device can rewrite them. The symptom is the Too many parts exception, which is ClickHouse refusing further inserts to protect itself.
SELECT
    table,
    partition,
    count()                              AS active_parts,
    round(avg(rows))                     AS avg_rows_per_part,
    formatReadableSize(sum(bytes_on_disk)) AS on_disk,
    max(modification_time)               AS newest_part
FROM system.parts
WHERE active AND database = 'analytics'
GROUP BY table, partition
ORDER BY active_parts DESC
LIMIT 15;
The reading that matters is avg_rows_per_part. Healthy ClickHouse ingestion produces parts of 100 thousand rows and up; an average in the low thousands means the client is batching too small, and the fix belongs on the client or in async_insert, never in raising parts_to_throw_insert.
Path one: ClickHouse ingestion by synchronous batch over the native protocol
The cheapest path per row is a client that accumulates rows in memory and sends blocks of 100 thousand to a few million rows over the native TCP protocol, in Native or RowBinary format. The server does no parsing beyond deserialisation, one part is created per block per partition, and memory on the server is bounded by one block at a time. This is the path for ETL jobs, batch loaders and any producer that can buffer.
# A 40M-row CSV in one process, 1M-row blocks, native protocol
clickhouse-client --host ch-1 --secure --user "${CH_USER}" --password "${CH_PASSWORD}" \
  --max_insert_block_size=1000000 \
  --input_format_parallel_parsing=1 \
  --query="INSERT INTO analytics.events FORMAT CSVWithNames" < events_2026-09-18.csv

# Verify: one part per partition per block, no 'Too many parts' in the log
clickhouse-client --query="
SELECT count() AS parts, sum(rows) AS rows
FROM system.parts
WHERE table = 'events' AND active AND modification_time > now() - INTERVAL 10 MINUTE"
Two settings shape this path. max_insert_block_size is the block size the client-side splitter uses; larger blocks mean fewer parts and more memory per block. max_insert_threads lets an INSERT SELECT write in parallel, at the cost of one part per thread per partition, which is why it should be paired with a sort key that keeps each thread’s rows in few partitions.
Path two: asynchronous inserts for many small producers
When the producers cannot batch, because they are hundreds of application instances each writing a few rows per second, async_insert moves the batching into the server. Rows are accumulated in a per-table buffer and flushed as one block when async_insert_max_data_size or async_insert_busy_timeout_ms is reached. The archive post How to configure asynchronous inserts in ClickHouse covers the settings; the decision that matters is wait_for_async_insert.
-- Profile for application writers: the client waits for the flush, so an ack means durable
CREATE SETTINGS PROFILE app_writer SETTINGS
    async_insert = 1,
    wait_for_async_insert = 1,
    async_insert_max_data_size = 10485760,   -- 10 MiB
    async_insert_busy_timeout_ms = 1000,
    async_insert_use_adaptive_busy_timeout = 1;

-- Observe the buffer
SELECT database, table, format, bytes, rows, first_update
FROM system.asynchronous_inserts;

-- Audit: which async inserts were flushed and how long clients waited
SELECT
    table,
    count()                    AS inserts,
    sum(rows)                  AS rows,
    round(avg(flush_time - event_time), 2) AS avg_wait_s,
    countIf(status != 'Ok')    AS failures
FROM system.asynchronous_insert_log
WHERE event_date = today()
GROUP BY table;
With wait_for_async_insert = 0 the client gets an acknowledgement before the data is written, which is fine for metrics and wrong for anything billable. Since 24.x the adaptive busy timeout tunes the flush interval to the arrival rate, which removes most of the manual tuning this path used to need.
Path three: HTTP inserts and the cost of text formats
The HTTP interface is the default for many client libraries and for anything behind a load balancer, and it is fine when the payload is a large batch in a compact format. It is expensive when the payload is JSONEachRow with a wide schema, because parsing JSON is CPU-bound and the server does it on the insert thread. The archive post Ingesting JSON data in ClickHouse measures the difference between parsing JSON into typed columns and storing it in the JSON type, which is generally available since 25.x and is the right answer for genuinely semi-structured payloads.
# Compressed HTTP insert, 200K rows per request, JSONEachRow
curl -sS "https://ch-lb.internal:8443/?query=INSERT%20INTO%20analytics.events%20FORMAT%20JSONEachRow" \
  -H "X-ClickHouse-User: ${CH_USER}" -H "X-ClickHouse-Key: ${CH_PASSWORD}" \
  -H "Content-Encoding: zstd" \
  --data-binary @events_batch_0001.jsonl.zst
Three rules keep HTTP ClickHouse ingestion cheap: compress the body with zstd or lz4, keep requests above a few megabytes, and set input_format_parallel_parsing = 1 so a large text payload is parsed across threads. A fleet of clients each sending one row per request will hit the part budget before it hits anything else, and belongs on path two.
Path four: streaming from Kafka
The Kafka table engine and the Kafka Connect sink are the streaming paths, and they have their own hub: the ClickHouse Kafka category covers the engine settings, exactly-once through the sink, and CDC with Debezium. From the ingestion-budget point of view, the engine’s kafka_max_block_size and kafka_flush_interval_ms are the batching controls, and the number of consumers multiplied by flushes per second is the part creation rate. The two archive posts Real-time analytics for consumer goods and Real-time payments analytics on ClickHouse show streaming designs that stay inside the budgets at scale.
Path five: bulk ClickHouse ingestion from object storage
For backfills, migrations and daily batch drops, the fastest path is files in Parquet or native format in S3 or GCS, read with the s3() or s3Cluster() table functions. Reads are parallel across files and across nodes with s3Cluster, the format is columnar so only referenced columns are fetched, and the insert side is an INSERT SELECT with full control of block size and threads. The archive post Elasticsearch to ClickHouse for logs and observability uses this path for the historical portion of a migration.
INSERT INTO analytics.events
SELECT
    event_time, tenant_id, event_type, payload
FROM s3Cluster('analytics_cluster',
               'https://s3.eu-west-1.amazonaws.com/acme-landing/events/2026/09/*.parquet',
               '${AWS_ACCESS_KEY_ID}', '${AWS_SECRET_ACCESS_KEY}', 'Parquet')
SETTINGS
    max_insert_threads = 8,
    max_insert_block_size = 1048576,
    input_format_parquet_max_block_size = 65536,
    s3_max_connections = 64;
The trap on this ClickHouse ingestion path is partition spread. A month of files inserted with eight threads into a table partitioned by day produces eight parts per day per thread’s share, which is fine; the same insert into a table partitioned by hour produces thousands of parts, and the load stalls on merges. Order the source by the partition key, or load a partition at a time, when the target partitioning is fine-grained.
Path six: materialized-view fan-out as an ingestion multiplier
Every materialized view on a table turns one ClickHouse ingestion event into several. A raw table with four rollup views produces five parts per insert block, five sets of merges, and five times the memory during the insert if parallel_view_processing is on. The ClickHouse materialized view hub covers the design; the budget rule is that views multiply every number on this page and must be counted when sizing.
Choosing the ClickHouse ingestion path
The choice usually makes itself once the producer’s batching ability and the durability requirement are known. Producers that can buffer take path one; fleets that cannot take path two; anything already in Kafka takes path four; anything already in files takes path five; and path three is what remains when a load balancer or a language client leaves HTTP as the only option. What should never happen is two paths writing the same table with different batching, because the small-batch path sets the part budget for both.
| Path | Best for | Part cost | Durability on ack | Watch |
|---|---|---|---|---|
| 1. Native batch | ETL, loaders, anything that buffers | Lowest | Written to disk | Block size vs memory |
| 2. Async insert | Many small application writers | Low, server-batched | With wait_for_async_insert = 1 | Flush interval, buffer size |
| 3. HTTP | Load-balanced clients, language SDKs | Depends on client batching | Written to disk | Payload size, compression, JSON parse CPU |
| 4. Kafka | Event streams, CDC | Consumers × flushes | At-least-once; exactly-once via sink | Consumer lag, group names |
| 5. Object storage | Backfills, migrations, daily drops | Threads × partitions | Written to disk | Partition spread, S3 request count |
| 6. View fan-out | Rollups from any of the above | Multiplies the source path | Same as source | Insert memory, view chain length |
Sizing ClickHouse ingestion against the three budgets
The worksheet below is what we fill in at the start of an engagement. The figures are illustrative, chosen to show the arithmetic, and the real numbers come from system.part_log, system.query_log and a fio baseline on the target nodes.
| Budget | How it is measured | Illustrative limit per node | What consumes it | Lever |
|---|---|---|---|---|
| Parts created per second | NewPart events per minute in system.part_log | About 1 per table per second on NVMe; less on network volumes | Inserts × partitions touched × views | Batch size, async_insert, partition granularity |
| Memory per in-flight block | memory_usage on inserts in system.query_log | Sum of concurrent blocks below 30 percent of RAM | Block rows × row width × views in parallel | max_insert_block_size, max_insert_threads, view parallelism |
| Merge bandwidth | Bytes merged per hour in system.part_log, %util in iostat | Merges below 40 percent of device write bandwidth | Write amplification: each byte inserted is rewritten several times | Larger initial parts, ZSTD on cold data, fewer mutations |
Write amplification is the number most teams have never measured. A row inserted into a part of 10 thousand rows will be rewritten roughly ten times before it lands in a final part of several hundred million; the same row in an initial part of one million rows is rewritten three or four times. That difference is the merge bandwidth budget, and it is decided entirely by batch size at insert time.
-- Write amplification over the last day: bytes merged vs bytes inserted
SELECT
    table,
    formatReadableSize(sumIf(bytes_uncompressed, event_type = 'NewPart'))    AS inserted,
    formatReadableSize(sumIf(bytes_uncompressed, event_type = 'MergeParts')) AS merged,
    round(sumIf(bytes_uncompressed, event_type = 'MergeParts')
        / sumIf(bytes_uncompressed, event_type = 'NewPart'), 1)             AS amplification
FROM system.part_log
WHERE event_date = today()
GROUP BY table
ORDER BY amplification DESC;
Settings that govern ClickHouse ingestion, with the unit and the reload rule
All of the following are query-level or profile-level settings and take effect for new sessions without a restart; the server-level ones are named. max_insert_block_size, rows, default 1,048,449: the client-side block size. min_insert_block_size_rows and min_insert_block_size_bytes: the server squashes smaller incoming blocks up to these before forming a part. max_insert_threads, count: parallelism for INSERT SELECT. async_insert, wait_for_async_insert, async_insert_max_data_size in bytes and async_insert_busy_timeout_ms in milliseconds: path two.
input_format_parallel_parsing: text formats parsed across threads. parts_to_delay_insert and parts_to_throw_insert, per table in MergeTree settings: the back-pressure thresholds, defaults 1,000 and 3,000 since 23.x; raising them hides the problem rather than fixing it.
SELECT name, value, changed, description
FROM system.settings
WHERE name IN ('max_insert_block_size', 'min_insert_block_size_rows', 'min_insert_block_size_bytes',
               'max_insert_threads', 'async_insert', 'wait_for_async_insert',
               'async_insert_max_data_size', 'async_insert_busy_timeout_ms',
               'input_format_parallel_parsing', 'insert_quorum', 'insert_deduplicate');

SELECT name, value
FROM system.merge_tree_settings
WHERE name IN ('parts_to_delay_insert', 'parts_to_throw_insert',
               'max_parts_in_total', 'inactive_parts_to_throw_insert');
ClickHouse ingestion deduplication and idempotent retries
A producer that retries a failed insert will insert the same block twice unless something stops it. On ReplicatedMergeTree, insert_deduplicate = 1 keeps a hash of recent blocks in Keeper and drops an exact repeat, which makes retries of identical batches safe; the window is replicated_deduplication_window blocks. On non-replicated tables the same is available through non_replicated_deduplication_window since 22.x. For deduplication by business key rather than by block, the destination is a ReplacingMergeTree and the query side finishes the job, as described in the high-volume data ingestion post.
-- Make a batch retry idempotent with an explicit token (since 22.x)
INSERT INTO analytics.events
SETTINGS insert_deduplication_token = 'events-2026-09-18-batch-0417'
FORMAT Native;
Failure modes on the ClickHouse ingestion path
Too many parts: the part budget is exhausted. Stop, measure avg_rows_per_part, and fix the batching; do not raise the threshold. Memory limit exceeded on an insert: the block is too large for the profile, or views are running in parallel; lower max_insert_block_size or the view parallelism. Timeout exceeded while receiving data: a slow client on the HTTP path holding a server thread; set receive_timeout and compress the body.
Inserts slow while queries are fast: merges are saturating the device; check system.merges and the ClickHouse performance IO hub. The archive’s ClickHouse performance pitfalls and ClickHouse data ingestion optimization both walk through cases.
Version notes
async_insert is stable since 21.11 and the adaptive busy timeout arrived in 24.x. The JSON column type became production-ready in 25.x, replacing the earlier experimental Object('json'). insert_deduplication_token is 22.x and later. Lightweight updates, which change how mutation-heavy ingestion is designed, are 25.x. Confirm the server version before applying any of these; the reference is the ClickHouse documentation on insert strategy.
Reading the archive
Start with ClickHouse high-volume data ingestion for the end-to-end picture, then the async-insert and JSON posts for the two decisions that come up on every project, and Vector data ingestion to ClickHouse if the payload is embeddings. The 26.8 LTS performance settings post lists the current defaults.
One habit pays for itself on every pipeline: record avg_rows_per_part and the write-amplification ratio per table once a week. Both drift silently when a producer team changes a batch size or adds a materialized view, and a month of history is what turns a vague “inserts feel slower” into a dated change to chase.
ChistaDATA’s ClickHouse consulting practice sizes ingestion pipelines against these three budgets with measured numbers from the client’s own workload, and 24×7 ClickHouse support handles the part storms and OOMs that happen when a producer changes its batching without telling anyone. Test every ClickHouse ingestion change on a staging cluster with a replayed feed, and keep a tested restore path for the destination tables before changing partitioning or engines.