ClickHouse horizontal scaling is a sequence of decisions, not a single switch. A cluster grows from one node to replicas, from replicas to shards, and from shards to a tiered, object-storage-backed estate, and each step changes the failure modes, the query routing and the operational work. Adding shards too early costs months of rebalancing; adding them too late costs a cluster that cannot absorb the next quarter’s ingestion.
This page is the capacity-planning playbook behind those decisions: four stages, the measurement that says when to move to the next one, the schema and configuration that each stage needs, and the archive posts that cover the details. It is written for a team that has to sign off on the next twelve months of cluster growth.
The archive under this category covers sharding strategies and troubleshooting, shard rebalancing, read-write splits, the six-node reference setup, capacity planning, compression for scale, ingestion at velocity, and the 26.8 LTS changes to performance and high availability.
The ClickHouse horizontal scaling stages at a glance
Stage 0 is one well-sized node: enough for a surprising share of workloads, because a single ClickHouse server reads several gigabytes per second per core group and compresses event data ten-fold. Stage 1 adds replicas of that node for availability and read capacity, with no change to the data layout. Stage 2 shards the largest tables across replica sets when a single node’s storage, write rate or query CPU is exhausted. Stage 3 separates hot and cold storage and adds parallel replicas, at which point the estate is measured in hundreds of terabytes to petabytes.
The gigabytes to petabytes playbook walks the same sequence with sizing examples; this page adds the trigger metrics and the SQL.
| Stage | Topology | What it scales | Trigger to move on | Cost of moving late |
|---|---|---|---|---|
| 0 | 1 node | nothing yet: vertical headroom | no HA; any single-node limit reached | outage on hardware failure |
| 1 | 1 shard × 2–3 replicas | reads, availability | disk > 70 %, merges lag, insert CPU saturated | write stalls, TOO_MANY_PARTS |
| 2 | N shards × 2–3 replicas | writes, storage, query CPU | hot partition on one shard; storage > 200 TB | rebalancing under load |
| 3 | shards + object storage + parallel replicas | cold retention, large scans | retention cost dominates | local NVMe bought for cold data |
Stage 0: exhaust vertical scaling before ClickHouse horizontal scaling
The cheapest ClickHouse horizontal scaling step is the one not taken. Before adding nodes, confirm that the single node is actually limited by hardware rather than by schema: a sort key that does not match the predicates, partitions that are too fine, String columns that should be LowCardinality, and dashboards scanning raw rows instead of rollups each produce symptoms that look like a capacity problem. The performance hub is the review to run first.
When the node is limited, the limits show as specific numbers: sustained disk utilisation above 70 percent, merge backlog growing across a day, insert threads pinned at 100 percent CPU during peaks, or query p95 that scales linearly with data volume. Any of those justifies Stage 1.
-- is it hardware or schema? three numbers before any node is added
SELECT
    formatReadableSize(sum(bytes_on_disk))                          AS on_disk,
    round(sum(data_uncompressed_bytes) / sum(data_compressed_bytes), 1) AS compression_ratio,
    count()                                                         AS active_parts
FROM system.parts
WHERE active;

SELECT metric, value
FROM system.asynchronous_metrics
WHERE metric IN ('DiskUsed_default', 'DiskTotal_default', 'OSCPUVirtualTimeMicroseconds')
   OR metric LIKE 'MaxPartCountForPartition%';

-- merges that cannot keep up show as a rising active part count over 24 h
SELECT toStartOfHour(event_time) AS h, max(CurrentMetric_PartsActive) AS parts
FROM system.metric_log
WHERE event_time > now() - INTERVAL 1 DAY
GROUP BY h ORDER BY h;
Stage 1: replicas, and the read-write split
A replica set is a group of nodes holding the same data through ReplicatedMergeTree and ClickHouse Keeper. It provides availability, because any replica can serve reads and accept writes, and it multiplies read capacity by the replica count. Writes are not multiplied: every insert is replicated to every node in the set, so the replica set has the write capacity of one node. The high availability and replication post covers the replication protocol and Keeper.
The read-write split routes inserts to one replica (or round-robin) and heavy reads to the others, usually through a load balancer or a per-role Distributed table with load_balancing and prefer_localhost_replica tuned per client. The optimal read-write split configuration post gives the routing table and settings.
-- one shard, three replicas: the Stage 1 table
CREATE TABLE events ON CLUSTER 'ch_prod'
(
    ts         DateTime64(3),
    tenant_id  UInt32,
    event_type LowCardinality(String),
    user_id    UInt64,
    payload    String
)
ENGINE = ReplicatedMergeTree('/clickhouse/tables/{shard}/events', '{replica}')
PARTITION BY toYYYYMM(ts)
ORDER BY (tenant_id, event_type, ts);

-- read routing for a reporting client: prefer the least-loaded replica, never the insert node
SET load_balancing = 'nearest_hostname';       -- or 'random', 'in_order', 'first_or_random'
SET prefer_localhost_replica = 0;
SET max_replica_delay_for_distributed_queries = 30;   -- skip replicas more than 30 s behind
SET fallback_to_stale_replicas_for_distributed_queries = 0;
Stage 2: sharding, the ClickHouse horizontal scaling step that changes everything
Sharding is the ClickHouse horizontal scaling step most teams mean by the phrase: it splits a table’s rows across replica sets so that each shard holds a fraction of the data and a fraction of the writes. Reads fan out through a Distributed table, run on every shard in parallel, and merge on the initiator. Storage and write throughput scale with the shard count; query latency for a well-pruned query stays flat; query latency for a query that touches every shard improves by the shard count minus the merge cost.
The decision that decides whether Stage 2 works is the sharding key. A key that co-locates the rows a query needs (tenant, account, device) lets optimize_skip_unused_shards send the query to one shard; a random key spreads writes perfectly and makes every query a full fan-out. The sharding strategies for high-growth environments post sets out the trade-off, and sharding in ClickHouse, part 1 covers the mechanics.
# remote_servers: 3 shards × 2 replicas (config.d/clusters.yaml; YAML config is supported since 22.x)
remote_servers:
  ch_prod:
    shard:
      - internal_replication: true
        replica:
          - {host: ch-s1-r1, port: 9000}
          - {host: ch-s1-r2, port: 9000}
      - internal_replication: true
        replica:
          - {host: ch-s2-r1, port: 9000}
          - {host: ch-s2-r2, port: 9000}
      - internal_replication: true
        replica:
          - {host: ch-s3-r1, port: 9000}
          - {host: ch-s3-r2, port: 9000}

-- the distributed table, sharded by tenant so tenant-scoped queries hit one shard
CREATE TABLE events_dist ON CLUSTER 'ch_prod' AS events
ENGINE = Distributed('ch_prod', currentDatabase(), 'events', cityHash64(tenant_id));

SET optimize_skip_unused_shards = 1;           -- prune shards from the WHERE clause
SET distributed_product_mode = 'global';       -- IN / JOIN subqueries evaluated once
Choosing the shard key without creating a hot shard
The failure mode of a co-locating key is skew: one tenant that produces 40 percent of all events lands on one shard, and that shard’s disk, merges and CPU run at three times the others. The hot spot detection and remediation post covers the diagnosis; the remedies are a composite key (cityHash64(tenant_id, toYYYYMMDD(ts))) for the largest tenants, a per-tenant override table that maps heavy tenants to an explicit shard, or a weight change in remote_servers so that new writes favour the emptier shards.
Skew is measured before sharding, from the single-node table, because the distribution of rows per key value is already known there.
-- skew check before choosing the shard key: share of rows held by the top keys
SELECT
    tenant_id,
    count()                                       AS rows,
    round(100 * rows / sum(rows) OVER (), 2)      AS pct_of_total
FROM events
WHERE ts > now() - INTERVAL 30 DAY
GROUP BY tenant_id
ORDER BY rows DESC
LIMIT 10;
-- rule of thumb: if the top key exceeds 100 / shard_count percent, it will overfill one shard

-- after sharding: bytes per shard from every node
SELECT hostName() AS host, formatReadableSize(sum(bytes_on_disk)) AS on_disk, sum(rows) AS rows
FROM clusterAllReplicas('ch_prod', system.parts)
WHERE active AND table = 'events'
GROUP BY host ORDER BY host;
Rebalancing: the cost of ClickHouse horizontal scaling done late
Adding a shard to a cluster does not move existing data; new inserts spread across the new shard count and old data stays where it was. Rebalancing is a manual operation, and the shard rebalancing methods post compares the four: partition-level ALTER TABLE … MOVE PARTITION TO SHARD (experimental), a copy through INSERT … SELECT FROM remote() per partition followed by a verified DROP PARTITION, the clickhouse-copier utility (deprecated since 24.x), and a full reload from the upstream source.
The per-partition copy is the method used in production because it is resumable, verifiable and reversible. Each partition is copied, row counts and checksums compared on both sides, and only then dropped from the source, behind an explicit confirmation gate in the runbook.
-- per-partition rebalance: copy, verify, then (gated) drop
INSERT INTO events SELECT *
FROM remote('ch-s1-r1:9000', currentDatabase(), 'events', '${CH_USER}', '${CH_PASSWORD}')
WHERE toYYYYMM(ts) = 202606 AND cityHash64(tenant_id) % 4 = 3;     -- rows that now belong to shard 4

-- verification on both sides before any drop
SELECT count(), sum(cityHash64(user_id, ts)) AS checksum
FROM events WHERE toYYYYMM(ts) = 202606 AND cityHash64(tenant_id) % 4 = 3;

-- CONFIRMATION GATE: counts and checksums equal on source and target, recorded in the change ticket
-- ALTER TABLE events ON CLUSTER 'ch_prod' DELETE WHERE toYYYYMM(ts) = 202606 AND cityHash64(tenant_id) % 4 = 3;
Keeper sizing: the coordination ceiling on ClickHouse horizontal scaling
Every replicated insert, merge and mutation is a Keeper transaction, so a cluster’s write rate is bounded by Keeper’s throughput long before it is bounded by disk. Three Keeper nodes on dedicated hosts (or five for multi-region) with fast local storage for the log handle tens of thousands of transactions per second; the number to watch is system.zookeeper latency and the ZooKeeperTransactions profile event per insert. Small frequent inserts are the usual cause of Keeper saturation, and they are fixed at the ingestion layer, not by adding Keeper nodes.
The six-node cluster setup post gives the full Keeper and macro configuration for a three-shard, two-replica reference cluster.
-- Keeper pressure per insert: transactions and wait time
SELECT
    quantile(0.95)(ProfileEvents['ZooKeeperTransactions'])        AS p95_zk_txn_per_insert,
    quantile(0.95)(ProfileEvents['ZooKeeperWaitMicroseconds'])/1e3 AS p95_zk_wait_ms,
    count()                                                        AS inserts_last_hour
FROM system.query_log
WHERE type = 'QueryFinish' AND query_kind = 'Insert'
  AND event_time > now() - INTERVAL 1 HOUR;

-- replication health across the cluster
SELECT hostName(), table, queue_size, inserts_in_queue, merges_in_queue, absolute_delay
FROM clusterAllReplicas('ch_prod', system.replicas)
WHERE queue_size > 50 OR absolute_delay > 60;
Stage 3: object storage, tiering and parallel replicas
Past a few hundred terabytes, most of the data is cold and the cost of keeping it on local NVMe dominates. Storage policies move parts to an S3-compatible volume after the hot window with a TTL clause, keeping the same table and the same queries; the hot tier holds the last 30 to 90 days on local disk. The storage policies and load balancing post covers the configuration.
Parallel replicas (production-ready since 24.x with enable_parallel_replicas) let a single large query use every replica of a shard rather than one, which turns replica count into scan bandwidth. Together with tiering it is the ClickHouse horizontal scaling shape for a petabyte estate: few shards, several replicas, object storage behind them. The 26.8 LTS performance and HA changes post lists what changed in this area in the latest LTS.
-- tiered storage: hot on NVMe, cold on S3 after 60 days
ALTER TABLE events ON CLUSTER 'ch_prod'
    MODIFY TTL toDateTime(ts) + INTERVAL 60 DAY TO VOLUME 'cold',
               toDateTime(ts) + INTERVAL 25 MONTH DELETE;

-- a large scan across all replicas of each shard
SET enable_parallel_replicas = 1,
    max_parallel_replicas = 3,
    cluster_for_parallel_replicas = 'ch_prod';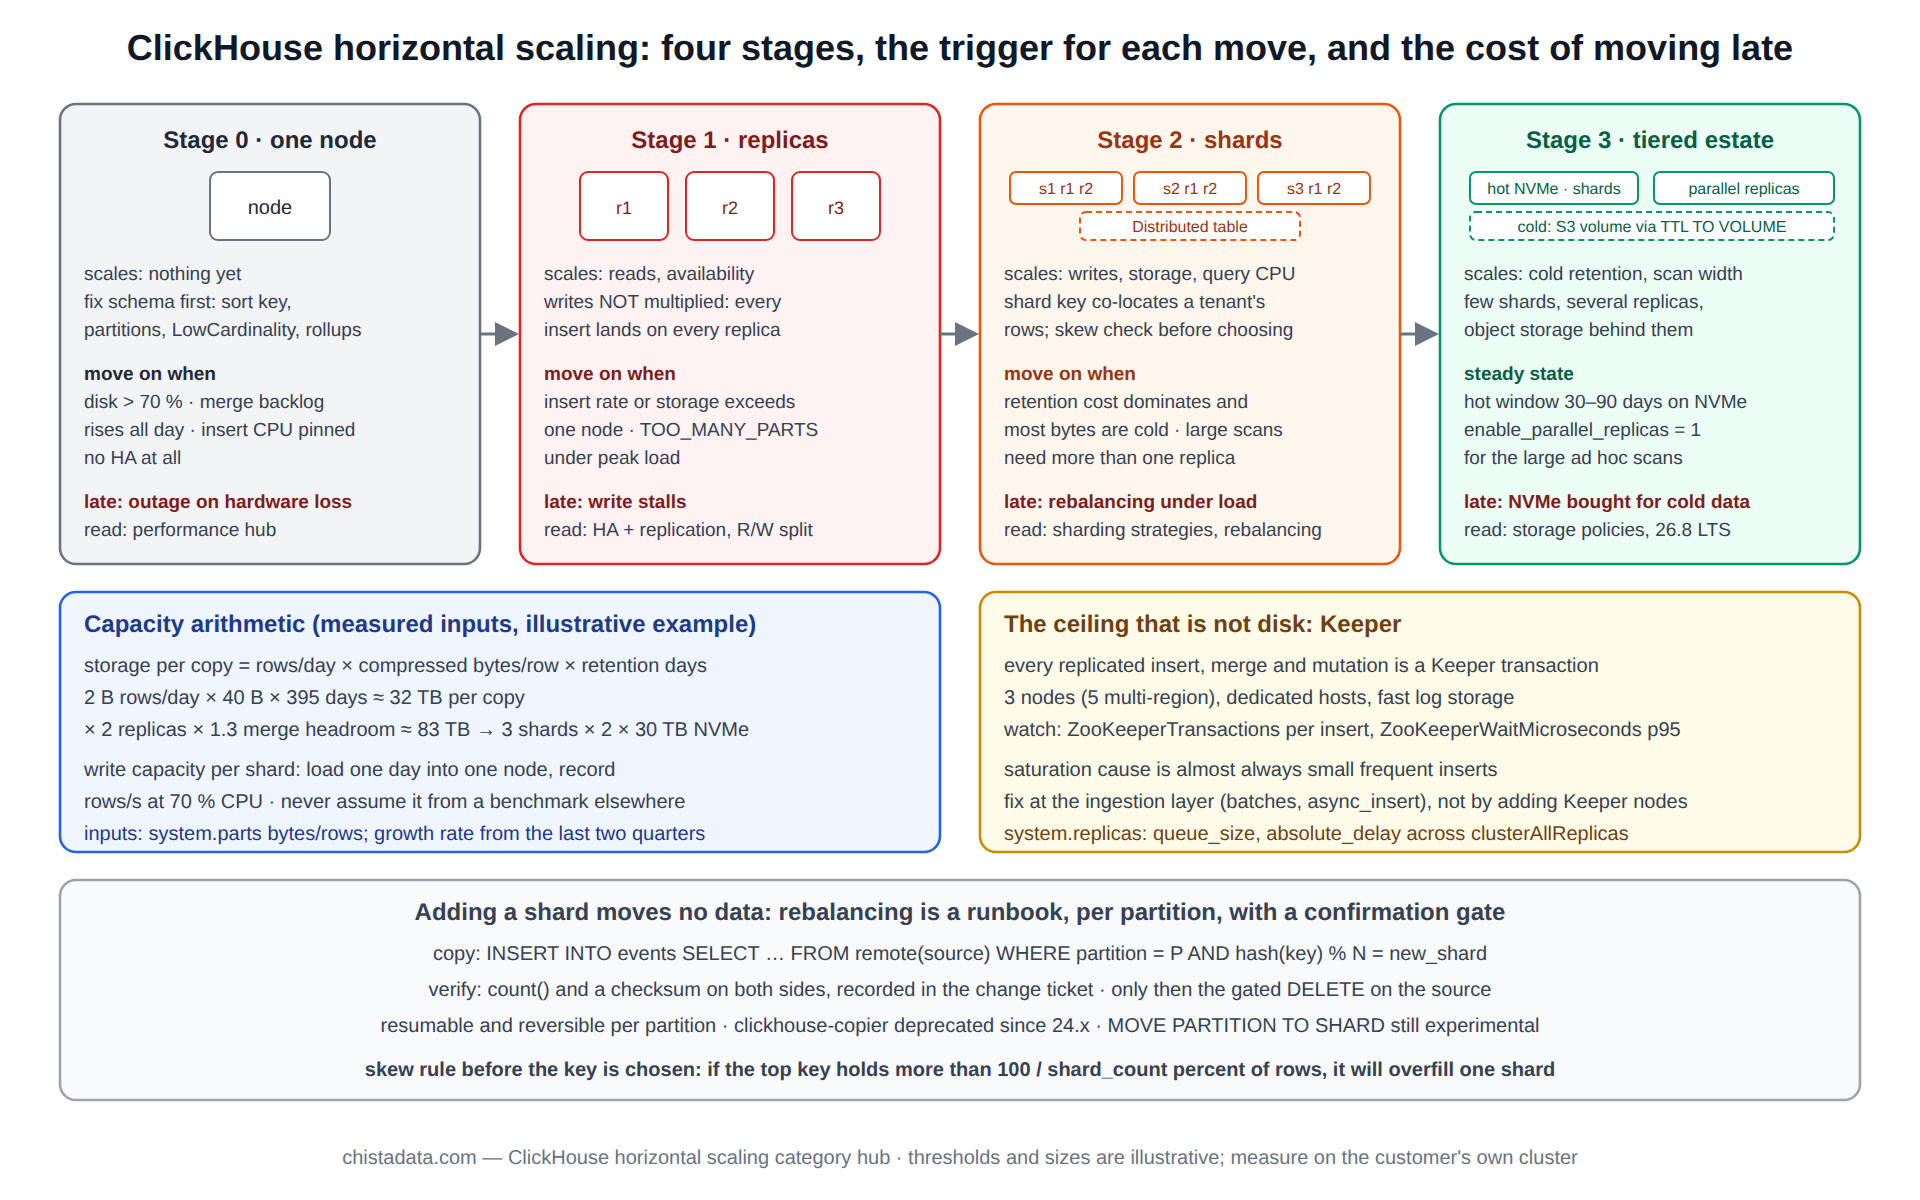
Capacity planning: the arithmetic behind the ClickHouse horizontal scaling plan
The plan is a spreadsheet with five inputs: daily ingested rows, bytes per row after compression, retention in days, peak query concurrency, and the growth rate. Storage per shard is rows per day multiplied by compressed bytes per row multiplied by retention, divided by shard count, with 30 percent headroom for merges and 2× for the replica. Write capacity per shard is measured, not assumed, by loading a day of production data into one node and recording rows per second at 70 percent CPU. The comprehensive guide to horizontal scaling and capacity planning post has the worked model.
Illustrative example for a payments platform: 2 billion rows per day at 40 compressed bytes per row is 80 GB per day, 29 TB per year per copy; with 13 months’ retention, two replicas and 30 percent headroom, three shards of 2 × 30 TB NVMe hold it with room for a year of 40 percent growth. The real-time payments analytics post applies the same arithmetic to a Southeast Asian payments estate.
-- the two measured inputs: compressed bytes per row, and rows per day
SELECT
    table,
    round(sum(data_compressed_bytes) / sum(rows), 1)              AS compressed_bytes_per_row,
    formatReadableQuantity(sumIf(rows, modification_time > now() - INTERVAL 1 DAY)) AS rows_last_day
FROM system.parts
WHERE active AND database = currentDatabase()
GROUP BY table
ORDER BY sum(bytes_on_disk) DESC;
Compression and materialised columns as scaling levers
Before a shard is added for storage, the compression review is run: codec choices per column (Delta and DoubleDelta for timestamps and counters, ZSTD levels for strings, LowCardinality for enumerations) routinely halve on-disk size, which halves the shard count the plan needs. The data compression for performance and scalability post and the compression hub cover the choices and their measurement.
Materialised columns work the other way: they add bytes to save CPU, by precomputing the expressions that every query evaluates. The materialized columns post shows when the trade is worth it, and the high-velocity ingestion post covers the insert-side cost.
Troubleshooting a sharded cluster
The sharding troubleshooting and performance optimisation post is the reference for the failures specific to Stage 2 and beyond: a Distributed table whose async inserts are queued on disk under /var/lib/clickhouse/data/…/events_dist/ because a shard is unreachable, initiator memory blown by a final merge of large GROUP BY states, queries that hit every shard because the predicate is not on the sharding key, and replica delay that turns a read into stale data.
Each has a system table that shows it: system.distribution_queue, system.query_log on the initiator versus initial_query_id on the shards, and system.replicas. The troubleshooting hub routes symptoms to fixes.
-- queued distributed inserts: a shard is behind or unreachable
SELECT database, table, data_files, formatReadableSize(data_compressed_bytes) AS pending, last_exception
FROM system.distribution_queue
WHERE is_blocked OR data_files > 0;

-- initiator vs shard time for one query: where does the fan-out spend it?
SELECT hostName() AS host, is_initial_query, query_duration_ms, formatReadableSize(memory_usage) AS mem, read_rows
FROM clusterAllReplicas('ch_prod', system.query_log)
WHERE initial_query_id = '${QUERY_ID}' AND type = 'QueryFinish'
ORDER BY is_initial_query DESC, host;
Version notes
ClickHouse Keeper has been the recommended coordinator since 22.x. clickhouse-copier was deprecated in 24.x; use the per-partition copy pattern above. Parallel replicas are production-ready from 24.x and further improved in 25.x and 26.x; MOVE PARTITION TO SHARD remains experimental. The Distributed table engine documentation is the source for the settings named on this page; confirm each on the running version before it goes into a change plan.
Reading the archive
Read in stage order; the ClickHouse horizontal scaling posts build on each other. For Stage 1: high availability and replication, and the read-write split guide. For Stage 2: sharding strategies, sharding part 1, the six-node setup, hot spot detection, shard rebalancing methods, and sharding troubleshooting. For Stage 3 and planning: the gigabytes-to-petabytes playbook, capacity planning, compression for scalability, materialised columns, the 26.8 LTS changes, and the payments reference design. The dbt on managed ClickHouse and fast data loops posts cover the transformation layer that grows alongside the cluster.
ChistaDATA runs the capacity review and the shard-key decision as a fixed-scope ClickHouse consulting engagement and operates the resulting clusters under managed services. Every step on this page changes a running cluster’s topology: rehearse it on staging with production-sized data, keep the rollback path written down, and confirm a tested backup before the first shard is added.