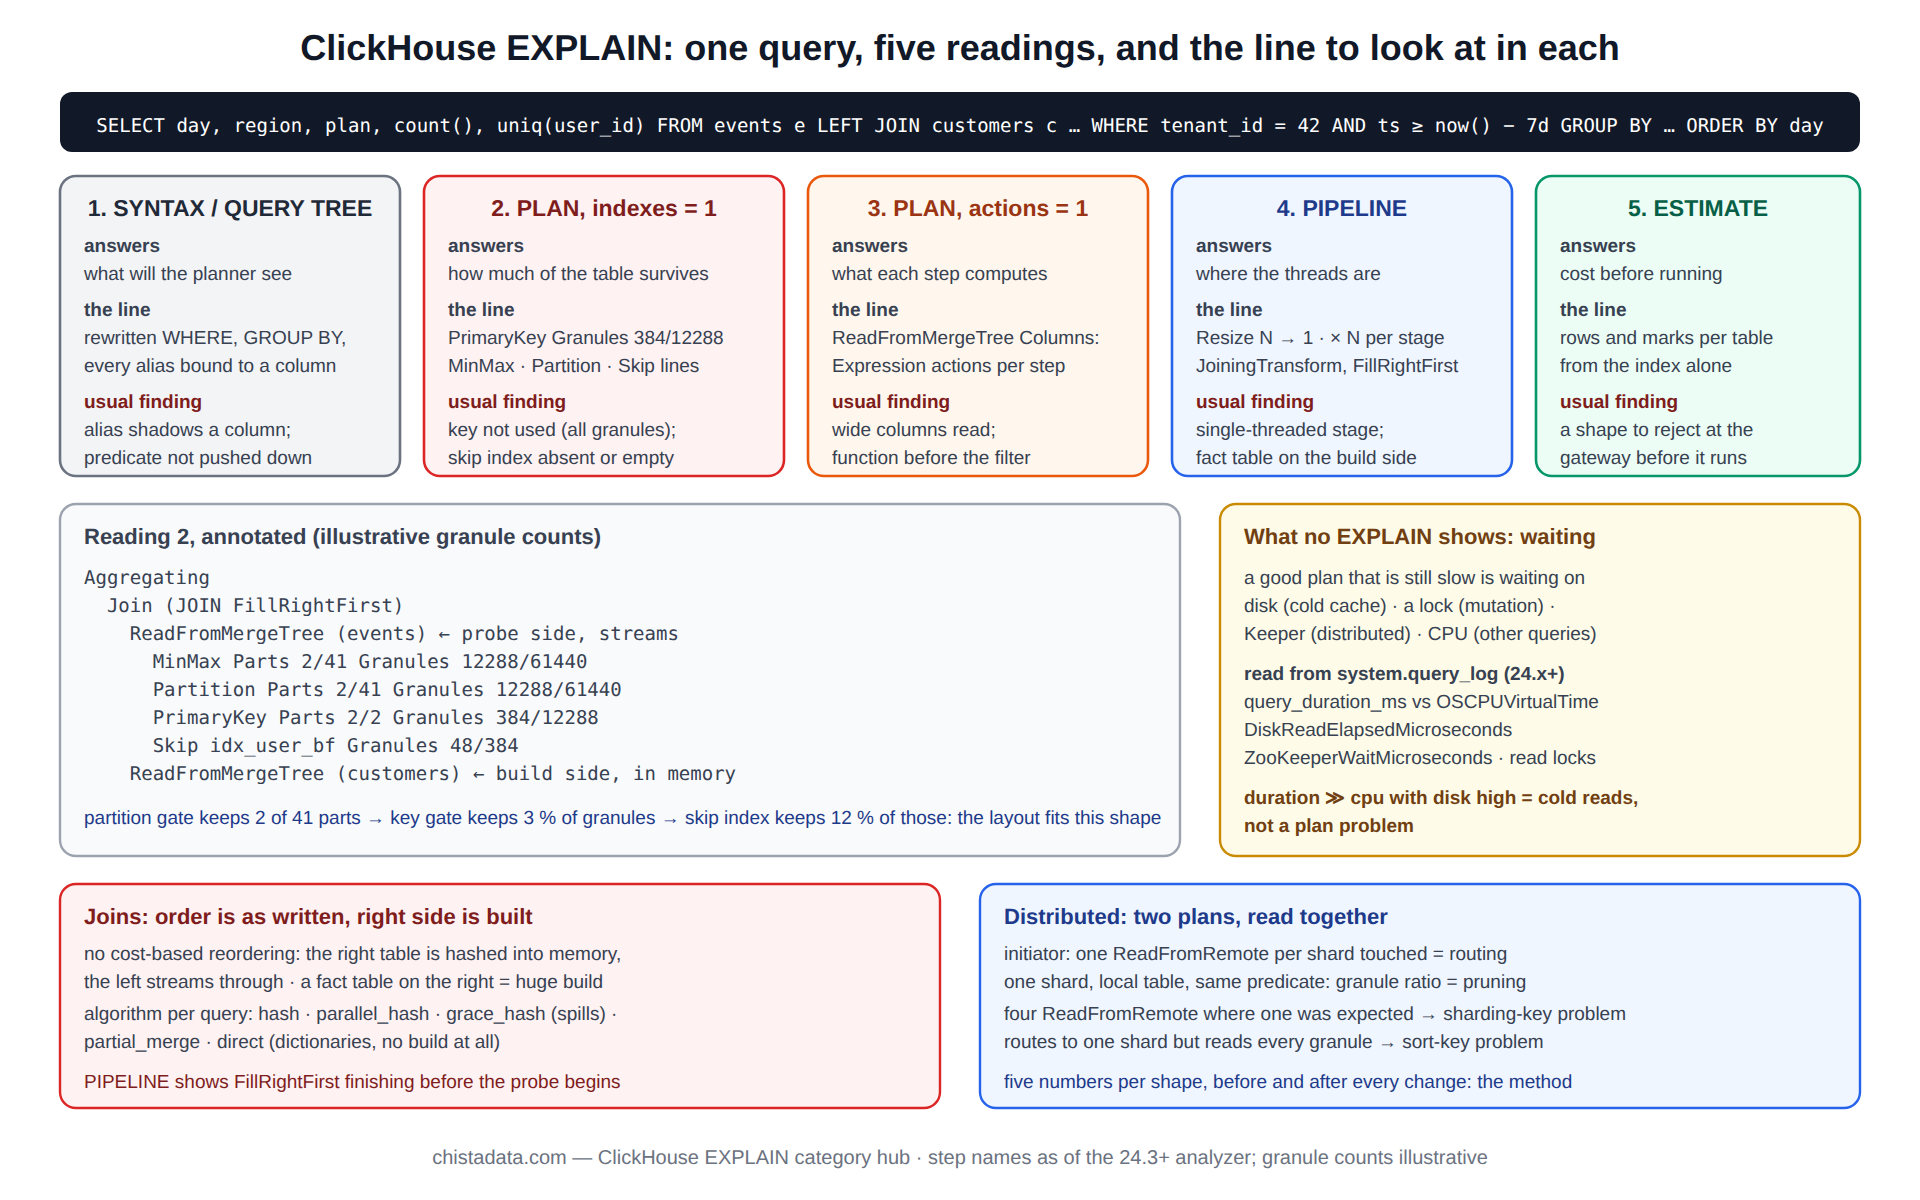
ClickHouse EXPLAIN is five different statements that happen to share a keyword. EXPLAIN AST shows what the parser understood, EXPLAIN SYNTAX what the rewriter turned it into, EXPLAIN PLAN the logical steps and, with indexes = 1, how much of the table survives each pruning gate, EXPLAIN PIPELINE the processors and the thread count at each, and EXPLAIN ESTIMATE the parts and rows the query will touch before it runs. Reading a slow query means reading the right one of the five, and knowing which line in it to look at.
This page takes one query and reads it all five ways, line by line, then covers the two questions that generate most of the tickets: why a join is slow (order and algorithm) and why an index that exists does not appear in the plan. It closes with the runtime counterpart, wait events, which explain the time that the plan cannot. The archive posts under this category cover each form in depth.
The archive holds the comprehensive guide to EXPLAIN, the display-and-analyse plans post, the join-order post, the decoding-execution-plans post, the seven-step EXPLAIN PIPELINE guide, the wait-events post, the LowCardinality guide, the 26.8 performance audit tips, the twenty mistakes post, and the dbt and fast-data-loops posts that apply the plan to transformation jobs.
The query read five ways
The example is deliberately ordinary: a tenant-scoped aggregate over a week with a dictionary lookup and a small join, on a table sorted by (tenant_id, event_type, ts). Every reading below uses it. The comprehensive guide to ClickHouse EXPLAIN post covers the syntax of each form and the settings that modify it.
SELECT
    toStartOfDay(e.ts)                                     AS day,
    dictGet('tenant_dim', 'region', e.tenant_id)           AS region,
    c.plan                                                 AS plan,
    count()                                                AS events,
    uniqCombined64(e.user_id)                              AS users
FROM events AS e
LEFT JOIN customers AS c ON c.customer_id = e.customer_id
WHERE e.tenant_id = 42
  AND e.ts >= now() - INTERVAL 7 DAY
  AND e.event_type IN ('view', 'purchase')
GROUP BY day, region, plan
ORDER BY day;
Reading 1: ClickHouse EXPLAIN AST and SYNTAX, what the engine thinks was asked
The first two ClickHouse EXPLAIN forms answer one question: did the statement mean what was intended after aliases, functions and rewrites were resolved? EXPLAIN SYNTAX is the useful one in practice, because it prints the query after the optimizer’s rewrites: predicates pushed into subqueries, IN lists turned into sets, injective functions dropped from GROUP BY, and the analyzer’s alias resolution. A predicate that appears to filter on ts but has been resolved to an alias of toStartOfDay(ts) shows here, before any plan is built.
EXPLAIN SYNTAX SELECT ... ;   -- the rewritten statement, as the planner will see it
-- look for: WHERE moved to PREWHERE, aliases resolved to columns, IN (...) → IN set, GROUP BY simplified

SET enable_analyzer = 1;      -- default since 24.3; compare with 0 when a plan changed across an upgrade
EXPLAIN QUERY TREE SELECT ... ;   -- the analyzer's resolved tree, with every identifier bound to a column or alias
Reading 2: EXPLAIN PLAN with indexes = 1, the ClickHouse EXPLAIN that matters most
The plan is a tree of steps from the bottom (reading the table) to the top (returning rows), and with indexes = 1 the reading step prints the pruning gates: MinMax and Partition for the partition expression, PrimaryKey for the sort key, and one Skip line per skip index consulted. Each line shows parts and granules before and after.
This is the ClickHouse EXPLAIN reading that answers “why is it slow” in most cases: a query reading 61,440 of 61,440 granules is not using the key, whatever the settings say. The display and analyse execution plans post walks a plan top to bottom; the decoding the query execution plan post covers the step names.
EXPLAIN indexes = 1, actions = 0 SELECT ... ;

-- Expression (Project names)
--   Sorting (Sorting for ORDER BY)
--     Expression (Before ORDER BY)
--       Aggregating
--         Expression (Before GROUP BY)
--           Join (JOIN FillRightFirst)
--             Expression
--               ReadFromMergeTree (default.events)
--               Indexes:
--                 MinMax       Condition: (ts in [1758067200, +Inf))         Parts: 2/41   Granules: 12288/61440
--                 Partition    Condition: (toYYYYMM(ts) in [202609, +Inf))   Parts: 2/41   Granules: 12288/61440
--                 PrimaryKey   Keys: tenant_id, event_type, ts               Parts: 2/2    Granules: 384/12288
--             Expression
--               ReadFromMergeTree (default.customers)
-- reading: the partition gate kept 2 parts, the key gate kept 384 of 12,288 granules (3 %): the layout fits this shape
Reading 3: EXPLAIN PLAN with actions = 1, what each step computes
actions = 1 expands every Expression step into the functions it evaluates and the columns it needs, which is how the columns actually read are found (the ReadFromMergeTree step lists them) and how an expensive function on the hot path is spotted. A JSONExtract or a regex evaluated before the filter rather than after it appears here as an action in the wrong step. The complete guide to LowCardinality post uses this reading to show the difference between a String comparison and a dictionary-index comparison in the actions list.
EXPLAIN actions = 1 SELECT ... ;
-- ReadFromMergeTree ... ReadType: Default, Columns: ts, tenant_id, event_type, user_id, customer_id
-- Expression: dictGet('tenant_dim', 'region', tenant_id) :: 2 -> region
--             toStartOfDay(ts) :: 0 -> day
-- reading: five columns read, not the whole table; dictGet runs after the filter, once per surviving row
Reading 4: ClickHouse EXPLAIN PIPELINE, where the threads are
The ClickHouse EXPLAIN PIPELINE output is the physical execution: processors connected by ports, with the parallelism at each stage printed as × N. It answers the questions the plan cannot: how many threads read the table, where the pipeline narrows to one thread (a resize to × 1 before a sort or a join build is the usual serialisation point), and whether aggregation is two-level. The seven-step guide to EXPLAIN PIPELINE post is the archive’s method for reading it; the graph = 1 form renders it as DOT for large pipelines.
EXPLAIN PIPELINE SELECT ... ;
-- (Expression)
-- ExpressionTransform
--   (Sorting)
--   MergingSortedTransform 8 → 1
--     (Expression)
--     ExpressionTransform × 8
--       (Aggregating)
--       Resize 8 → 8
--         AggregatingTransform × 8
--           (Join)
--           JoiningTransform × 8
--             (ReadFromMergeTree)
--             MergeTreeSelect(pool: ReadPool, algorithm: Thread) × 8 0 → 1
-- reading: 8 threads end to end, one merge at the top; a "Resize 8 → 1" lower down would be the bottleneck

EXPLAIN PIPELINE graph = 1 SELECT ... FORMAT TSV;   -- DOT output for dot -Tsvg
Reading 5: EXPLAIN ESTIMATE, the cost before running
EXPLAIN ESTIMATE returns, per table, the parts, rows and marks the query will read, computed from the index alone without executing anything. It is the ClickHouse EXPLAIN form to put in a CI check or a query gateway: a shape whose estimated rows exceed a threshold is rejected or routed before it costs anything. It also gives the denominator for the “rows read per result row” metric that the query log later confirms.
EXPLAIN ESTIMATE SELECT ... ;
-- ┌─database─┬─table─────┬─parts─┬────rows─┬─marks─┐
-- │ default  │ events    │     2 │ 3145728 │   384 │
-- │ default  │ customers │     1 │   48000 │     6 │
-- └──────────┴───────────┴───────┴─────────┴───────┘
Joins in ClickHouse EXPLAIN: order and algorithm
ClickHouse does not reorder joins by cost the way a row-store optimizer does; the table on the right is built into memory and the left streams through it, in the order written. The plan shows the join as a step with the right side beneath it, and EXPLAIN PIPELINE shows the build side (FillRightFirst) running to completion before the probe begins.
A join whose right side is the fact table shows a huge build and a memory figure to match in the query log. The determining join order from the execution plan post covers reading the order and rewriting it; the algorithm (hash, parallel_hash, grace_hash, partial_merge, direct for dictionaries) is set per query and visible in the pipeline’s transform names.
-- the join as the plan sees it: right side = build side
EXPLAIN SELECT ... FROM events e LEFT JOIN customers c ON ... ;
--   Join (JOIN FillRightFirst)
--     ReadFromMergeTree (default.events)       ← probe (streams)
--     ReadFromMergeTree (default.customers)    ← build (held in memory)

-- algorithm choice, per query
SET join_algorithm = 'parallel_hash';       -- default hash; 'grace_hash' when the build side exceeds memory
-- dictionaries: 'direct' avoids the build entirely
SET join_algorithm = 'direct';
SELECT ... FROM events e JOIN dictionary('tenant_dim') d ON d.tenant_id = e.tenant_id;
Why an index does not appear in the ClickHouse EXPLAIN output
The second most common reading: a skip index exists, and EXPLAIN indexes = 1 shows no Skip line for it, or shows one that dropped nothing. The causes in order of frequency are a predicate shape the index kind cannot serve, a function wrapped around the indexed column, an index not yet materialised for the parts being read, a Bloom filter sized too small and saturated, and a column whose values are uniformly spread so that minmax has nothing to skip. force_data_skipping_indices turns a silent non-use into an error for testing. The index hub covers the five-check sequence in full.
-- the plan says the index was consulted and what it kept
--   Skip
--     Name: idx_user_bf
--     Description: bloom_filter GRANULARITY 4
--     Parts: 2/2
--     Granules: 48/384

-- make non-use an error while testing
SET force_data_skipping_indices = 'idx_user_bf';| Form | Answers | The line to read | Typical finding |
|---|---|---|---|
| EXPLAIN SYNTAX / QUERY TREE | what the planner will see | the rewritten WHERE and GROUP BY | alias shadowing a column; predicate not pushed |
| EXPLAIN indexes = 1 | how much of the table survives | PrimaryKey Granules a/b; Skip lines | key not used; skip index absent |
| EXPLAIN actions = 1 | what each step computes | ReadFromMergeTree Columns; Expression actions | wide columns read; function before filter |
| EXPLAIN PIPELINE | where the threads are | Resize N → 1; JoiningTransform; Aggregating | single-threaded stage; huge build side |
| EXPLAIN ESTIMATE | cost before running | rows and marks per table | a shape that must not reach production |
What ClickHouse EXPLAIN cannot show: wait events
A plan describes work; it does not describe waiting. A query with a good plan that still takes seconds is waiting on something: disk reads on a cold cache, a lock during a mutation, Keeper for a distributed query, or CPU contention from other queries. Since 24.x the query log and system.processes expose wait events and the profile events behind them, so that the time outside the plan can be attributed. The understanding ClickHouse wait events post is the reference; the query profiler hub covers the sampling profiler for the compute side.
-- the time a good plan cannot explain: real vs CPU, and the waits, for one query
SELECT
    query_duration_ms,
    ProfileEvents['OSCPUVirtualTimeMicroseconds'] / 1000       AS cpu_ms,
    ProfileEvents['DiskReadElapsedMicroseconds'] / 1000        AS disk_read_ms,
    ProfileEvents['ZooKeeperWaitMicroseconds'] / 1000          AS keeper_wait_ms,
    ProfileEvents['RWLockAcquiredReadLocks']                   AS read_locks,
    read_rows, formatReadableSize(read_bytes) AS read_bytes
FROM system.query_log
WHERE type = 'QueryFinish' AND query_id = '${QUERY_ID}';
-- reading: duration ≫ cpu_ms with disk_read_ms high = cold reads, not a plan problem
Using ClickHouse EXPLAIN in a performance audit
An audit runs the five readings on the top twenty shapes from the query log, not on queries someone happened to notice, and records four numbers per shape: granule ratio from the key gate, columns read, the narrowest pipeline stage, and estimated rows. The performance audit tips for 26.8 LTS post sets out the method for the current LTS, and the twenty things not to do post is the list of what the readings usually find.
Transformation jobs get the same treatment: the dbt on managed ClickHouse and fast data loops posts show EXPLAIN applied to models that run every few minutes, where a bad plan costs continuously.
-- the shapes worth explaining: run × p95, last 7 days, with the two numbers the plan will confirm
SELECT
    normalized_query_hash                                   AS shape,
    count()                                                 AS runs,
    quantile(0.95)(query_duration_ms)                       AS p95_ms,
    round(avg(read_rows) / greatest(avg(result_rows), 1))   AS rows_read_per_result_row,
    round(avg(length(read_columns)))                        AS cols_read,
    any(substring(query, 1, 120))                           AS sample
FROM system.query_log
WHERE type = 'QueryFinish' AND query_kind = 'Select' AND event_time > now() - INTERVAL 7 DAY
GROUP BY shape
ORDER BY runs * p95_ms DESC
LIMIT 20;
Distributed queries: reading the plan on the initiator and on the shards
On a sharded cluster the initiator’s plan shows a ReadFromRemote step per shard that will be read and a merging step above it, and nothing about what happens on the shards. The shard-side plan is obtained by running ClickHouse EXPLAIN against the local table on one shard with the same predicate, and the two are read together: the initiator’s plan says how many shards were touched (routing), the shard’s plan says how many granules each read (pruning).
A tenant query that shows four ReadFromRemote steps where one was expected has a routing problem, covered on the sharding hub; one that routes correctly but reads every granule on the shard has a key problem, covered above.
-- initiator: routing
EXPLAIN SELECT count() FROM events_dist WHERE tenant_id = 42 AND ts >= today() - 7;
--   ReadFromRemote (Read from remote replica)      ← one per shard touched

-- one shard: pruning, same predicate, local table
EXPLAIN indexes = 1 SELECT count() FROM events WHERE tenant_id = 42 AND ts >= today() - 7;
--   PrimaryKey  Granules: 96/3072

-- and the split of time between them, after the fact
SELECT hostName(), is_initial_query, query_duration_ms, read_rows
FROM clusterAllReplicas('ch_prod', system.query_log)
WHERE initial_query_id = '${QUERY_ID}' AND type = 'QueryFinish';
Each reading produces one number that goes into the review record: shards touched, granule ratio, columns read, narrowest stage width, estimated rows. Five numbers per shape, compared before and after every change, are the whole method.
Version notes
EXPLAIN indexes = 1 is 21.x and later; EXPLAIN ESTIMATE 21.x; EXPLAIN QUERY TREE arrived with the new analyzer, default since 24.3, which also changed several plan shapes, so plans recorded before that boundary are compared with enable_analyzer = 0 before conclusions are drawn. Wait-event columns are 24.x and later. The EXPLAIN statement reference is the source for the forms and settings above; confirm on the running version.
Reading the archive
The archive spans 22.x to 26.8, and the analyzer boundary at 24.3 sits in the middle of it; plans printed in the older posts differ in step names from current output, but the readings are the same.
Start with the comprehensive guide for the forms, then display-and-analyse and decoding-execution-plans for reading a plan, the join-order post for joins, and the seven-step PIPELINE guide for the physical side. Read wait events when a good plan is still slow. The LowCardinality guide shows the readings applied to one type change; the audit tips, twenty mistakes, dbt and fast-data-loops posts show them applied at estate scale.
ChistaDATA runs the five readings on every shape in a ClickHouse consulting performance review and keeps the top shapes under plan watch in 24×7 support, so that a plan regression after an upgrade is caught by the granule ratio before users notice. Every rewrite a plan suggests is tested on staging against a production-sized sample, with parity of results checked before speed.
