A ClickHouse DBA script is a query against a system table, wrapped so that it runs the same way on every node, every morning, and produces output a person can act on. That is the whole discipline: not clever SQL, but the same twelve checks in the same order with a known-good reading for each, so that the first deviation is noticed on the day it appears rather than the week it becomes an incident.
This page is the ClickHouse DBA script library we install on client clusters, with the query, the wrapper, the reading that means healthy, and the cadence for each.
The archive under this category is the largest on the site, over a hundred posts, and most of them are the individual scripts and the reasoning behind them: merge and mutation queries, LowCardinality checks, materialized-view diagnostics, eBPF profiling, RocksDB, Trino connectors and the rest. This page is the index that turns them into a daily routine.
How every ClickHouse DBA script on this page is built
Each script is one clickhouse-client invocation with the query in a heredoc, output in PrettyCompact for humans or TSVWithNames for a pipeline, credentials from the environment, and a non-zero exit when the reading is outside the healthy range. That last part is what makes a script a check rather than a report; the exit code is what cron, systemd timers and the monitoring stack act on. The connection details are the same for all twelve and live in one sourced file.
# /etc/clickhouse-dba/env  (mode 0600, owned by the DBA service account)
export CH_HOST="ch-1.internal"
export CH_PORT="9440"
export CH_USER="${CH_USER}"
export CH_PASSWORD="${CH_PASSWORD}"
export CH_ARGS="--host $CH_HOST --port $CH_PORT --secure --user $CH_USER --password $CH_PASSWORD"

# Every script starts the same way
#!/usr/bin/env bash
set -euo pipefail
source /etc/clickhouse-dba/env
run() { clickhouse-client $CH_ARGS --format "${FORMAT:-PrettyCompact}" --query "$1"; }
Scripts run on one node with clusterAllReplicas() where the check is cluster-wide, and on every node through the timer where the check is node-local, such as disk or memory. The ClickHouse monitoring hub covers the alerting side; these scripts are what an engineer runs by hand when a rule fires, and what the timer runs when nothing has.
ClickHouse DBA script one to four: the morning health pass
1. Replica health. Every replicated table, every replica: read-only flag, delay, queue size, and the last exception. Healthy is zero rows returned. This is the first script because a read-only replica invalidates every other reading on that node.
SELECT
    hostName()                 AS host,
    database, table,
    is_readonly,
    absolute_delay,
    queue_size,
    inserts_in_queue,
    merges_in_queue,
    last_queue_update_exception
FROM clusterAllReplicas('analytics_cluster', system.replicas)
WHERE is_readonly OR absolute_delay > 30 OR queue_size > 100 OR last_queue_update_exception != ''
ORDER BY absolute_delay DESC;
2. Parts per partition. The tables whose active part count per partition is above the alert line, with the average rows per part that tells you whether it is a batching problem. Healthy is nothing above 300.
SELECT
    hostName() AS host, database, table, partition,
    count()                          AS active_parts,
    round(avg(rows))                 AS avg_rows_per_part,
    formatReadableSize(sum(bytes_on_disk)) AS on_disk
FROM clusterAllReplicas('analytics_cluster', system.parts)
WHERE active
GROUP BY host, database, table, partition
HAVING active_parts > 300
ORDER BY active_parts DESC
LIMIT 20;
3. Stuck mutations. Any mutation older than an hour that is not done, with its failure reason. Healthy is zero rows. The archive’s merge and mutation performance post explains why a stuck mutation is worse than a slow one.
SELECT hostName() AS host, database, table, mutation_id, command,
       create_time, parts_to_do, latest_fail_reason
FROM clusterAllReplicas('analytics_cluster', system.mutations)
WHERE NOT is_done AND create_time < now() - INTERVAL 1 HOUR
ORDER BY create_time;
4. Disk and memory headroom. Per node: free disk on each data disk, resident memory against the server ceiling, and the mark cache fill. Healthy is disk above 20 percent free and resident memory under 80 percent of RAM.
SELECT
    hostName() AS host,
    name       AS disk,
    formatReadableSize(free_space)  AS free,
    round(free_space / total_space * 100) AS free_pct
FROM clusterAllReplicas('analytics_cluster', system.disks)
WHERE free_space / total_space < 0.20;

SELECT hostName() AS host, metric, formatReadableSize(value) AS v
FROM clusterAllReplicas('analytics_cluster', system.asynchronous_metrics)
WHERE metric IN ('MemoryResident', 'OSMemoryTotal', 'MarkCacheBytes');
ClickHouse DBA script five to eight: the workload pass
5. Slowest and heaviest queries, last 24 hours. Two lists from system.query_log: the ten longest by duration and the ten largest by memory, with user and a query prefix. This is the script that feeds the weekly query review described in the ClickHouse SQL engineering hub, and the archive’s query performance tuning post is its companion.
SELECT
    user,
    query_duration_ms,
    read_rows,
    formatReadableSize(read_bytes)   AS read,
    formatReadableSize(memory_usage) AS mem,
    substring(normalizeQuery(query), 1, 100) AS q
FROM system.query_log
WHERE type = 'QueryFinish'
  AND event_time >= now() - INTERVAL 24 HOUR
  AND query_kind = 'Select'
ORDER BY query_duration_ms DESC
LIMIT 10;
6. Error summary. Exceptions by code over the last 24 hours, with one sample and the user. Healthy is a short, familiar list; a new code is the finding. Since 24.x system.error_log gives the same view as a time series.
SELECT
    exception_code,
    count()                          AS n,
    uniq(user)                       AS users,
    any(substring(exception, 1, 100)) AS sample
FROM system.query_log
WHERE event_time >= now() - INTERVAL 24 HOUR
  AND type IN ('ExceptionBeforeStart', 'ExceptionWhileProcessing')
GROUP BY exception_code
ORDER BY n DESC;
7. Merge activity and write amplification. Bytes inserted versus bytes merged per table for the day, which is the number that tells you whether a producer changed its batching. Healthy is an amplification ratio that matches last week’s.
SELECT
    table,
    formatReadableSize(sumIf(bytes_uncompressed, event_type = 'NewPart'))    AS inserted,
    formatReadableSize(sumIf(bytes_uncompressed, event_type = 'MergeParts')) AS merged,
    round(sumIf(bytes_uncompressed, event_type = 'MergeParts')
        / greatest(sumIf(bytes_uncompressed, event_type = 'NewPart'), 1), 1) AS amplification,
    countIf(event_type = 'NewPart')                                          AS parts_created
FROM system.part_log
WHERE event_date = today()
GROUP BY table
ORDER BY amplification DESC
LIMIT 20;
8. Insert profile. Inserts per table in the last hour, rows per insert, and the share arriving through async inserts. This is the early warning for the part storm that script two catches later, and it maps directly to the budgets in the ClickHouse ingestion hub.
SELECT
    tables[1]                        AS table,
    count()                          AS inserts_1h,
    round(avg(written_rows))         AS avg_rows,
    countIf(query LIKE '%async_insert%' OR Settings['async_insert'] = '1') AS async_inserts
FROM system.query_log
WHERE type = 'QueryFinish' AND query_kind = 'Insert'
  AND event_time >= now() - INTERVAL 1 HOUR
GROUP BY table
HAVING avg_rows  600
ORDER BY inserts_1h DESC;
ClickHouse DBA script nine to twelve: the weekly pass
9. Schema drift. A hash of every table’s CREATE statement compared with last week’s, so that an ALTER nobody announced is found before it breaks a view. Store the output; the diff is the report.
SELECT
    database, name,
    cityHash64(create_table_query) AS ddl_hash,
    engine,
    formatReadableSize(total_bytes) AS size
FROM system.tables
WHERE database NOT IN ('system', 'INFORMATION_SCHEMA', 'information_schema')
ORDER BY database, name
FORMAT TSVWithNames;
FORMAT=TSVWithNames run "$SCHEMA_QUERY" > /var/lib/clickhouse-dba/schema-$(date +%F).tsv
diff <(cut -f1-3 /var/lib/clickhouse-dba/schema-$(date -d '7 days ago' +%F).tsv) \
     <(cut -f1-3 /var/lib/clickhouse-dba/schema-$(date +%F).tsv) || echo "schema drift detected"
10. Backup status. The last successful backup per table from system.backups or system.backup_log, and the age of the newest one. Healthy is every production table backed up inside its RPO. The archive’s backup tools and restore post covers the tooling this script reads.
SELECT
    name,
    status,
    start_time,
    end_time,
    formatReadableSize(total_size) AS size,
    error
FROM system.backup_log
WHERE event_date >= today() - 7
ORDER BY start_time DESC
LIMIT 20;
11. Users, roles and grants. Every user with anything beyond SELECT and INSERT, every user with access_management, and every user that has not logged in for thirty days. The ClickHouse security hub explains why this is weekly and not quarterly.
SELECT user_name, role_name, access_type, database, table
FROM system.grants
WHERE access_type NOT IN ('SELECT', 'INSERT', 'SHOW')
ORDER BY user_name;

SELECT user, max(event_time) AS last_login
FROM system.session_log
WHERE type = 'LoginSuccess'
GROUP BY user
HAVING last_login < now() - INTERVAL 30 DAY;
12. Capacity trend. Bytes on disk per table this week versus four weeks ago, with the weekly growth rate and the weeks until the disk is full at that rate. This is the script that turns the disk check in script four into a purchase order with a date on it.
SELECT
    table,
    formatReadableSize(sum(bytes_on_disk))                   AS now,
    formatReadableSize(sumIf(bytes_on_disk, modification_time < now() - INTERVAL 28 DAY)) AS four_weeks_ago,
    round((sum(bytes_on_disk) - sumIf(bytes_on_disk, modification_time < now() - INTERVAL 28 DAY))
          / 4 / 1e9, 1)                                       AS gb_per_week
FROM system.parts
WHERE active AND database = 'analytics'
GROUP BY table
ORDER BY gb_per_week DESC
LIMIT 15;
Output that a person can act on
The format decision matters more than it looks. PrettyCompact is for a human reading a terminal at 06:30; TSVWithNames is for anything that parses the output, and the two must never be mixed in one script, because a downstream parser that receives box-drawing characters fails silently. The morning pass prints a one-line verdict per script before any detail, so that the first four lines of the output answer the question “is anything wrong” and the rest is only read if one of them says yes.
# Verdict line convention used by every script
n=$(FORMAT=TSV run "$QUERY" | wc -l)
if [ "$n" -eq 0 ]; then
  echo "OK   replica-health: no replica read-only, lagging or errored"
else
  echo "FAIL replica-health: $n replica(s) need attention"
  FORMAT=PrettyCompact run "$QUERY"
  exit 1
fi
Timing matters too. The morning pass runs after the nightly merges and TTL moves have finished and before the first analysts arrive, which on most clusters is a window between 05:00 and 07:00 local. The hourly scripts run at a fixed minute past the hour so that their own query_log entries are easy to exclude from script five. And every script logs its own runtime; a check that took two seconds last month and forty today is itself a finding, usually about system.parts growing past the point where an unfiltered scan of it is cheap.
Running the ClickHouse DBA script library across many clusters
A team operating a dozen clusters runs the same twelve scripts against each from one bastion, with the environment file selecting the target and the output landing in a directory per cluster per day. The weekly review is then a diff across days for each cluster and a comparison across clusters for the same day, which is how a configuration that drifted on one cluster is spotted against its siblings.
The scripts do not change per cluster; only the environment file and the healthy thresholds, which live in a small YAML beside it, do. That separation is what lets the library be versioned once and deployed everywhere.
Wiring the ClickHouse DBA script library into systemd
Each script gets a unit and a timer, the timer sets the cadence, and the unit’s exit code drives the alert. A failed unit is visible in systemctl --failed and can be shipped to the alerting stack by a journal watcher; there is no need for a scheduler beyond what the OS already provides.
# /etc/systemd/system/ch-dba-morning.service
[Unit]
Description=ClickHouse DBA morning health pass
[Service]
Type=oneshot
User=chdba
ExecStart=/usr/local/lib/clickhouse-dba/morning.sh

# /etc/systemd/system/ch-dba-morning.timer
[Timer]
OnCalendar=*-*-* 06:30:00
Persistent=true
[Install]
WantedBy=timers.target

# Install and verify
systemctl daemon-reload
systemctl enable --now ch-dba-morning.timer
systemctl list-timers 'ch-dba-*'
# morning.sh: run scripts 1-4, fail the unit if any check is outside range
#!/usr/bin/env bash
set -euo pipefail
source /etc/clickhouse-dba/env
fail=0
for check in replica-health parts-per-partition stuck-mutations headroom; do
  if ! /usr/local/lib/clickhouse-dba/$check.sh; then
    echo "CHECK FAILED: $check"; fail=1
  fi
done
exit $fail
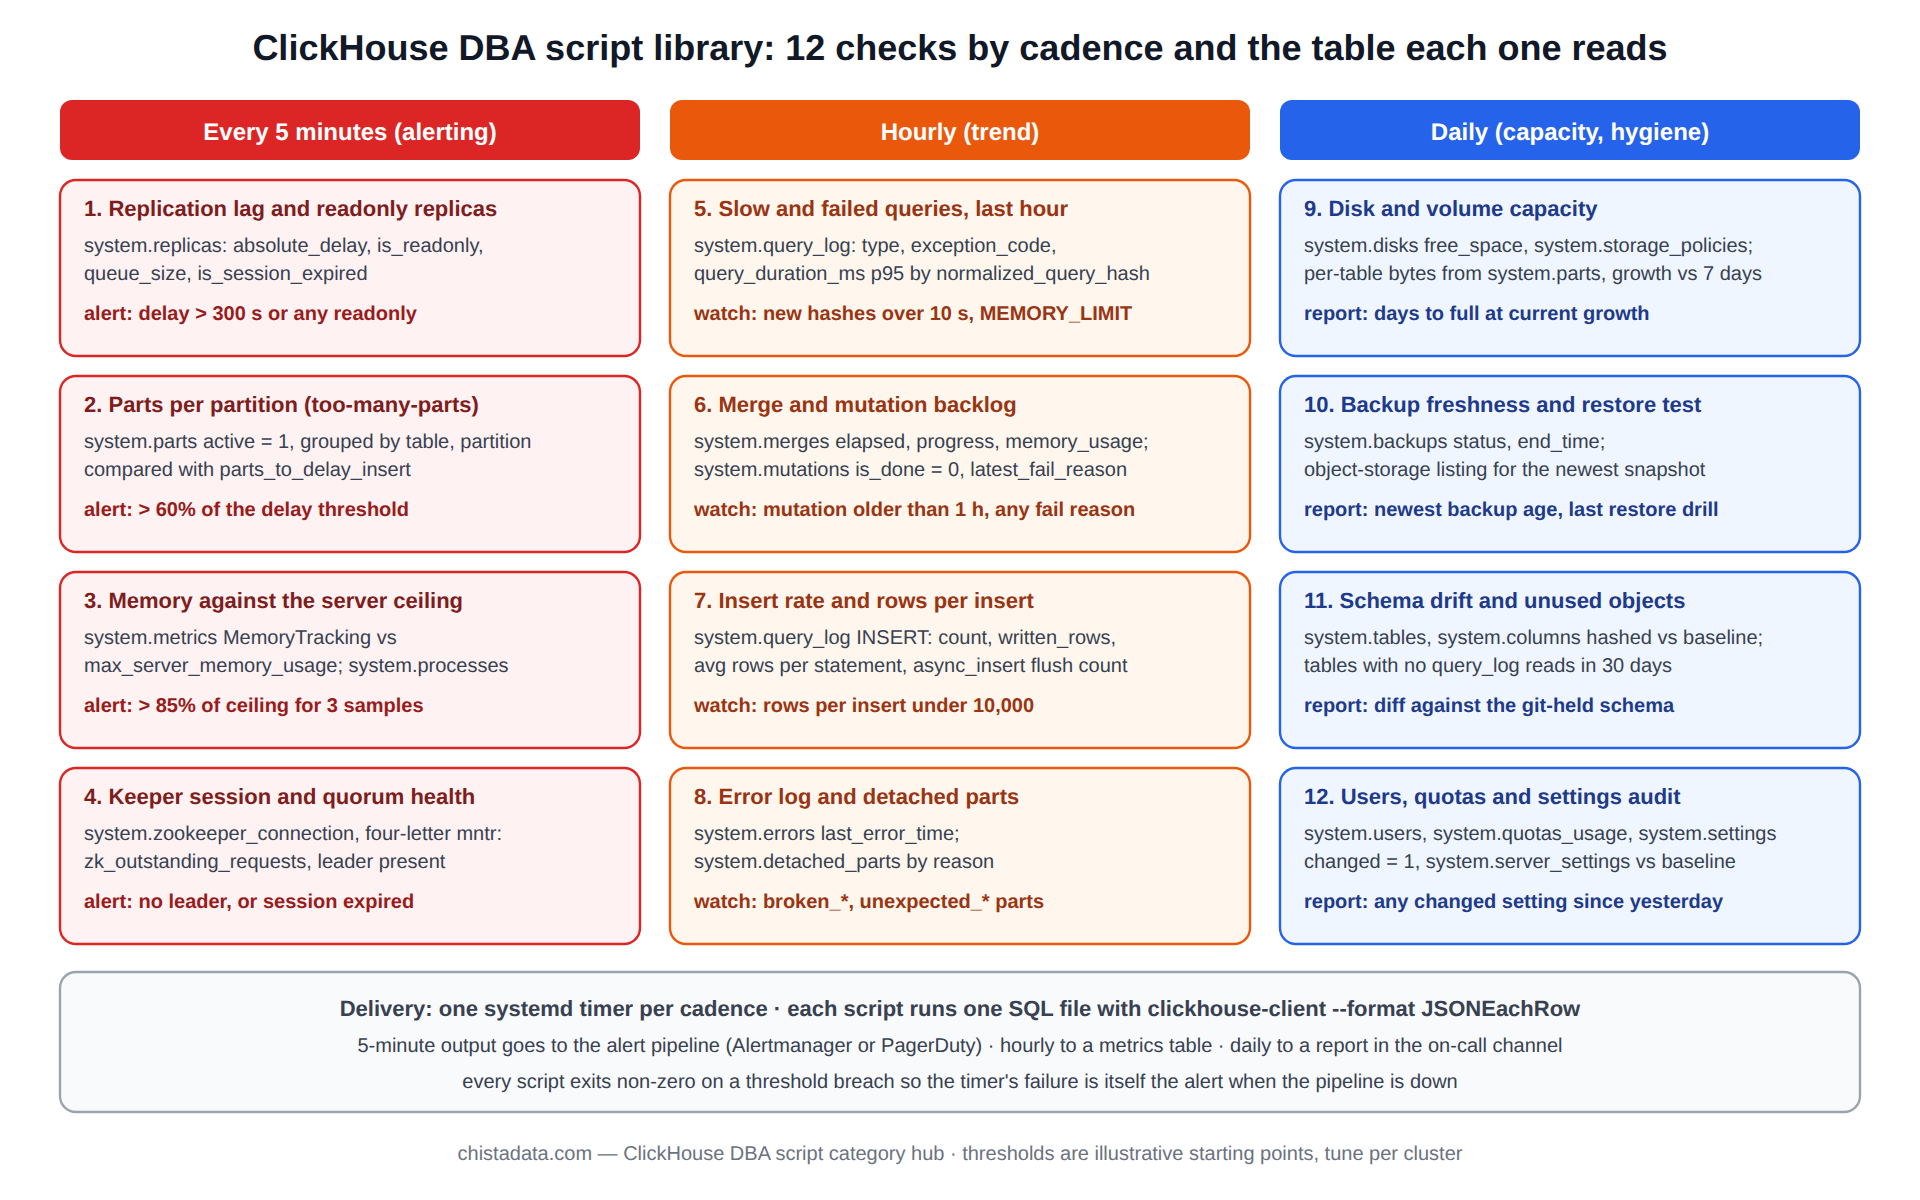
The ClickHouse DBA script library in one table
| # | Script | Cadence | Source | Healthy reading |
|---|---|---|---|---|
| 1 | Replica health | 5 min | system.replicas | Zero rows |
| 2 | Parts per partition | 15 min | system.parts | Nothing above 300 |
| 3 | Stuck mutations | Hourly | system.mutations | Zero rows |
| 4 | Disk and memory headroom | Hourly | system.disks, asynchronous metrics | > 20 % free, < 80 % RAM |
| 5 | Slow and heavy queries | Daily | system.query_log | Same names as last week |
| 6 | Error summary | Daily | query_log, error_log | No new codes |
| 7 | Merge amplification | Daily | system.part_log | Ratio matches baseline |
| 8 | Insert profile | Hourly | system.query_log | No small-batch high-rate writers |
| 9 | Schema drift | Weekly | system.tables | Empty diff |
| 10 | Backup status | Daily | system.backup_log | Every table inside RPO |
| 11 | Users and grants | Weekly | system.grants, session_log | Known list, no dormant users |
| 12 | Capacity trend | Weekly | system.parts | Weeks-to-full above the lead time |
Keeper gets its own script
ClickHouse Keeper sits outside the system tables the twelve scripts read, and a Keeper problem is the one failure that takes every replicated table read-only at once. The thirteenth script in most libraries is a four-letter-word check against each Keeper node: ruok for liveness, mntr for leader status, outstanding requests and znode count, and srvr for the session count. Healthy is exactly one leader, outstanding requests near zero, and a znode count that grows slowly with the number of parts rather than jumping. The script runs from the same timer as the replica-health check, because the two fail together.
for h in keeper-1 keeper-2 keeper-3; do
  printf '%s: ' "$h"; echo ruok | nc -w 2 "$h" 9181; echo
  echo mntr | nc -w 2 "$h" 9181 | grep -E 'zk_server_state|zk_outstanding_requests|zk_znode_count|zk_num_alive_connections'
done
What a ClickHouse DBA script should never do
None of the twelve changes anything. A script that reads a system table and prints is safe to run on every node at any time; a script that runs OPTIMIZE, KILL, DROP PARTITION or an ALTER on a timer is an incident waiting for the night it meets an edge case.
Remedial actions belong in runbooks with a confirmation gate, a verification query before and a validation query after, executed by a person, and the house rule on every engagement is that the timer runs reads only. The one exception we permit is SYSTEM FLUSH LOGS before a log query, which is harmless.
The second rule is credentials. The scripts read ${CH_USER} and ${CH_PASSWORD} from an environment file the service account owns; they are never in the script, never in the unit file, and never in the repository the scripts are versioned in. The DBA user itself holds SELECT on system.* and nothing else, which is also what makes the read-only rule enforceable rather than aspirational.
Extending the library from the archive
The hundred-plus posts under this category are the raw material for scripts thirteen onward. The ones that most often get promoted into a client’s library are the ClickHouse performance toolkit, which bundles the query-side checks; Essential ClickHouse metrics, for the asynchronous-metric readings; Boost materialized view performance, which adds a system.query_views_log check; the LowCardinality query-speed post, which adds a column-type audit; and eBPF performance analysis for ClickHouse for the host-level profile that no system table can give.
Each promoted ClickHouse DBA script follows the same contract as the twelve: reads only, environment credentials, a documented healthy reading, an exit code, and a timer. The reference for the system tables every script reads is the ClickHouse system tables documentation; column names change between releases, so re-run the library on staging after every upgrade before trusting it on production.
Reading the archive
A last note on ownership. The library is only as good as the person who reads its output, and the failure mode we see most is a library that runs perfectly for a year into a mailbox nobody opens. Name an owner per cluster, put the morning verdict lines into the channel the team already reads, and review the healthy thresholds quarterly against the capacity trend from script twelve, because a threshold set at commissioning is wrong within a year of growth.
Start with the performance toolkit and the essential-metrics post, then the merge, mutation and ingestion posts that explain what scripts two, seven and eight are reading. ChistaDATA’s ClickHouse managed services run this library on every cluster under contract, with the output feeding the monthly health report, and ClickHouse consulting installs it on self-operated clusters as a one-week engagement. Test each script on staging before production, keep the healthy readings in version control next to the scripts, and treat any change to the library the way you would treat a schema change.