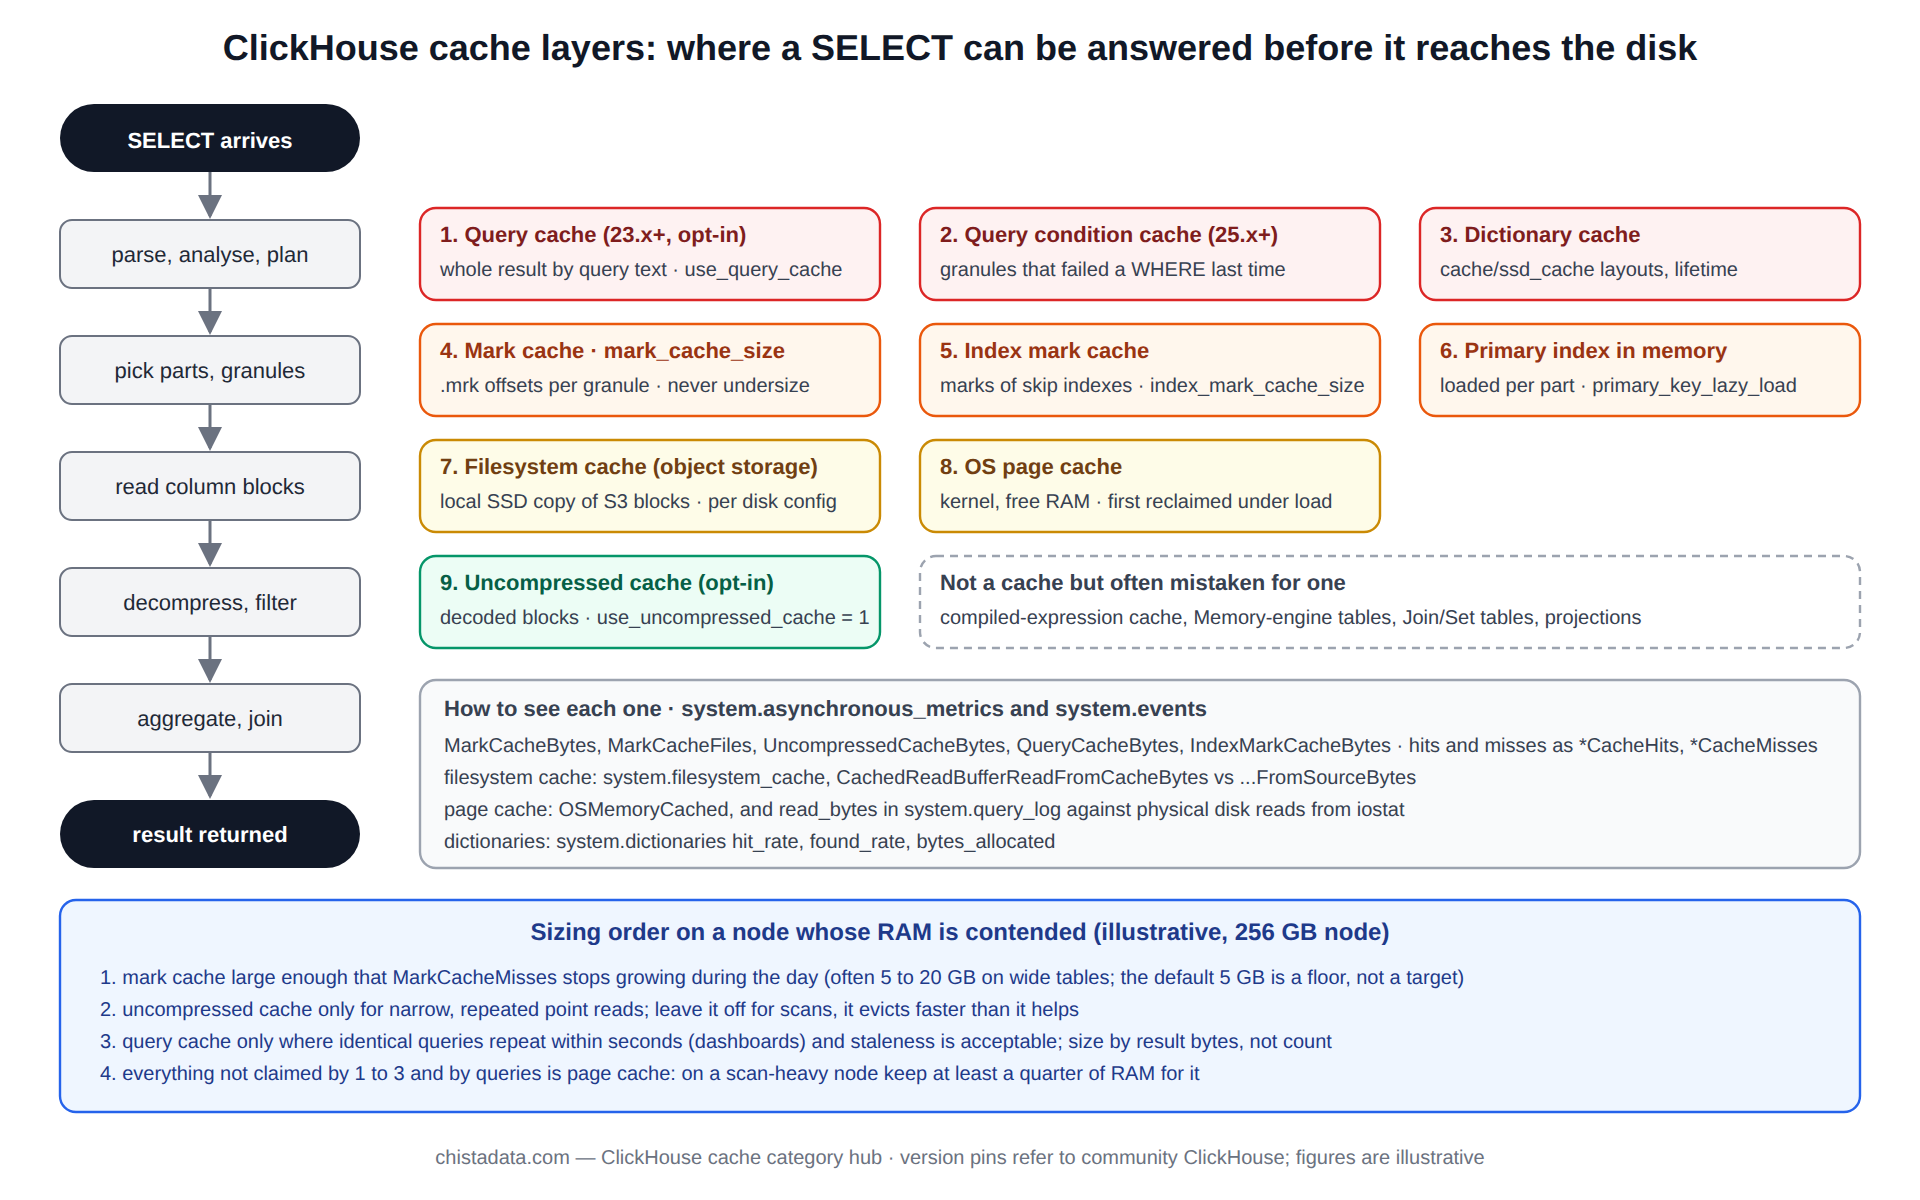
There is no single ClickHouse cache. There are nine, each holding a different kind of object, each with its own size setting, its own hit and miss counters, and its own answer to the question of whether making it bigger would help. Teams that treat them as one thing size the wrong one and then conclude that caching does not help ClickHouse, which is backwards.
On a warm cluster almost every fast query is fast because three or four of these caches did their job. This page goes through the nine, from the one that must never be undersized to the one that is almost never worth enabling, with the setting, the counters, and the sizing rule for each.
The posts in this category cover the individual caches in depth: the multiple data caches, the query cache implementation, external versus internal cache effects, and the library cache for query plans. This page is the map.
Cache one: the mark cache, the ClickHouse cache that must never be undersized
Marks are the index of where each granule begins in each compressed column file. A query that reads a granule needs the mark for every column it touches in every part it touches, and without the mark cache each of those is a small read from disk.
The mark ClickHouse cache holds them in memory, keyed by part and column, and on a table with thousands of parts and dozens of columns the working set is gigabytes. The setting is mark_cache_size, default 5 GiB since 21.x, and the symptom of undersizing is a cluster that looks CPU-bound with MarkCacheMisses climbing in step with queries.
SELECT
    (SELECT value FROM system.events WHERE event = 'MarkCacheHits')   AS hits,
    (SELECT value FROM system.events WHERE event = 'MarkCacheMisses') AS misses,
    round(hits / (hits + misses) * 100, 2)                            AS hit_pct,
    (SELECT formatReadableSize(value) FROM system.asynchronous_metrics WHERE metric = 'MarkCacheBytes') AS resident,
    (SELECT value FROM system.asynchronous_metrics WHERE metric = 'MarkCacheFiles')                     AS files;
The sizing rule is to hold the marks of every part a routine query can touch: total active parts times the columns those queries read times the mark size, which MarkCacheBytes divided by MarkCacheFiles gives per file. A hit rate below 95 percent on a steady workload means the cache is too small, and the fix is the server setting plus a config reload. The ClickHouse memory hub counts this cache in the server ceiling.
Cache two: the uncompressed cache, off by default for a reason
The uncompressed cache holds decompressed column blocks so that a second read of the same block skips decompression. It sounds like it should always help and it almost never does on analytical workloads, because a scan touches each block once and the page cache already holds the compressed form.
It helps for point-read workloads that hit the same few granules repeatedly, which is a key-value pattern ClickHouse is not usually chosen for. The setting is uncompressed_cache_size, enabled per query or profile with use_uncompressed_cache = 1, and the archive post What are the multiple data caches in ClickHouse shows the measurements that led to the default.
Cache three: the query cache, for identical queries repeated within a window
Since 23.x the query cache stores the full result of a SELECT, keyed by the query text and settings, and returns it for an identical query inside query_cache_ttl, default 60 seconds. It is the right ClickHouse cache for dashboards that refresh every few seconds with the same panel queries, and the wrong one for anything with now() in it or with a user-specific filter.
This ClickHouse cache is enabled per query with use_query_cache = 1, bounded server-wide by query_cache.max_size_in_bytes, and since 24.x it can be shared across users with query_cache_share_between_users, which the ClickHouse security hub notes must be off for tables with row policies.
-- Per-profile for the dashboard user
CREATE SETTINGS PROFILE dashboard SETTINGS
    use_query_cache = 1,
    query_cache_ttl = 30,
    query_cache_min_query_runs = 2,
    query_cache_min_query_duration = 500,
    query_cache_nondeterministic_function_handling = 'throw';

-- What is in it, and whether it is being hit
SELECT query, result_size, stale, shared, expires_at FROM system.query_cache ORDER BY expires_at DESC LIMIT 20;
SELECT event, value FROM system.events WHERE event IN ('QueryCacheHits', 'QueryCacheMisses');
The two settings that make it safe are query_cache_min_query_runs, so that one-off queries never enter it, and the nondeterministic-function handling set to throw rather than silently cache a now(). The archive post How the query cache is implemented in ClickHouse covers the key derivation and what invalidates an entry.
Cache four: the index mark ClickHouse cache and the skip-index granules
Skip indexes have their own marks, cached separately in index_mark_cache_size, and their own granule data, which since 23.x has a cache of its own through skipping_index_cache_size on recent releases. A table with several bloom-filter indexes over many parts has an index working set as large as the primary marks, and the same undersizing symptom. The counters are IndexMarkCacheHits and IndexMarkCacheMisses; the sizing rule is the same as cache one, applied to the index columns.
Cache five: the filesystem cache, the ClickHouse cache that decides object-storage performance
On S3 or GCS-backed disks, every uncached read is a network request with tens of milliseconds of latency and a per-request charge. The filesystem cache stores fetched segments on local NVMe and serves repeats from there; on a tiered cluster it is the single largest determinant of dashboard latency. It is configured per disk in the storage configuration, sized in bytes with max_size, and populated on read by default and on write with cache_on_write_operations. The counters that matter are CachedReadBufferReadFromCacheBytes against CachedReadBufferReadFromSourceBytes, and system.filesystem_cache lists what is resident.
<clickhouse>
  <storage_configuration>
    <disks>
      <s3_cold>
        <type>s3</type>
        <endpoint>https://s3.eu-west-1.amazonaws.com/acme-ch-cold/</endpoint>
        <access_key_id from_env="AWS_ACCESS_KEY_ID"/>
        <secret_access_key from_env="AWS_SECRET_ACCESS_KEY"/>
      </s3_cold>
      <s3_cold_cached>
        <type>cache</type>
        <disk>s3_cold</disk>
        <path>/var/lib/clickhouse/fs_cache/</path>
        <max_size>200Gi</max_size>
        <cache_on_write_operations>1</cache_on_write_operations>
      </s3_cold_cached>
    </disks>
  </storage_configuration>
</clickhouse>
SELECT
    formatReadableSize(sumIf(value, event = 'CachedReadBufferReadFromCacheBytes'))  AS from_cache,
    formatReadableSize(sumIf(value, event = 'CachedReadBufferReadFromSourceBytes')) AS from_s3
FROM system.events
WHERE event IN ('CachedReadBufferReadFromCacheBytes', 'CachedReadBufferReadFromSourceBytes');

SELECT cache_name, formatReadableSize(sum(size)) AS resident, count() AS segments
FROM system.filesystem_cache
GROUP BY cache_name;
Size it to the hot working set on the cold tier, which is usually the last few days of the partitions that have already been moved, and treat a rising from_s3 counter as the same emergency as a saturated NVMe, because on the cloud bill it is worse. The archive post ClickHouse external cache versus internal cache impact measures a tiered cluster with and without it.
Cache six: the dictionary ClickHouse cache and the cache layout
External dictionaries with the cache or complex_key_cache layout hold only the most recently used keys in a fixed number of cells and fetch the rest from the source on demand, which is the right layout for a large dimension that is looked up sparsely and the wrong one for a small dimension that is looked up on every row, where hashed or flat holds everything. The counters are per dictionary in system.dictionaries: hit_rate, found_rate and query_count. A cache-layout dictionary with a hit rate under 90 percent should either grow its cell count or change layout.
SELECT name, type, element_count, round(hit_rate * 100, 1) AS hit_pct,
       round(found_rate * 100, 1) AS found_pct, query_count,
       formatReadableSize(bytes_allocated) AS ram
FROM system.dictionaries
ORDER BY query_count DESC;
Cache seven: the DNS cache and the compiled expression cache
Two small caches that only matter when they misbehave. The DNS cache holds resolved hostnames for replicas, Keeper and remote sources; a replica whose address changed and whose DNS entry is cached is a replica that is unreachable until SYSTEM DROP DNS CACHE or the dns_cache_update_period elapses. The compiled expression cache, compiled_expression_cache_size, holds JIT-compiled expressions when compile_expressions is on; it is a CPU saving on repeated complex expressions and is safe to leave at its default.
Cache eight: the library cache for query plans
ClickHouse does not cache query plans the way row stores do; every query is parsed and planned afresh, which is cheap because the planner is simple. What it does cache is the parsed AST for the query condition cache, since 25.x, which stores the result of a WHERE evaluation per granule so that the next query with the same predicate skips the evaluation.
The archive post Monitoring query plans and the library cache in ClickHouse covers what is and is not cached at the plan level; the practical point is that the cost of a repeated query is in reading, not in planning, which is why caches one and five matter far more than any plan cache would.
Cache nine: the OS page cache, the ClickHouse cache that ClickHouse does not manage
Everything read from local disk passes through the kernel’s page cache, which holds the compressed column files and is sized as whatever RAM the server has not taken. It is the largest cache on a well-sized node and the one that makes a second run of any scan fast. ClickHouse can bypass it with min_bytes_to_use_direct_io for large scans so that a cold-partition read does not evict the hot working set, and reads its effectiveness through OSReadBytes against OSReadChars per query. The ClickHouse performance IO hub makes it the first of its seven checks.
The nine ClickHouse cache layers in one table
| # | Cache | Holds | Size setting | Counters | Rule |
|---|---|---|---|---|---|
| 1 | Mark cache | granule offsets per column per part | mark_cache_size | MarkCacheHits/Misses | Size to all routine parts; hit rate > 95 % |
| 2 | Uncompressed cache | decompressed blocks | uncompressed_cache_size | UncompressedCacheHits/Misses | Off unless point-read workload |
| 3 | Query cache | full results | query_cache.max_size_in_bytes | QueryCacheHits/Misses | Dashboards only; min runs 2; throw on nondeterministic |
| 4 | Index mark cache | skip-index marks and granules | index_mark_cache_size | IndexMarkCacheHits/Misses | Same as mark cache, for index columns |
| 5 | Filesystem cache | object-storage segments on NVMe | per-disk max_size | CachedReadBuffer*Bytes | Hot cold-tier working set; alert on source bytes |
| 6 | Dictionary cache | recent keys of cache-layout dictionaries | size_in_cells | system.dictionaries.hit_rate | Hit rate > 90 % or change layout |
| 7 | DNS, compiled expressions | hostnames, JIT expressions | dns_cache_update_period, compiled_expression_cache_size | — | Defaults; drop DNS cache on address change |
| 8 | Query condition cache | predicate results per granule (25.x) | query_condition_cache_size | QueryConditionCacheHits/Misses | On for repeated selective predicates |
| 9 | OS page cache | compressed files | free RAM | OSReadBytes vs OSReadChars | Leave a quarter of RAM; direct IO for cold scans |
Sizing all nine ClickHouse cache layers together
The caches ClickHouse manages, one through eight, are counted inside the server memory ceiling, and the page cache is what remains outside it.
That makes ClickHouse cache sizing a memory-budget exercise rather than a per-cache one: the mark cache and the filesystem cache are the two that deserve gigabytes, the query cache deserves what the dashboard result set needs and no more, the rest stay at defaults, and the total must leave the page cache enough room to hold the hot compressed working set. On a query-heavy node the split that has held across engagements is roughly a tenth of RAM for the ClickHouse-managed caches and a quarter or more left free for the kernel.
-- All nine at once: what is resident and how each is performing
SELECT metric, formatReadableSize(value) AS size
FROM system.asynchronous_metrics
WHERE metric IN ('MarkCacheBytes', 'UncompressedCacheBytes', 'QueryCacheBytes',
                 'IndexMarkCacheBytes', 'FilesystemCacheBytes', 'CompiledExpressionCacheBytes',
                 'OSMemoryCached', 'OSMemoryFreeWithoutCached');

SELECT event, value FROM system.events
WHERE event LIKE '%CacheHits' OR event LIKE '%CacheMisses'
ORDER BY event;
Reading a ClickHouse cache problem from the symptoms
A cluster that is slow on the first run of every query and fast on the second is a page-cache or filesystem-cache problem: the working set does not fit, or a scan evicted it. A cluster that is slow on every run of a selective query with high MarkCacheMisses is cache one. Dashboards that are fast until the panel count doubles are cache three, either turned off or with a TTL shorter than the refresh interval.
A tiered cluster whose cloud bill rose without a traffic change is cache five, usually because a new dashboard asks for a date range that reaches past the local cache. And a dictGet that is slow only on some keys is cache six, a cache-layout dictionary with too few cells for its key distribution.
Each of those has a one-line confirmation in the counters above, which is why the counters belong on the dashboard even though none of them deserves an alert on its own; the ClickHouse monitoring hub places them beside the rules they explain.
Dropping a ClickHouse cache, and when to
Every managed cache can be cleared with a SYSTEM DROP ... CACHE statement, which is the tool for a benchmark that needs a cold start and almost never the right tool in production, because the cache refills at the cost of the same reads that made it worth having.
The exception is the DNS cache after a topology change, and the query cache after a data correction that must be visible immediately. Dropping the mark cache on a busy node produces a visible latency spike for several minutes; do it on staging to see what a cold cluster feels like, and then size the cache so that production never does.
SYSTEM DROP DNS CACHE;
SYSTEM DROP QUERY CACHE;
-- for benchmarks on staging only:
SYSTEM DROP MARK CACHE;
SYSTEM DROP UNCOMPRESSED CACHE;
SYSTEM DROP FILESYSTEM CACHE;
Warming a ClickHouse cache after a restart
A restart empties caches one through eight and, on a reboot, the page cache too. The first minutes after a restart are the slowest a node will ever be, and the fix is a warm-up script: a handful of the dashboard’s own queries run once against each replica before it is returned to the load balancer. On tiered clusters the same script pre-fetches the hot cold-tier partitions into the filesystem cache. The ClickHouse DBA script hub has the wrapper pattern; the warm-up belongs in the rolling-upgrade runbook, between the health check and the traffic switch.
Version notes
The query cache is 23.x and later, with cross-user sharing in 24.x. The skipping-index granule cache and the query condition cache are 25.x. The filesystem cache has been stable since 22.x and gained cache_on_write_operations in 23.x. Metric names in system.asynchronous_metrics have been stable across 24.x through 26.x; confirm against a single query on the running version before wiring them into a dashboard. The reference is the ClickHouse cache types documentation.
Reading the archive
Start with the multiple-data-caches post for the model, then the query cache post if dashboards are the workload and the external-versus-internal post if object storage is.
Two caches account for most of the tuning wins we record on client clusters, and both are usually at their defaults when we arrive: the mark cache on clusters with many parts, and the filesystem cache on clusters that added an object-storage tier after the node was sized. Everything else on this page is a second-order effect, worth an hour of measurement and rarely worth more.
ChistaDATA’s ClickHouse consulting practice sizes all nine caches as part of every capacity review, and 24×7 ClickHouse support handles the cold-cluster incidents that an undersized mark cache or filesystem cache produces. Change one cache at a time on staging under a replayed workload, watch its hit rate for a day, and only then apply the setting to production with a config reload.