ChistaDATA Fabric is the data-fabric layer ChistaDATA built for organisations running a transactional database next to ClickHouse: a proxy and control plane that sits between applications and their databases, routes transactional writes to the RDBMS and analytical reads to ClickHouse, moves historical data between them, and gives operators one place to observe both.
It was introduced in 2024 and the three posts in this category describe its motivation, its RDBMS-archival design, and the proxy layer it is built on. This page is the reference for what ChistaDATA Fabric does, organised around the six problems in mixed data stacks it was designed to solve, with the operational questions engineers ask before adopting a routing layer.
Why a fabric layer exists: the six problems of a mixed data stack
The introductory post lists the problems that specialised, point-solution data stacks accumulate at scale, and ChistaDATA Fabric maps one capability to each. Runaway OLAP bills come from analytical reads landing on engines priced per query or per warehouse-second. Lack of observability comes from each database shipping its own metrics and nobody owning the joins between them. Fault-prone systems come from applications holding direct connections to every database, so a failover in one becomes a code change in several.
Rate-limited ingestion comes from pushing high-velocity event streams through an RDBMS built for transactions. Bloated, slow RDBMS instances come from years of history the OLTP workload never reads. And rate-limited innovation comes from every migration being a rewrite of the application’s data access layer.
The six capabilities that answer them, in the same order, are OLAP TCO optimisation, a unified control plane for observability, secure and resilient connectivity, high-velocity ingestion, a lean and performant RDBMS through archival, and zero-disruption migration. The sections below take each one as an engineering question rather than a slogan: what the layer actually does, what it measures, and what it asks of the databases behind it.
Capability 1: OLAP cost control through ChistaDATA Fabric read routing
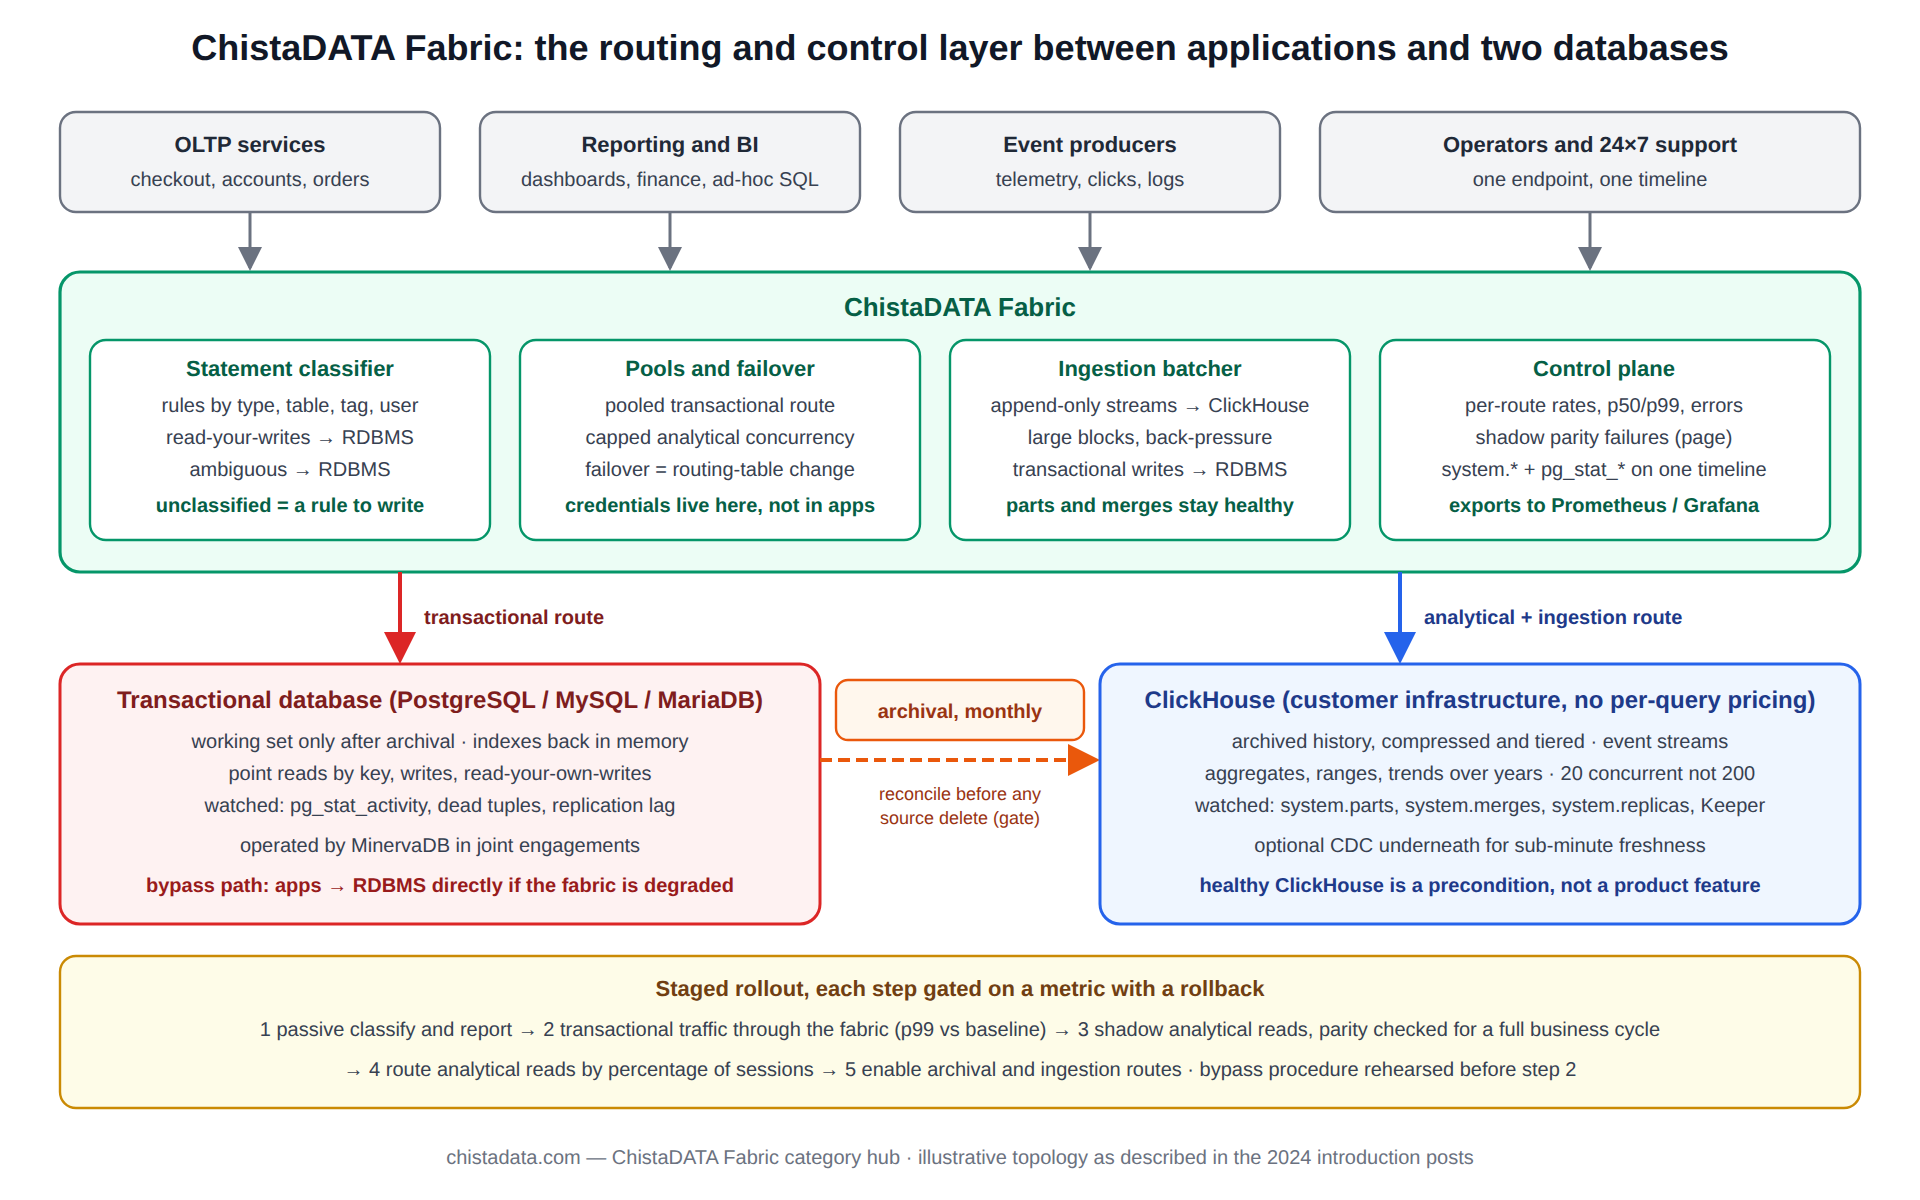
The central mechanism is statement classification at the proxy. A query arriving from an application is inspected and routed: transactional statements and any read that must see its own writes go to the RDBMS, analytical reads (aggregates, wide scans, historical ranges) go to ClickHouse. Because ClickHouse on the customer’s own infrastructure has no per-query pricing, moving the analytical share of reads to it removes that share from any metered OLAP bill and from the RDBMS instance sizing at the same time.
The measurement is straightforward once routing is on: the proxy’s per-route statement counts and latencies, compared with the RDBMS’s pg_stat_statements or performance_schema digests before and after.
Routing is only as good as its classification, so the rules are explicit and reviewable rather than inferred: by statement type, by table, by a comment tag the application adds, or by user. The default is conservative, sending anything ambiguous to the RDBMS, because a read that lands on ClickHouse and needs transactional consistency is a correctness bug, while a read that lands on the RDBMS unnecessarily is only a cost.
Capability 2: one control plane for both databases
The second problem is observability across engines that report differently. ChistaDATA Fabric’s control plane collects from both sides and presents them together: connection counts, statement rates, error rates and latency percentiles per route from the proxy itself; replication lag, part counts, merge backlog and memory from ClickHouse’s system tables; and the RDBMS’s own health counters. The practical value is the join between them, for example seeing that a p99 spike on the analytical route coincides with a merge backlog on ClickHouse rather than with anything on the transactional side.
The control plane is the surface that a 24×7 support team works from, which is why it is designed around the questions on-call engineers ask: which route is slow, which database is behind it, and what changed. It replaces neither the databases’ native monitoring nor the customer’s existing Prometheus or Grafana; it exports to them.
Capability 3: resilience and security at the connection layer
The proxy post in this category makes the general case for a database proxy: load balancing, failover management, connection pooling, a single point for TLS termination and authentication, and a place to enforce query policy. ChistaDATA Fabric applies each of those to the two-database case. Applications hold connections to the fabric, not to the databases, so a ClickHouse replica failover or an RDBMS primary switch changes a routing table rather than application configuration.
Connection pooling on the transactional side plays the role PgBouncer or ProxySQL play in single-database stacks, and on the analytical side it caps concurrency into ClickHouse, which matters because ClickHouse gives every query a large memory budget and is happier with 20 concurrent analytical queries than 200.
Security follows from the same choke point. Credentials for the databases live in the fabric, not in every application; the fabric authenticates applications with their own identities and maps them to database roles. Query-level policy (blocking unbounded scans on the transactional route, enforcing a row limit on ad-hoc analytical users, logging every statement that touches a sensitive table) is enforced once, at the layer every statement passes through.
Capability 4: ChistaDATA Fabric as the ingestion front door to ClickHouse
Event streams that arrive faster than an RDBMS can absorb them are the fourth problem. ChistaDATA Fabric routes high-volume, append-only writes (events, logs, telemetry, click streams) to ClickHouse directly, batching them into the large blocks ClickHouse’s part model rewards, while transactional writes continue to the RDBMS. The application sees one endpoint; the fabric applies the batching and back-pressure that a naive per-row insert into ClickHouse would lack, the same effect the server-side asynchronous inserts setting provides for clients that talk to ClickHouse directly.
The relevant ClickHouse telemetry is the same as for any ingestion pipeline: system.query_log rows per INSERT, active parts per partition in system.parts, and system.merges keeping pace.
Capability 5: a lean RDBMS through archival to ClickHouse
The RDBMS-archival post is the most detailed of the three and describes the design that gives ChistaDATA Fabric its most measurable win. Historical rows that the transactional workload no longer touches are archived, compressed, into ClickHouse; the fabric then splits reads so that analytical queries over that history go to ClickHouse and transactional operations on the working set stay on the RDBMS.
The RDBMS gets smaller, its indexes fit in memory again, vacuum or purge has less to do, and backups shrink, while the history becomes queryable at columnar speed rather than being a tax on every OLTP read.
The archival mechanics (qualification, table design, transfer, reconciliation before any source delete, read routing, and tiered operation) are the six-stage pattern documented on the ClickHouse archival store hub. ChistaDATA Fabric is the read-routing and monitoring layer in that pattern; the reconciliation gate before deleting from the source is a procedure, not a product feature, and it stays in the runbook whether or not a fabric is in front of the databases.
-- the split the fabric enforces, expressed as the two queries it would route
-- transactional route → PostgreSQL: recent order by key, must see own writes
SELECT order_id, status, amount_cents
FROM orders
WHERE order_id = 918273645;

-- analytical route → ClickHouse: three-year revenue trend over archived history
SELECT
    toStartOfMonth(created_at) AS month,
    currency,
    sum(amount_cents) / 100    AS revenue
FROM archive.orders_archive
WHERE created_at >= now() - INTERVAL 3 YEAR
GROUP BY month, currency
ORDER BY month, currency;
Capability 6: ChistaDATA Fabric for migration without an application rewrite
The sixth problem is that changing a database has historically meant changing every application that talks to it. With connections terminating at ChistaDATA Fabric, a migration becomes a routing change that can be staged: shadow a fraction of analytical reads to ClickHouse and compare results, then a percentage of traffic, then all of it, with the RDBMS route still available for rollback at every step.
The same staging applies to moving a reporting workload off a metered cloud warehouse, or to introducing ClickHouse to a stack that has never had an analytical database. Each stage is measured at the proxy (result parity, latency per route, error rate) before the next is enabled.
Deploying ChistaDATA Fabric: the staged rollout used in engagements
A routing layer goes live in front of production databases, so the rollout is staged with a measurement and a rollback at every step. The first stage is passive: the fabric is deployed beside the existing connection path, receives a mirror of the statement stream, and classifies it without routing anything. The output is a report of what share of statements would go to each route and which statements the rules could not classify, and that report is reviewed with the application owners before any traffic moves.
Ambiguous statements are either tagged in the application or added to an explicit rule; nothing is left to inference.
The second stage moves transactional traffic only. Applications connect to the fabric, every statement still lands on the RDBMS, and the gain is pooling and a single failover point. The number watched is the transactional p99 against the baseline from the week before, and the rollback is a connection-string change back to the direct path.
The third stage enables shadowing on the analytical route: classified analytical reads are executed on both databases, the RDBMS result is returned, and the ClickHouse result is compared for parity and timing. Shadowing runs for at least one full business cycle so that month-end and weekly reports are covered.
The fourth stage routes analytical reads to ClickHouse for a percentage of sessions, raised in steps as parity holds, and the fifth enables archival and ingestion routes once the read routing has been stable for a period the customer sets. Each stage has a written entry criterion, the metric that gates it, and the rollback. The whole plan is delivered as a versioned runbook, and the bypass procedure that points applications straight at the RDBMS is rehearsed before stage two, not after an incident.
What ChistaDATA Fabric should report, and where each number comes from
| Signal | Source | Why it matters |
|---|---|---|
| Statements per route, per second | Fabric proxy counters | Confirms the split matches the classification review |
| Latency p50/p99 per route | Fabric histograms | The number every stage is gated on |
| Unclassified statements | Fabric rule engine | Each one is a rule to write or a tag to add |
| Shadow parity failures | Fabric comparison log | A result mismatch is a routing bug or a stale archive |
| Pool saturation per database | Fabric pool metrics | Queueing before either database sees load |
| ClickHouse parts, merges, lag | system.parts, system.merges, system.replicas | Analytical route health behind the proxy |
| RDBMS connections, dead tuples, lag | pg_stat_activity, pg_stat_user_tables, replication views | Transactional route health and archival effect |
None of these numbers is new; what the control plane adds is having them on one timeline so that a change on one route can be read against the database behind it. The parity failure count is the one to treat as a page rather than a graph, because a silent mismatch between routes is the failure mode a fabric can introduce that neither database would have produced alone.
Operational questions engineers ask about ChistaDATA Fabric
What does the proxy add to latency? A routing decision and a connection hand-off, measured in the fabric’s own per-route latency histogram; on a transactional path the pooled connection usually returns more than the hop costs, as it does with PgBouncer. The number to record is the p99 of the transactional route before and after, not an average.
Is the proxy a single point of failure? It is deployed as more than one instance behind a virtual IP or a load balancer, the same as any proxy tier, and its state (routing rules, pool configuration) is small and replicated. The failure to design for is a fabric outage taking both databases offline from the application’s perspective, so the runbook carries a bypass procedure that points applications at the RDBMS directly while the analytical route is degraded.
How is read-your-own-writes handled? By classification: any read that follows a write in the same session, or that the rules cannot prove is analytical, goes to the RDBMS. History in ClickHouse is, by construction, older than the archival cut-over and therefore never subject to a just-written row.
What has to be true of ClickHouse behind it? The same things that are true of any production ClickHouse: replicated tables with a healthy Keeper quorum, sort keys that match the analytical routes’ predicates, parts and merges under watch, and a tested restore. The fabric does not make an unhealthy ClickHouse healthy; it makes a healthy one reachable without an application change.
Which RDBMS engines? The archival post names the transactional engines ChistaDATA’s parent company MinervaDB has supported for a decade, PostgreSQL, MySQL and MariaDB among them; confirm the current list for a specific deployment with the ChistaDATA team, because a hub page is not a compatibility matrix.
How ChistaDATA Fabric compares with a plain pooler or a CDC pipeline
Two alternatives come up in every design review. A plain pooler (PgBouncer, ProxySQL, Pgpool-II) gives the transactional side pooling and failover but knows nothing about a second database; teams that use one and also want ClickHouse end up with the application choosing the database per query, which is exactly the coupling the fabric removes.
A CDC pipeline (Debezium into Kafka into ClickHouse) keeps ClickHouse current with the RDBMS but does nothing about which database an application reads from; it is complementary, and a fabric deployment with sub-minute freshness requirements on the analytical route uses CDC underneath it. The fabric’s distinct contribution is the routing decision and the single control plane; pooling and replication it shares with the tools above.
Where ChistaDATA Fabric is not the right tool
A single-database stack with no analytical workload gains nothing from a routing layer and should use a conventional pooler. A workload whose analytical reads must see the current transactional state to the millisecond cannot split reads without a CDC pipeline keeping ClickHouse within seconds of the RDBMS, and the honesty about that latency belongs in the design review. And an organisation that will not operate ClickHouse, or have it operated, should not introduce a second database behind a fabric; the fabric reduces the application-side cost of two databases, not the operational cost of the second one.
Version and status notes
ChistaDATA Fabric was introduced in March 2024 in the posts collected here. Capabilities, supported engines and deployment options evolve, and this page describes the design as those posts document it rather than a current release note; the introduction post and the ChistaDATA team are the sources for the current state. ClickHouse behaviour referenced above (large insert blocks, per-query memory budgets, replicated tables under Keeper) is community ClickHouse 23.x and later.
Reading the archive
Read the introduction for the six problems and six capabilities, the RDBMS-archival post for the design behind capability 5, and the proxy post for the general case behind capability 3. The archival store and ingestion hubs cover the ClickHouse-side mechanics that a fabric routes into.
ChistaDATA scopes fabric deployments as part of ClickHouse consulting and runs them under managed services, with the transactional side handled by MinervaDB. Every routing change is staged on a shadow route with result parity checked before traffic moves, the bypass procedure is rehearsed before go-live, and a tested restore of both databases exists before the first archival delete.