Baremetal is where ClickHouse’s per-core efficiency turns directly into money. The engine was built to saturate local NVMe and every core it can see, and it does so without a hypervisor, without noisy neighbours, and without a per-IOPS bill. That is the reason a correctly sized baremetal ClickHouse cluster routinely runs analytical workloads for a fraction of the equivalent cloud spend, and it is the argument made in the one post currently under this tag, bare-metal.io: run analytical workloads for one-fourth of the AWS cost. This page is the engineering behind that claim: how to size each hardware layer for ClickHouse, how to measure the box before trusting it, which ClickHouse settings change on dedicated hardware, and where the baremetal cost model stops being favourable.
The cost figures below are labelled illustrative. Hardware and cloud list prices move quarterly; the method for computing your own comparison is the point, not our numbers.
CPU: cores, clocks, and the instruction sets ClickHouse actually uses
ClickHouse parallelizes a single query across max_threads threads, defaulting to the number of physical cores, and its vectorized executor is compiled with runtime dispatch for SSE4.2, AVX2 and AVX-512. On baremetal you choose the CPU; on a cloud instance you inherit whatever the instance family exposes, sometimes with AVX-512 throttling or hyperthreads sold as vCPUs.
For mixed dashboard-plus-ingest workloads we size on physical cores, not threads. Hyperthreading helps ClickHouse modestly on aggregation-heavy queries and hurts on memory-bandwidth-bound scans; the safe default is to leave it on and set max_threads to physical cores. High core counts (64 to 128 physical per socket on current AMD EPYC and Intel Xeon parts) suit fan-out analytical queries; higher clocks suit low-latency point lookups on narrow sort keys. Check what the kernel sees before the first benchmark:
lscpu | egrep 'Model name|Socket|Core|Thread|NUMA|Flags' | sed 's/Flags:.*avx512f/Flags: ...avx512f/'
cat /sys/devices/system/cpu/cpu0/cpufreq/scaling_governor   # expect: performance
numactl --hardware
Two things bite repeatedly on newly racked baremetal. The CPU governor ships as powersave or schedutil on many distributions, which costs 10 to 20 percent on latency-sensitive queries; set it to performance. Dual-socket boards expose two NUMA nodes, and a ClickHouse process spanning both pays cross-socket memory latency on every large hash table. Either pin one ClickHouse instance per socket with numactl --cpunodebind --membind, or accept the penalty knowingly after measuring it.
Memory: sizing for the aggregation state, not the dataset
ClickHouse does not need RAM to hold the working set; it streams from disk and relies on the page cache opportunistically. RAM is needed for hash tables in GROUP BY and JOIN, for sort buffers, for merge operations, and for the mark and uncompressed caches. A 512 GiB to 1 TiB node is common at the high end, but the sizing question is: what is the largest GROUP BY state or right-hand join table the workload produces? The answer comes from system.query_log:
SELECT
    normalizedQueryHash(query)                    AS qh,
    count()                                        AS runs,
    formatReadableSize(max(memory_usage))          AS peak_mem,
    formatReadableSize(quantile(0.95)(memory_usage)) AS p95_mem,
    round(quantile(0.95)(query_duration_ms))       AS p95_ms,
    any(substring(query, 1, 120))                  AS sample
FROM system.query_log
WHERE type = 'QueryFinish'
  AND event_time > now() - INTERVAL 7 DAY
  AND query_kind = 'Select'
GROUP BY qh
ORDER BY max(memory_usage) DESC
LIMIT 20;
Size RAM so that the sum of concurrent peak states at your target concurrency fits under max_server_memory_usage (default 90 percent of physical RAM) with headroom for merges and caches. On baremetal, ECC memory is not optional; a single-bit error in a hash table produces a silently wrong aggregate, and the cloud has been absorbing that risk for you.
NVMe: the layer that decides whether baremetal wins
The economic case for baremetal ClickHouse rests on local NVMe. Cloud block storage meters IOPS and throughput and caps both per volume; local NVMe on a baremetal server delivers millions of random read IOPS and several GiB/s per device with no meter. ClickHouse’s read pattern, many parallel sequential reads of compressed column ranges, is precisely what NVMe is good at.
Before any ClickHouse benchmark, characterize the devices with fio. The two profiles that predict ClickHouse behaviour are large sequential reads at high queue depth (merge and scan) and 4 KiB random reads (mark lookups and small granule reads):
# sequential read, 1 MiB blocks, queue depth 32, 4 jobs -- expect multiple GiB/s per device
fio --name=seqread --filename=/dev/nvme0n1 --rw=read --bs=1M --iodepth=32 \
    --numjobs=4 --direct=1 --ioengine=libaio --runtime=60 --time_based --group_reporting

# random read, 4 KiB, queue depth 64 -- expect hundreds of thousands of IOPS per device
fio --name=randread --filename=/dev/nvme0n1 --rw=randread --bs=4k --iodepth=64 \
    --numjobs=8 --direct=1 --ioengine=libaio --runtime=60 --time_based --group_reporting

# mixed write, which is what merges and inserts produce
fio --name=seqwrite --filename=/dev/nvme0n1 --rw=write --bs=1M --iodepth=16 \
    --numjobs=2 --direct=1 --ioengine=libaio --runtime=60 --time_based --group_reporting
Record the results per device. A device that underperforms its siblings by more than 15 percent on the sequential profile is usually a firmware or PCIe-lane issue and should be fixed before the array is built.
Array layout and filesystem
For a replicated ClickHouse cluster, RAID 0 across the local NVMe devices via mdadm is the usual choice: replication provides durability, and the array provides aggregate throughput. RAID 10 halves usable capacity for a local durability that ReplicatedMergeTree already gives you across nodes. ClickHouse’s own usage recommendations name ext4 or XFS with noatime; we default to ext4 for its predictable behaviour under many small part files, and XFS where single-part files exceed a few hundred GiB.
mdadm --create /dev/md0 --level=0 --raid-devices=4 --chunk=1024 \
    /dev/nvme0n1 /dev/nvme1n1 /dev/nvme2n1 /dev/nvme3n1
mkfs.ext4 -E stride=256,stripe-width=1024 -O ^has_journal /dev/md0   # journal off is a deliberate choice for RAID0 replicated nodes; keep it on if unsure
echo '/dev/md0 /var/lib/clickhouse ext4 noatime,nodiratime,discard 0 0' >> /etc/fstab
echo mq-deadline > /sys/block/md0/queue/scheduler 2>/dev/null || true
for d in /sys/block/nvme*n1/queue; do echo none > $d/scheduler; echo 1024 > $d/nr_requests; done
The chunk size of 1 MiB matches ClickHouse’s typical column-range read size. Disabling the ext4 journal is a throughput gain that you should only take on nodes whose data is fully replicated elsewhere; on a single-replica node keep the journal.
Tiered storage: baremetal NVMe as the hot tier, object storage as the cold tier
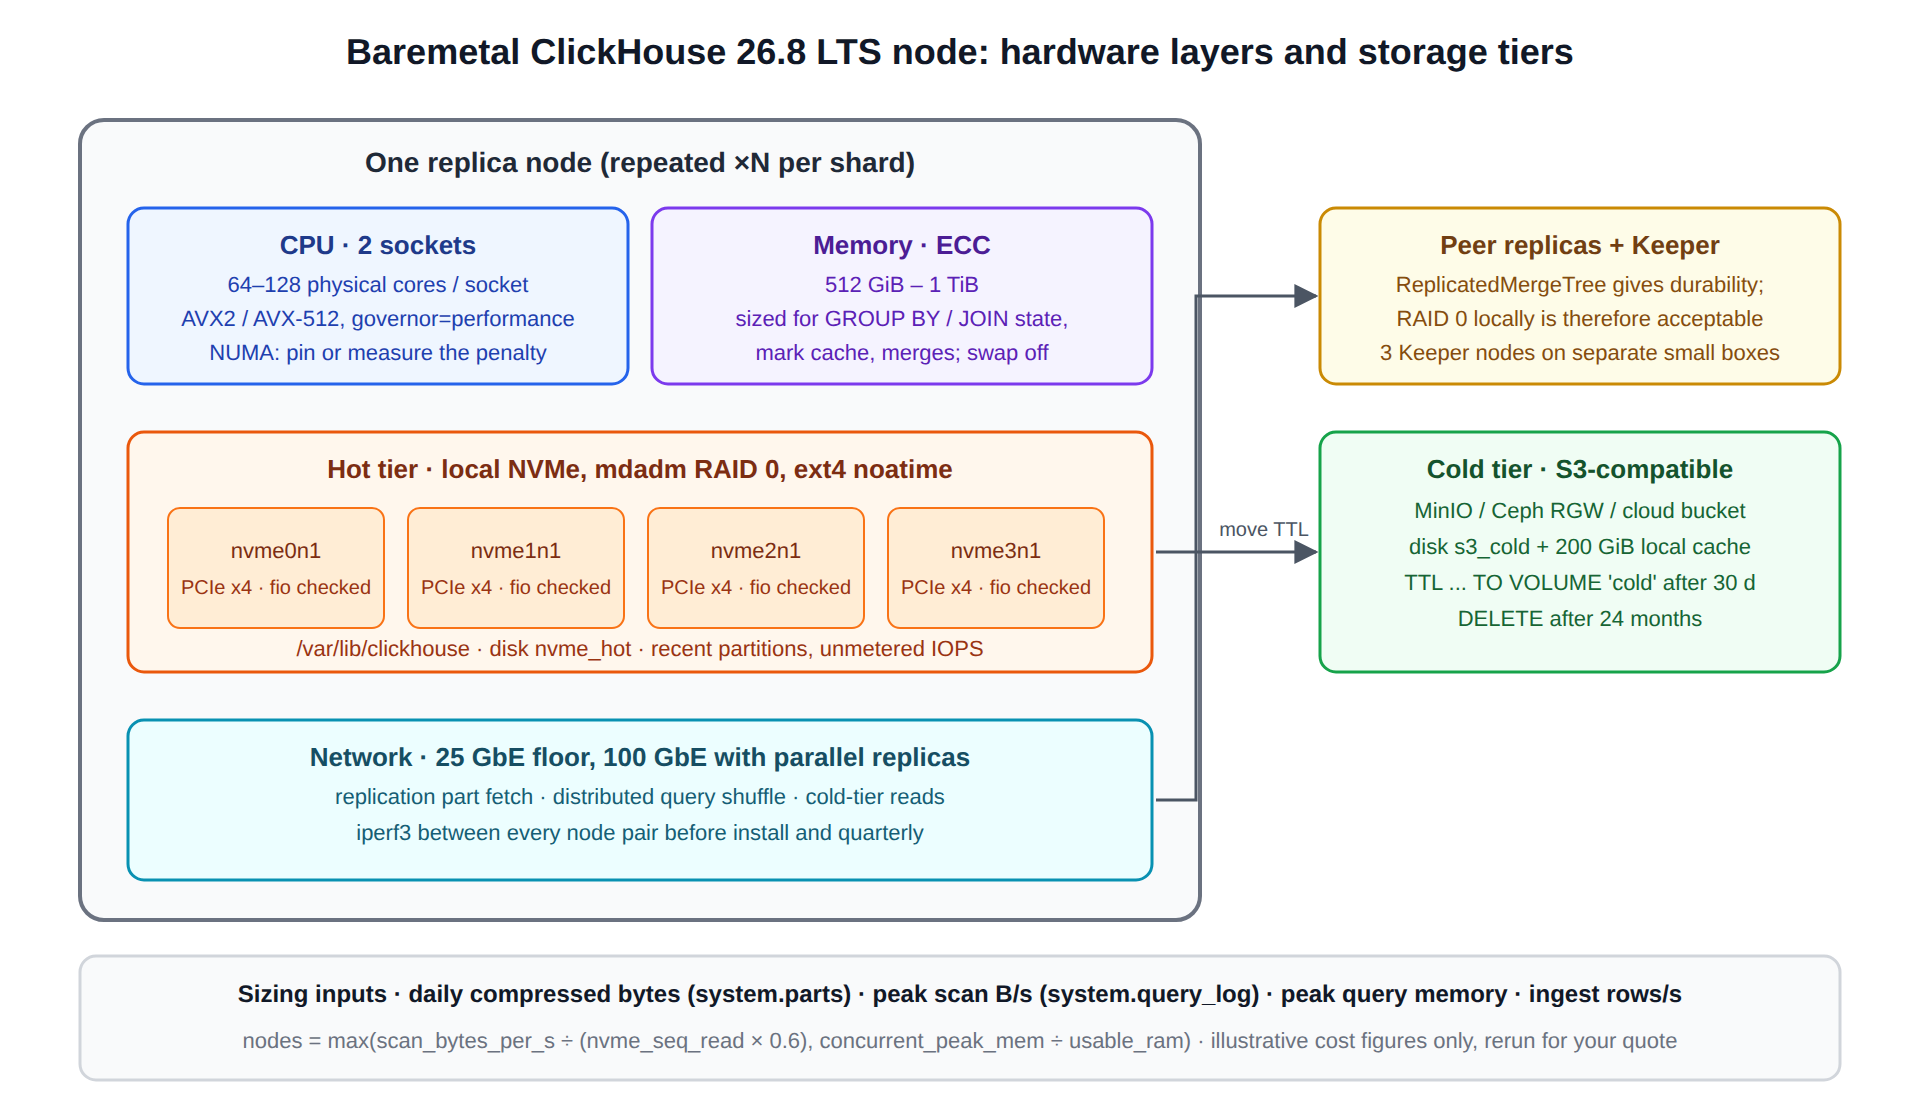
Baremetal does not mean giving up object storage. The pattern that produces the best cost curve keeps recent partitions on local NVMe and moves older ones to S3-compatible storage (an on-premises MinIO or Ceph RGW, or a public-cloud bucket) using a ClickHouse storage policy with a move TTL. The diagram shows the node layout we deploy.
<clickhouse>
  <storage_configuration>
    <disks>
      <nvme_hot>
        <path>/var/lib/clickhouse/</path>
      </nvme_hot>
      <s3_cold>
        <type>s3</type>
        <endpoint>https://${S3_ENDPOINT}/${S3_BUCKET}/clickhouse/</endpoint>
        <access_key_id>${S3_ACCESS_KEY}</access_key_id>
        <secret_access_key>${S3_SECRET_KEY}</secret_access_key>
        <metadata_path>/var/lib/clickhouse/disks/s3_cold/</metadata_path>
      </s3_cold>
      <s3_cold_cache>
        <type>cache</type>
        <disk>s3_cold</disk>
        <path>/var/lib/clickhouse/disks/s3_cold_cache/</path>
        <max_size>200Gi</max_size>
      </s3_cold_cache>
    </disks>
    <policies>
      <hot_cold>
        <volumes>
          <hot><disk>nvme_hot</disk></hot>
          <cold><disk>s3_cold_cache</disk></cold>
        </volumes>
        <move_factor>0.1</move_factor>
      </hot_cold>
    </policies>
  </storage_configuration>
</clickhouse>
CREATE TABLE events
(
event_ts DateTime CODEC(Delta, ZSTD(1)),
tenant_id UInt32,
metric LowCardinality(String),
value Float64 CODEC(Gorilla, ZSTD(1))
)
ENGINE = ReplicatedMergeTree('/clickhouse/tables/{shard}/events', '{replica}')
PARTITION BY toYYYYMM(event_ts)
ORDER BY (tenant_id, metric, event_ts)
TTL event_ts + INTERVAL 30 DAY TO VOLUME 'cold',
event_ts + INTERVAL 24 MONTH DELETE
SETTINGS storage_policy = 'hot_cold';
-- verify where parts live after the first TTL move
SELECT disk_name, count() AS parts, formatReadableSize(sum(bytes_on_disk)) AS size
FROM system.parts
WHERE table = 'events' AND active
GROUP BY disk_name;This config is a server-level change under config.d/ and requires a ClickHouse restart to add new disks; the storage policy is attached per table at creation. Test the move TTL on a copy of the table in staging, and confirm the cold cache size fits alongside the hot data before enabling it in production.
Network: the layer most often undersized
Distributed queries shuffle intermediate results between shards, replication streams parts between replicas, and cold-tier reads pull from object storage. A 10 GbE NIC saturates during a single large replicated part fetch. 25 GbE is the practical floor for a baremetal analytical cluster; 100 GbE is justified when parallel replicas (enable_parallel_replicas, ClickHouse 24.x and later) are in use, because that feature intentionally moves more data between nodes to spread the scan. Measure with iperf3 between every pair of nodes before installation and again quarterly; a single mis-negotiated link shows up as one replica always lagging in system.replication_queue.
The cost model, and how to run it for your workload
The figures in this section are illustrative and rounded; they are here to show the structure of the comparison, not to be quoted.
Consider an analytical cluster of three nodes, each with 64 physical cores, 512 GiB RAM and 15 TiB of local NVMe. Illustratively, a comparable cloud instance family with local NVMe lists in the range of several thousand dollars per node per month on demand, before storage snapshots, egress and support. A baremetal equivalent from a dedicated-server provider lists illustratively in the low-to-mid four figures per node per month, or a capital purchase amortized over three to five years that lands lower still. The bare-metal.io post under this tag reports its own comparison of roughly one-fourth the AWS cost for its tested configuration; treat that as that provider’s measurement of that configuration, and rerun the arithmetic for yours.
The line items that the headline comparison omits, and that decide the real answer:
| Line item | Baremetal | Cloud instance with local NVMe |
|---|---|---|
| Compute and local storage | Fixed monthly or amortized capex | Hourly, with reserved-instance discounts |
| Provisioned IOPS and throughput | None; NVMe is unmetered | None on local NVMe; metered on network block storage |
| Egress | Usually included or flat | Metered per GiB; material for API-serving workloads |
| Backups and cold tier | Object storage, on-prem or cloud | Object storage, same provider |
| Hardware failure handling | Provider swap SLA plus ClickHouse replication | Instance replacement plus ClickHouse replication |
| Capacity change lead time | Days to weeks | Minutes |
| Operations staffing | Same ClickHouse skills, plus OS and firmware | Same ClickHouse skills, plus cloud IAM and networking |
Baremetal wins decisively when utilization is steady and high, when egress is significant, and when the workload is I/O-bound in a way that metered block storage penalizes. It loses when the workload is bursty enough that a cluster sized for peak idles most of the month, when the team cannot tolerate a multi-day lead time for capacity, or when the organization has no hardware operations competence and no partner providing it.
ClickHouse settings that change on baremetal
Most ClickHouse defaults are already sized for dedicated hardware. The ones worth revisiting, with reload semantics:
| Setting | Default | Baremetal starting point | Scope / reload |
|---|---|---|---|
max_threads | physical cores | physical cores per NUMA node if pinning | user / session, no restart |
max_server_memory_usage_to_ram_ratio | 0.9 | 0.85 with a large page cache; 0.9 otherwise | server, restart |
background_pool_size | 16 | up to 32 on 64+ core nodes with fast NVMe | server, restart |
merge_tree.max_bytes_to_merge_at_max_space_in_pool | 150 GiB | raise when NVMe and RAM allow larger final parts | server, restart |
mark_cache_size | 5 GiB | 10 to 20 GiB on 512 GiB nodes with many tables | server, restart |
min_bytes_to_use_direct_io | 0 (off) | leave off; page cache on NVMe helps merges | user / session |
local_filesystem_read_method | pread_threadpool | io_uring on kernels 5.19+ after measuring | user / session |
Each is a hypothesis to test against system.query_log p95 and system.merges backlog, not a prescription. The io_uring read method in particular has improved across ClickHouse 24.x to 26.x and should be benchmarked on your kernel and device combination before adoption.
A baremetal sizing worksheet
Sizing a baremetal ClickHouse cluster is arithmetic once four workload numbers are known. Collect them from the existing system, whether that is a cloud ClickHouse, a warehouse being migrated, or a Kafka topic’s throughput.
Compressed data volume per day, from system.parts on an existing ClickHouse or from a sample load of one day’s data with the intended codecs. Multiply by hot retention in days, add 30 percent for merge headroom and part-level write amplification, and that is the NVMe requirement for the hot tier per replica. Cold retention multiplied by the same daily figure sizes the object-storage tier.
Peak sustained scan bytes per second, from read_bytes in system.query_log aggregated per second at the busiest hour. Divided by the per-node NVMe sequential read throughput measured with fio above, and again by the fraction of that throughput ClickHouse achieves in practice (0.5 to 0.7 on well-configured baremetal), this gives the minimum node count for scan-bound work.
Peak concurrent query memory, from the query-log memory profile above, summed at target concurrency. Divided by usable RAM per node, this gives the minimum node count for memory-bound work. Take the larger of the two node counts.
Ingest rows per second and batch size, which size the background merge pool and decide whether ingest and query workloads share nodes or are split.
-- daily compressed volume and rows, last 7 days, for the hot-tier calculation
SELECT
    toDate(min_time)                          AS d,
    formatReadableSize(sum(bytes_on_disk))    AS compressed,
    sum(rows)                                 AS rows
FROM system.parts
WHERE active AND min_time > now() - INTERVAL 7 DAY
GROUP BY d
ORDER BY d;

-- peak scan throughput per second, busiest hour
SELECT
    toStartOfSecond(event_time) AS s,
    formatReadableSize(sum(read_bytes)) AS scanned
FROM system.query_log
WHERE type = 'QueryFinish'
  AND event_time BETWEEN '2026-09-17 09:00:00' AND '2026-09-17 10:00:00'
GROUP BY s
ORDER BY sum(read_bytes) DESC
LIMIT 5;
Round the result up to an odd replica count per shard if the cluster will also host ClickHouse Keeper, or plan three dedicated Keeper nodes on smaller baremetal machines; Keeper’s requirement is low-latency fsync on its own disk, not core count, and co-locating it on a heavily merging data node is a recurring cause of session expirations.
Kernel and firmware checklist before the first benchmark
A baremetal server arrives with defaults chosen for a general-purpose workload. Ten minutes of configuration separates a box that benchmarks well from one that mysteriously underperforms the cloud instance it was meant to replace.
# CPU frequency and C-states
cpupower frequency-set -g performance
grep -H . /sys/devices/system/cpu/cpuidle/current_driver          # intel_idle / acpi_idle; disable deep C-states in BIOS for latency-sensitive nodes

# transparent hugepages: ClickHouse recommends 'madvise' or 'never', not 'always'
echo madvise > /sys/kernel/mm/transparent_hugepage/enabled

# swap off; ClickHouse manages memory limits itself
swapoff -a && sed -i '/ swap / s/^/#/' /etc/fstab

# file descriptors and memory map limits in /etc/security/limits.d/clickhouse.conf
#   clickhouse soft nofile 500000
#   clickhouse hard nofile 500000
sysctl -w vm.max_map_count=1048576
sysctl -w vm.overcommit_memory=0
sysctl -w net.core.somaxconn=4096
sysctl -w net.ipv4.tcp_max_syn_backlog=8192

# confirm NVMe firmware and PCIe link width per device
for d in /dev/nvme?; do nvme id-ctrl $d | egrep '^(mn|fr) '; done
lspci -vv | egrep -A1 'Non-Volatile' | grep -E 'LnkSta'
Every one of these is reversible and non-destructive, but apply them on a staging node first and rerun the fio profiles after each change so that the effect is attributable. A PCIe link negotiated at x2 instead of x4 halves a device’s throughput and is invisible from inside ClickHouse; it shows only in LnkSta.
Where this does not apply
None of the above argues for baremetal when the cluster is small enough that operations overhead dominates, when the workload is intermittent, or when the data already lives in a cloud region and egress to a baremetal facility would exceed the compute savings. ClickHouse Cloud, Altinity.Cloud, and ChistaDATA’s managed offering on cloud instances are all correct answers for those cases. Version notes: storage policy syntax and the cache disk type are stable since ClickHouse 22.x; parallel replicas became production-ready in the 24.x line; io_uring support is present since 23.x but its performance profile depends on kernel version.
Posts under this tag
The post that anchors this tag, bare-metal.io: run analytical workloads for one-fourth of the AWS cost, is a provider-side cost comparison for analytical workloads; the sizing and measurement method on this page is how we validate claims like it before a customer commits. Teams evaluating a baremetal ClickHouse deployment can scope a hardware and capacity review through ChistaDATA’s ClickHouse consulting, and ongoing operations through ClickHouse managed services. As always, benchmark on the actual hardware with the actual workload before signing a contract, and keep replicated copies and tested restores in place before any migration of production data.
