When a dashboard that rendered in 400 ms starts taking 9 seconds, the difference between a five-minute fix and a five-hour war room is usually methodology. Effective ClickHouse slow query troubleshooting does not start with guessing at settings — it starts with system.query_log, the single richest source of per-query telemetry in the server. This post documents the ClickHouse slow query troubleshooting workflow we use at ChistaDATA across hundreds of production clusters: which query_log fields to read first, how to move from symptom to root cause, and which follow-up system tables confirm the diagnosis. It is written for engineers who operate ClickHouse in production and need repeatable answers, not one-off luck.
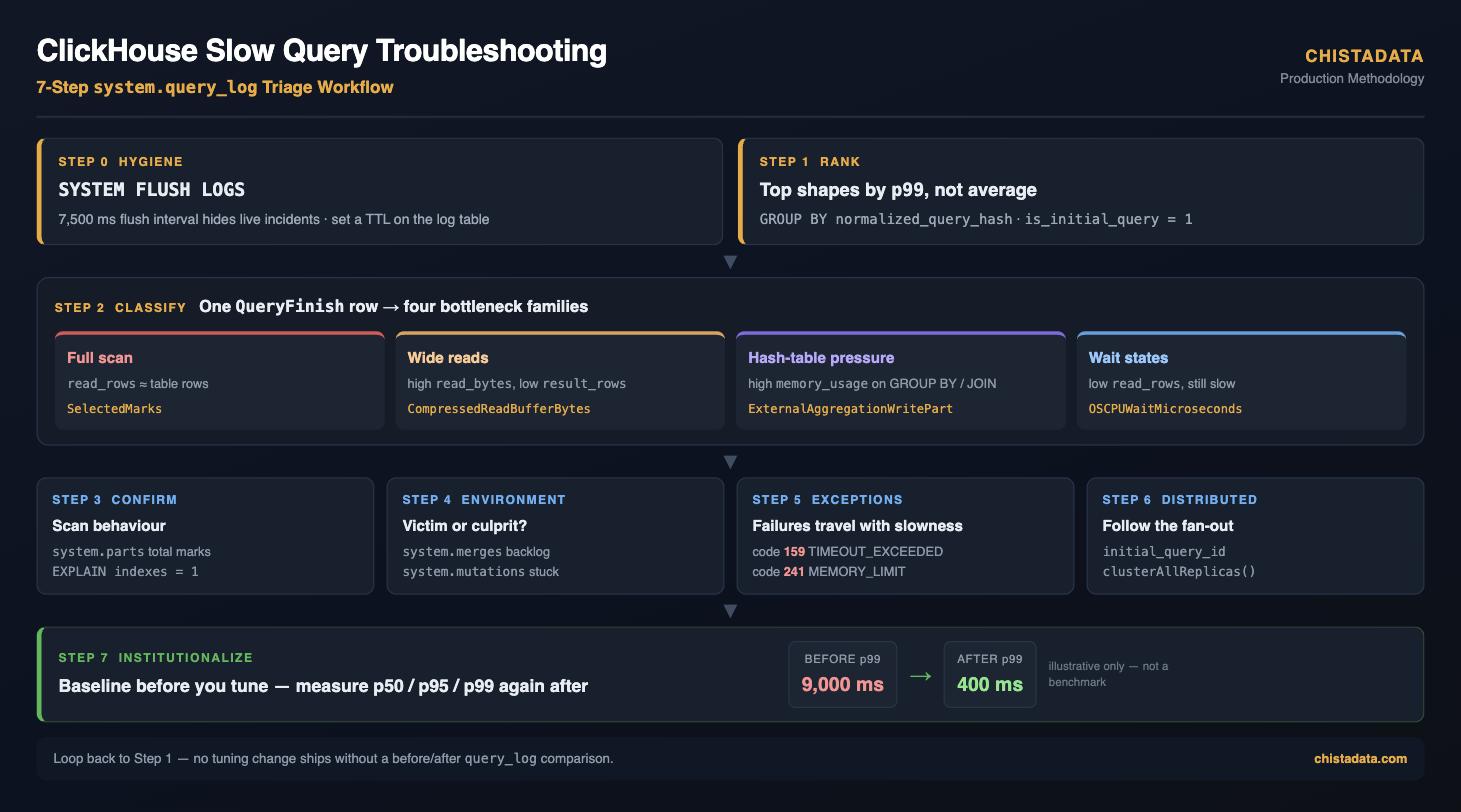
system.parts, then baseline before and after every change.The diagram above is the entire ClickHouse slow query troubleshooting loop on one screen — hygiene, ranking, classification, confirmation, environment, exceptions, distribution, and measurement. Every section below expands one box of that ClickHouse slow query troubleshooting workflow, in the order an on-call engineer should work through them.
ClickHouse Slow Query Troubleshooting Starts with query_log Hygiene
Query logging is enabled by default (log_queries = 1), but two details routinely bite production teams. First, system.query_log is itself a MergeTree table flushed on an interval (flush_interval_milliseconds, 7,500 ms by default), so the last few seconds of activity may not be visible yet — run SYSTEM FLUSH LOGS before investigating a live incident. Second, without a TTL the log grows unbounded; configure one explicitly in config.xml rather than relying on defaults:
<query_log>
    <database>system</database>
    <table>query_log</table>
    <engine>ENGINE = MergeTree
             PARTITION BY toYYYYMM(event_date)
             ORDER BY (event_date, event_time)
             TTL event_date + INTERVAL 90 DAY DELETE
             SETTINGS index_granularity = 8192</engine>
    <flush_interval_milliseconds>7500</flush_interval_milliseconds>
</query_log>
<!-- Requires a server restart when changing the engine definition;
     drop or rename the old system.query_log first so the new engine applies. -->
Each query can produce multiple rows distinguished by the type column: QueryStart, QueryFinish, ExceptionBeforeStart, ExceptionWhileProcessing. For latency work, filter to type = 'QueryFinish'; for error triage, the two exception types are your dataset. The full column reference lives in the official system.query_log documentation.
Step 1 — Find the Offenders: Top Queries by p99, Not by Average
Averages hide incidents, and effective ClickHouse slow query troubleshooting therefore ranks by tail latency. Group by normalized_query_hash (available since ClickHouse 21.x), which collapses literals so that a thousand parameter variants of the same statement aggregate into one row:
SELECT
    normalized_query_hash,
    any(query)                                          AS sample_query,
    count()                                             AS executions,
    quantile(0.50)(query_duration_ms)                   AS p50_ms,
    quantile(0.99)(query_duration_ms)                   AS p99_ms,
    max(query_duration_ms)                              AS max_ms,
    formatReadableSize(max(memory_usage))               AS peak_memory,
    sum(read_rows)                                      AS total_read_rows,
    formatReadableSize(sum(read_bytes))                 AS total_read_bytes
FROM system.query_log
WHERE type = 'QueryFinish'
  AND event_time >= now() - INTERVAL 6 HOUR
  AND is_initial_query = 1
GROUP BY normalized_query_hash
ORDER BY p99_ms DESC
LIMIT 20;
Two details matter here. is_initial_query = 1 excludes the internal sub-queries a distributed query fans out to replicas, so you rank user-facing statements, not their shards. And ranking by p99_ms surfaces the query shapes actually violating your SLO — a query with a fine median and a catastrophic tail is exactly the one an average-based report hides.
Step 2 — Classify the Bottleneck from One Row of Telemetry
Once a normalized_query_hash is identified, a single QueryFinish row usually tells you which of four bottleneck families you are in. Most ClickHouse slow query troubleshooting stalls at exactly this point, because teams skip the classification and jump straight to tuning. These ratios are the diagnostic core of ClickHouse slow query troubleshooting, and every one of them comes straight from query_log columns and the ProfileEvents map (a native Map column since ClickHouse 21.x):
| Symptom in query_log | Likely bottleneck | Confirming signal |
|---|---|---|
read_rows ≈ table row count | Full scan — primary key not used | ProfileEvents['SelectedMarks'] close to total marks in system.parts |
High read_bytes, low result_rows | Wide reads — too many columns or poor compression | ProfileEvents['CompressedReadBufferBytes'] dominates |
High memory_usage, duration dominated by aggregation | GROUP BY / JOIN hash-table pressure | ProfileEvents['ExternalAggregationWritePart'] > 0 means it spilled to disk |
Low read_rows, still slow | Wait states: locks, replica delays, queue time | ProfileEvents['OSCPUWaitMicroseconds'], query_start_time vs first read |
Pull the relevant counters directly rather than eyeballing the whole map:
SELECT
    query_duration_ms,
    read_rows,
    formatReadableSize(read_bytes)                       AS read_bytes_h,
    formatReadableSize(memory_usage)                     AS memory_h,
    ProfileEvents['SelectedParts']                       AS selected_parts,
    ProfileEvents['SelectedMarks']                       AS selected_marks,
    ProfileEvents['ExternalAggregationWritePart']        AS ext_agg_spills,
    ProfileEvents['OSCPUWaitMicroseconds']               AS cpu_wait_us
FROM system.query_log
WHERE type = 'QueryFinish'
  AND normalized_query_hash = ${TARGET_HASH}
ORDER BY event_time DESC
LIMIT 5;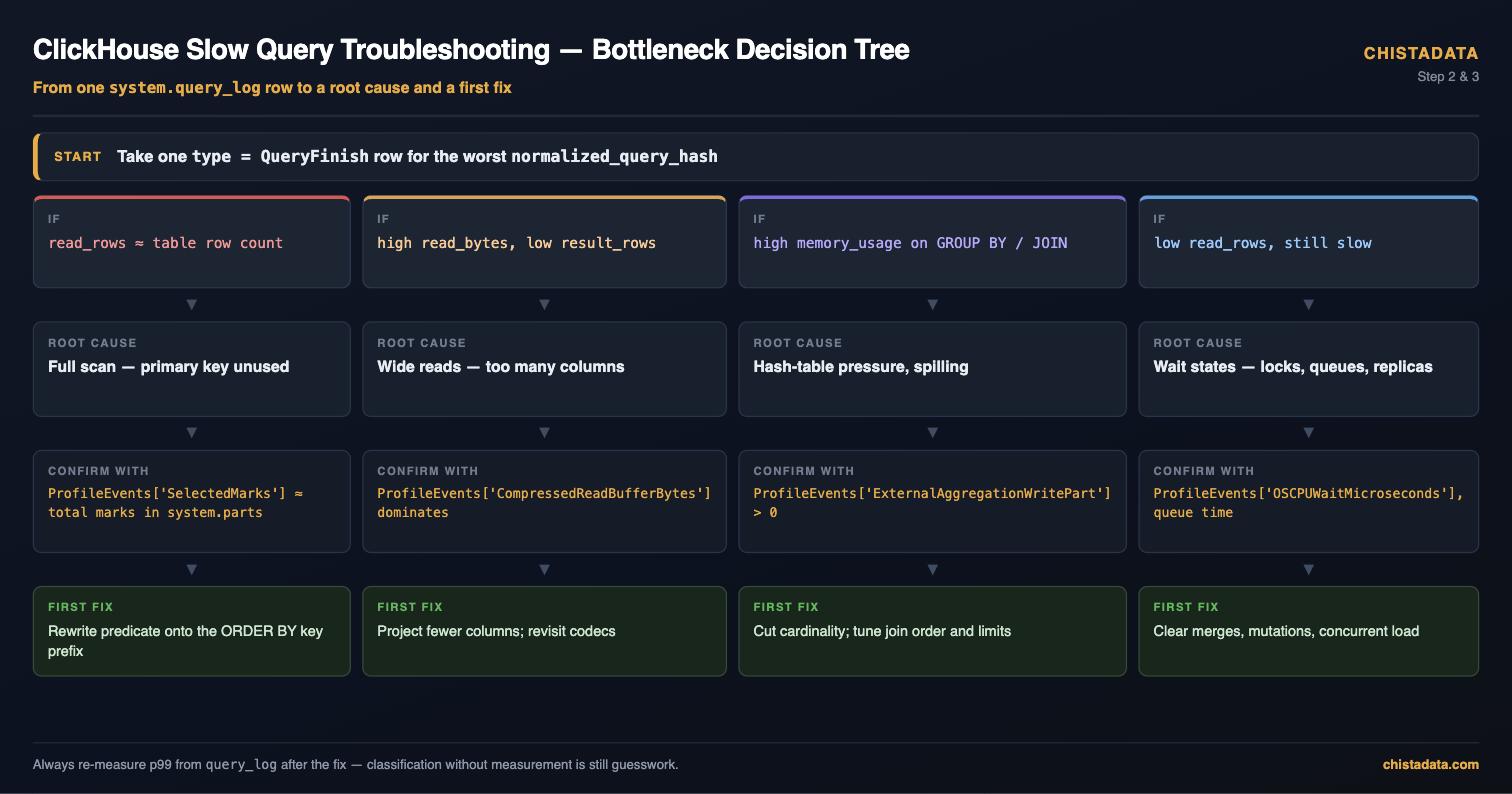
QueryFinish row points to one root cause, one confirming signal, and one first fix.Read the decision tree left to right for whichever ratio your row matched. The value of writing it down this way is that ClickHouse slow query troubleshooting becomes reproducible: two engineers looking at the same row reach the same classification, pull the same confirming counter, and propose the same first fix instead of arguing from intuition.
Step 3 — Confirm Scan Behavior Against system.parts
Is the primary key doing its job?
SelectedMarks only means something relative to the table’s total marks. Compare against system.parts for the target table:
SELECT
    sum(marks)                                    AS total_marks,
    sum(rows)                                     AS total_rows,
    count()                                       AS active_parts,
    formatReadableSize(sum(bytes_on_disk))        AS bytes_on_disk_h
FROM system.parts
WHERE database = ${TARGET_DB}
  AND table = ${TARGET_TABLE}
  AND active = 1;
In ClickHouse slow query troubleshooting, if a query reads 95% of total marks while filtering on a column, that column is not in (or not a usable prefix of) the ORDER BY key. The fix hierarchy, cheapest first: rewrite the predicate to use the existing key prefix; add a data-skipping index; add a projection (production-ready since ClickHouse 22.x); and only as a last resort re-key the table — a full rewrite whose blast radius must be planned as a migration, never an in-place tweak.
Cross-check the plan with EXPLAIN
EXPLAIN indexes = 1 SELECT ... (since ClickHouse 21.x) shows exactly how many parts and granules each index stage kept versus dropped, letting you verify a skip index or projection is actually being used before you trust it in production, which makes it the cheapest confirmation step in ClickHouse slow query troubleshooting. For execution-graph analysis — thread counts, single-threaded stages, pipeline shape — EXPLAIN PIPELINE is the companion tool; we cover it in depth in a separate post.
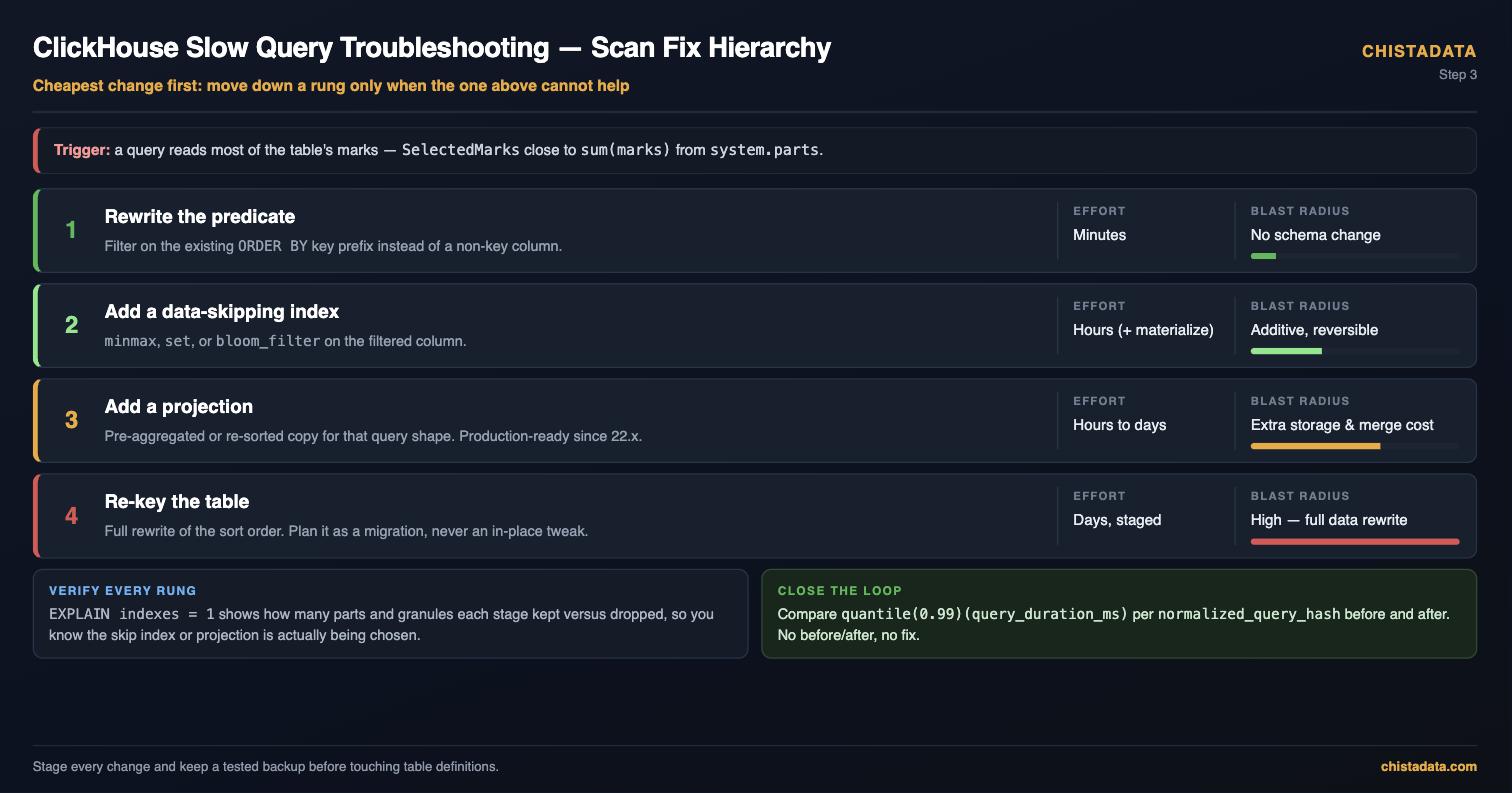
Work down that ladder rather than jumping to the bottom of it. Most scan problems we see during ClickHouse slow query troubleshooting engagements are solved on the first or second rung, and every rung below adds storage, merge cost, or migration risk. Whichever rung you land on, re-run EXPLAIN indexes = 1 afterwards to prove the new structure is actually being chosen by the planner.
Step 4 — Rule Out the Environment: Merges, Mutations, and Neighbors
A query that regressed with no code change is often a victim, not a culprit, so ClickHouse slow query troubleshooting has to clear the environment before it touches the SQL. Three checks, in order:
- Concurrent load — re-query
query_logfor everything overlapping the slow run’s time window; a bulk export saturating IO explains many “random” tail spikes. - Merge backlog —
SELECT count(), sum(total_size_bytes_compressed) FROM system.merges;plus part counts per partition fromsystem.parts. Reads over hundreds of small parts multiply seek and mark-index costs. - Stuck mutations —
SELECT * FROM system.mutations WHERE is_done = 0;— a long-runningALTER ... UPDATE/DELETErewrites parts and competes for the same disk and CPU.
For CPU-bound cases where query_log ratios look healthy but wall-clock time is high, escalate to system.trace_log with the sampling profiler enabled — that workflow (through to flamegraphs) is its own methodology and we treat it separately.
Step 5 — Don’t Forget the Failures: Exception Triage from the Same Table
ClickHouse slow query troubleshooting and error triage share a data source, and slow queries frequently travel with failing ones — timeouts, memory kills, and replica errors are just latency problems that hit a ceiling. The exception rows carry the full picture:
SELECT
    exception_code,
    substring(exception, 1, 120)   AS exception_head,
    count()                        AS occurrences,
    max(event_time)                AS last_seen,
    any(normalized_query_hash)     AS sample_hash
FROM system.query_log
WHERE type IN ('ExceptionBeforeStart', 'ExceptionWhileProcessing')
  AND event_time >= now() - INTERVAL 24 HOUR
GROUP BY exception_code, exception_head
ORDER BY occurrences DESC
LIMIT 20;
The type distinction is diagnostic on its own. ExceptionBeforeStart means the query never executed — syntax, permissions, quota, or parse-time resource checks — so no amount of index work will change it. ExceptionWhileProcessing means execution began and hit a wall; code 159 (TIMEOUT_EXCEEDED) rows are your slow-query population that gave up, and code 241 (MEMORY_LIMIT_EXCEEDED) rows point at aggregation and join state. Treat a rising 159 count on a specific normalized_query_hash as a latency regression that has already breached its budget, and fold it into the same triage flow as Steps 1–4.
Step 6 — Distributed Queries: Follow initial_query_id Across the Cluster
On sharded clusters, the initiator’s query_log row shows total duration but hides where the time went. Every shard-local sub-query carries the coordinator’s ID in initial_query_id, and clusterAllReplicas lets you assemble the fan-out from one seat:
SELECT
    hostName()                            AS host,
    query_duration_ms,
    read_rows,
    formatReadableSize(read_bytes)        AS read_bytes_h,
    formatReadableSize(memory_usage)      AS memory_h
FROM clusterAllReplicas(${CLUSTER_NAME}, system.query_log)
WHERE initial_query_id = ${TARGET_QUERY_ID}
  AND type = 'QueryFinish'
ORDER BY query_duration_ms DESC;
Read the spread, not just the max, because distributed ClickHouse slow query troubleshooting lives in the per-host variance. One shard at 8 s while the rest finish in 900 ms is a data-skew or hardware-asymmetry problem — confirm with per-host part and row counts from system.parts on the outlier. All shards uniformly slow points back at the query shape itself, and the initiator dominating after the shards return points at the final merge/aggregation stage on the coordinator. Each of those three shapes has a completely different fix, which is exactly why the per-host breakdown must precede any tuning decision.
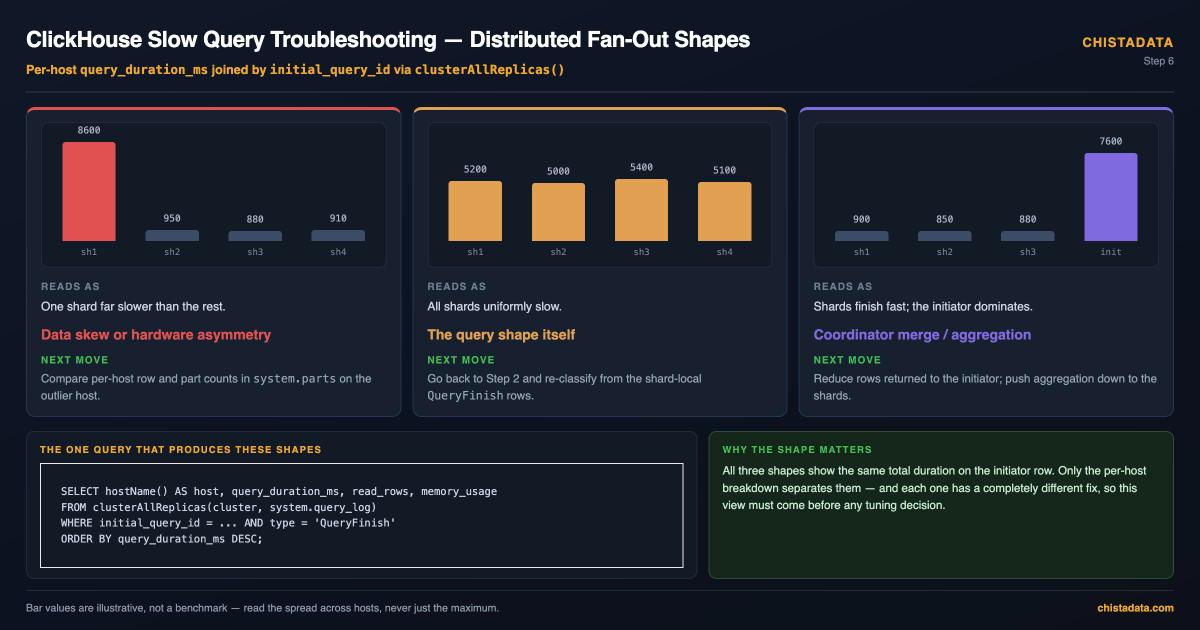
The three shapes above are worth memorising, because the initiator row looks identical in all of them. A single lagging shard is a data or hardware problem; a uniformly slow fan-out is a query-shape problem that sends you back to Step 2; and an initiator that dominates after the shards return is a final merge or aggregation problem on the coordinator. Distributed ClickHouse slow query troubleshooting therefore starts with the per-host breakdown, never with the total.
Step 7 — Institutionalize: Baseline Before You Tune
Every fix in ClickHouse slow query troubleshooting must be validated against a measured baseline, or you are tuning by folklore. Record p50/p95/p99 per normalized_query_hash for a representative window before the change, apply the change in staging, replay or re-run the workload, and compare. Illustrative example (numbers invented for illustration only, not a benchmark): a projection that drops SelectedMarks from 180,000 to 2,400 should show up as an order-of-magnitude p99 improvement in query_log — if it does not, the projection is not being chosen and EXPLAIN indexes = 1 will tell you why.
Finally, make ClickHouse slow query troubleshooting a runbook rather than tribal knowledge. The seven steps above compress into an on-call checklist that fits on one screen: flush logs; rank shapes by p99; classify from one row’s ratios; confirm scan behavior against system.parts and EXPLAIN indexes = 1; check merges, mutations, and concurrent load; sweep exceptions; and for distributed queries, break the fan-out down by host via initial_query_id. Every escalation that follows the checklist arrives with the same evidence attached, which is what turns a two-hour incident bridge into a fifteen-minute handoff — the paged engineer inherits telemetry, not adjectives.
The standing rule for all ClickHouse slow query troubleshooting work: test every change in a staging environment before production, stage rollouts so they are reversible, and maintain a robust backup and disaster-recovery posture before touching table definitions.
Key Takeaways
- Start every ClickHouse slow query troubleshooting session with
SYSTEM FLUSH LOGS;system.query_logflushes on an interval and live incidents hide in the gap. - Rank query shapes by
quantile(0.99)(query_duration_ms)grouped bynormalized_query_hash— averages conceal SLO violations. - Classify the bottleneck from ratios:
read_rowsvs table size,read_bytesvsresult_rows,memory_usage, andProfileEventscounters. - Validate index effectiveness with
SelectedMarksagainst total marks insystem.parts, confirmed byEXPLAIN indexes = 1. - Rule out environmental causes — merge backlog (
system.merges), stuck mutations (system.mutations), and concurrent workload — before rewriting any query. - Never ship a tuning change without a before/after p99 comparison from
query_logitself — that closing measurement is what separates ClickHouse slow query troubleshooting from guesswork.
FAQ
How do I find slow queries in ClickHouse?
Query system.query_log with type = 'QueryFinish', group by normalized_query_hash, and order by quantile(0.99)(query_duration_ms). This ranks query shapes by tail latency, which is what users and SLOs actually experience, and it is the opening move in any ClickHouse slow query troubleshooting session.
Why is my ClickHouse query slow even with a small result set?
Compare read_rows and read_bytes to result_rows in query_log. A large gap means ClickHouse scanned far more data than it returned — typically a predicate that cannot use the ORDER BY key prefix, missing skip indexes, or an exploded part count visible in system.parts.
Does system.query_log slow down ClickHouse?
The overhead of query logging is negligible for analytical workloads and it is enabled by default. The real operational risk is unbounded growth — set a TTL on the log table engine so it cannot consume the disk.
What is normalized_query_hash in ClickHouse?
It is a hash of the query text with literals stripped (since ClickHouse 21.x), so parameterized variants of the same statement share one hash. It is the correct grouping key for ClickHouse slow query troubleshooting across repeated executions.
If your team is fighting recurring latency incidents, ChistaDATA’s ClickHouse Performance Consulting and 24x7x365 Support puts this ClickHouse slow query troubleshooting methodology on retainer — with a 15-minute S1 response SLA, root-cause reports anchored in your own system.* telemetry, and zero vendor lock-in on 100% open-source ClickHouse. Talk to a ChistaDATA ClickHouse engineer.
Running ClickHouse in production? ChistaDATA provides ClickHouse consulting for architecture, performance and migrations, and 24×7 ClickHouse support with a 15-minute S1 response. For day-to-day operations see ClickHouse DBA services and ClickHouse managed services.
