Few errors generate more repeat pages than ClickHouse memory limit exceeded — DB::Exception code 241, Memory limit (for query|for user|total) exceeded. Teams typically respond by raising max_memory_usage until the error moves somewhere worse: from a failed query to an OOM-killed server. This post is the permanent-fix version: a taxonomy of which limit actually fired, the system.query_log evidence to collect, and the durable remediations — external aggregation and sort spilling, memory-efficient distributed aggregation, join strategy, and correctly layered limits — for engineers running production clusters who want the error class gone, not postponed.
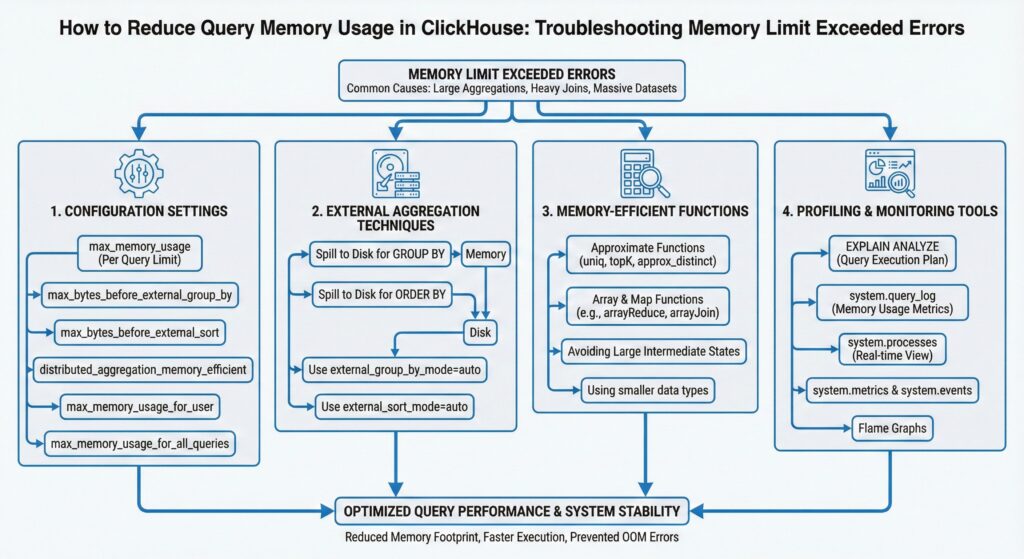
ClickHouse Memory Limit Exceeded: Which Limit Actually Fired?
The exception text names the scope, and each scope has a different owner and fix (the query complexity settings reference documents each limit). Misreading this line is the root cause of most bad remediations:
| Error text contains | Limit that fired | Scope | Typical correct response |
|---|---|---|---|
Memory limit (for query) exceeded | max_memory_usage | Single query | Make the query spill or shrink its state — not raise the cap first |
Memory limit (for user) exceeded | max_memory_usage_for_user | All concurrent queries of one user | Concurrency/workload isolation per user profile |
Memory limit (total) exceeded | max_server_memory_usage (or max_server_memory_usage_to_ram_ratio, default 0.9) | Whole server incl. caches, merges, dictionaries | Capacity and cache-sizing conversation, never a per-query tweak |
| OvercommitTracker messages | Memory overcommit arbitration (since ClickHouse 22.x) | Query selected as overcommit victim | Tune memory_overcommit_ratio_denominator / query waits, or fix the noisy neighbor |
Then quantify the offender from telemetry rather than the error alone. Failed queries appear in query_log as ExceptionWhileProcessing with their peak usage recorded:
SELECT
    event_time,
    normalized_query_hash,
    formatReadableSize(memory_usage)                              AS peak_memory,
    ProfileEvents['ExternalAggregationWritePart']                 AS agg_spill_parts,
    ProfileEvents['ExternalSortWritePart']                        AS sort_spill_parts,
    exception
FROM system.query_log
WHERE type = 'ExceptionWhileProcessing'
  AND exception_code = 241
  AND event_time >= now() - INTERVAL 24 HOUR
ORDER BY memory_usage DESC
LIMIT 20;
The spill counters are the tell: a query that died at the memory ceiling with zero spill parts was never allowed to use disk — which is precisely the class of failure the next section eliminates.
Step 2 — Permanent Fix #1: Let GROUP BY and ORDER BY Spill

ClickHouse aggregation and sorting hold state in RAM by default until told otherwise. External (disk-spilling) execution converts hard failures into slower-but-successful queries — the correct trade for batch and reporting workloads:
-- Per profile (users.xml) or per session. Values are illustrative starting
-- points for a 32 GB query budget — derive yours from measured peak_memory.
SET max_memory_usage                  = 32000000000;  -- 32 GB hard cap, bytes
SET max_bytes_before_external_group_by = 16000000000; -- spill GROUP BY at ~50% of cap
SET max_bytes_before_external_sort     = 16000000000; -- spill ORDER BY at ~50% of cap
The 50%-of-cap rule of thumb exists because the merge phase of external aggregation needs headroom of its own; setting the spill threshold equal to the cap defeats the purpose. Verify effectiveness after the change: the same query shape should now show ExternalAggregationWritePart > 0 and type = 'QueryFinish' instead of code 241. Note the durability trade-off explicitly: spilling shifts pressure to disk IO — watch ProfileEvents['ExternalAggregationCompressedBytes'] and disk utilization, and keep temp storage (tmp_path / tmp_policy in server config) on fast media, sized in advance.
Step 3 — Permanent Fix #2: Distributed Aggregation That Doesn’t Centralize State
On clusters, a high-cardinality GROUP BY over a Distributed table can drown the initiator node, which must merge every shard’s partial states. Two settings change the shape of that merge:
distributed_aggregation_memory_efficient = 1— shards stream partial aggregates in ordered blocks so the initiator merges incrementally instead of materializing everything; the standard setting for large distributed GROUP BYs.optimize_distributed_group_by_sharding_key = 1(since ClickHouse 20.x) — when the GROUP BY key aligns with the sharding key, aggregation completes on the shards and the initiator merely concatenates, eliminating the merge state entirely. This is a design-level argument for choosing sharding keys that match your dominant aggregation keys.
Attribution check: if code-241 failures show is_initial_query = 1 on the initiator while shard-local sub-queries succeed, you are in exactly this scenario.
Step 4 — Permanent Fix #3: JOINs That Exceed RAM

The default hash join materializes the right-hand table in memory; a fact-to-fact join is therefore a memory incident waiting for data growth. The durable options, in preference order:
- Shrink the right side — filter and pre-aggregate the right table in a subquery before the JOIN; the cheapest fix and the most frequently skipped.
- Grace hash join —
SET join_algorithm = 'grace_hash'(since ClickHouse 22.12), which partitions both sides to disk in buckets; pair withgrace_hash_join_initial_bucketsand verify spill behavior in staging. - Partial-merge join —
join_algorithm = 'partial_merge', older disk-friendly alternative; slower, predictable memory. - Dictionary or JOIN-engine table — for hot dimension lookups, move the right side into a dictionary with an explicit layout and lifetime so the memory cost is fixed, shared, and observable in
system.dictionariesinstead of paid per query.
Step 4.5 — When the Server Total Fires: Account for the Non-Query Consumers

Memory limit (total) exceeded with only modest queries running means the budget is being spent by everything that is not a query. The server-total tracker covers caches, background merges, dictionaries, and buffer tables, and each is individually observable — so audit before resizing anything:
-- Live global memory picture:
SELECT metric, formatReadableSize(value) AS size
FROM system.metrics
WHERE metric IN ('MemoryTracking', 'MergesMutationsMemoryTracking');

-- Cache footprints:
SELECT
    formatReadableSize(value) AS size,
    metric
FROM system.asynchronous_metrics
WHERE metric IN ('UncompressedCacheBytes', 'MarkCacheBytes', 'PrimaryKeyCacheBytes');

-- Dictionary residency:
SELECT
    name,
    formatReadableSize(bytes_allocated) AS allocated
FROM system.dictionaries
ORDER BY bytes_allocated DESC
LIMIT 10;
Frequent findings from these three queries in the field: a mark cache (mark_cache_size, 5 GB default in recent builds — verify on your version) that was raised “temporarily” years ago; hashed-layout dictionaries that grew with a dimension table into tens of gigabytes; and merge memory spikes during compaction storms — visible in MergesMutationsMemoryTracking and capped since ClickHouse 23.x via merges_mutations_memory_usage_soft_limit / merges_mutations_memory_usage_to_ram_ratio. Primary-key structures for very wide keys also count against the server, observable per table via primary_key_bytes_in_memory in system.parts.
One accounting subtlety prevents a classic false alarm: ClickHouse’s tracker measures allocations the server made, while the OS-resident set also reflects allocator (jemalloc) retention — so RSS moderately above MemoryTracking is normal, not a leak. Compare trends, not absolute equality, and treat a growing gap as the investigation trigger. The remediation ordering for total-limit pressure is therefore: audit caches and dictionaries first, cap merge memory second, and only then revisit the per-profile query budgets from the next section — shrinking query caps to pay for an oversized cache is solving the wrong equation.
Step 5 — Layer the Limits So Failures Are Contained by Design
Permanent stability comes from limits that fail the smallest possible scope first. The layering we deploy for customers (values illustrative — derive from host RAM and workload classes, and note server-level settings require config reload while profile settings apply per session):
<!-- config.xml : server ceiling, protects the OS and page cache -->
<max_server_memory_usage_to_ram_ratio>0.85</max_server_memory_usage_to_ram_ratio>

<!-- users.xml : workload-class profiles -->
<profiles>
    <etl_batch>
        <max_memory_usage>48000000000</max_memory_usage>
        <max_bytes_before_external_group_by>24000000000</max_bytes_before_external_group_by>
        <max_bytes_before_external_sort>24000000000</max_bytes_before_external_sort>
    </etl_batch>
    <dashboard_api>
        <max_memory_usage>8000000000</max_memory_usage>
        <max_memory_usage_for_user>24000000000</max_memory_usage_for_user>
        <max_execution_time>30</max_execution_time>
    </dashboard_api>
</profiles>
The principle: interactive profiles get small per-query caps and per-user aggregates so one bad dashboard cannot evict the ETL pipeline; batch profiles get large caps with spilling enabled, so they degrade to disk instead of dying. Since ClickHouse 22.x, the overcommit tracker adds a second line of defense by choosing a victim query when the server total is threatened — but overcommit is an airbag, not a seatbelt; layered profiles remain the primary control. Monitor the outcome continuously via system.metrics (MemoryTracking) and code-241 counts per profile in query_log.
Step 6 — Alert on the Trend, Not the Incident
A ClickHouse memory limit exceeded error should page you as a rate anomaly before it pages you as an outage. Three signals cover the space, each from telemetry already discussed:
- The daily count of
exception_code = 241per user/profile fromsystem.query_log(a rising trend on one profile is a workload change to investigate, not a fleet problem). MemoryTrackingfromsystem.metricsas a percentage of the server ceiling, alerted at a sustained threshold such as 80% so capacity conversations happen weeks before the wall.- Per-shape peak
memory_usagepercentiles tracked over time, because a query shape whose p99 memory has grown 4× in a quarter will cross its cap on a predictable date — data growth is the most forecastable failure mode in this entire error class.
Teams that plot these three lines convert memory incidents from surprises into scheduled work, which is the actual definition of a permanent fix.
Every change above — profile edits, join algorithm switches, spill thresholds — must be validated in a staging environment with production-shaped data before rollout, applied in reversible stages, and backed by a tested backup/DR posture. Memory tuning changes failure modes; make sure the new ones are the ones you chose.
Common Anti-Patterns That Trigger ClickHouse Memory Limit Exceeded
Most ClickHouse memory limit exceeded incidents trace back to a short list of query shapes and operational habits rather than to an undersized server. Auditing for these removes more incidents than any settings change, because each one inflates in-RAM state that no cap can absorb once data grows.
- Raising the cap first. Bumping
max_memory_usagemoves a ClickHouse memory limit exceeded failure from a single query to the whole server, where recovery is slower and the blast radius is far larger. - High-cardinality GROUP BY without spilling. Grouping by
user_id,session_id, or raw URLs builds a hash table sized by distinct keys; withmax_bytes_before_external_group_byunset, that state has nowhere to go but RAM. - Exact distinct counts at scale.
uniqExactandDISTINCTretain every value, whileuniqanduniqCombinedgive bounded memory for a small, documented error margin. - The large table on the right of a JOIN. The right-hand side is what gets built in memory, so operand order alone can decide whether the query completes or throws code 241.
- Large
INsubqueries. A subquery returning millions of keys is materialised as a set before the outer scan begins, and that set is charged to the same per-query budget. - Unbounded concurrency. A cap that is safe for one query is not safe for forty of them; without
max_concurrent_queriesand per-user ceilings, the server total fires instead of the query. - Ignoring the non-query consumers. Dictionaries, the mark cache, and background merges hold memory that never shows up in any single query’s
memory_usagecolumn.
A 15-Minute Triage Runbook for ClickHouse Memory Limit Exceeded
When the page fires at 3 a.m., the goal is not the permanent fix — it is a correct classification, so that the permanent fix lands in the right place the next morning. This sequence gets there without guesswork.
- Read the scope from the exception text. Query, user, or total: that single word decides which of the three permanent fixes above applies.
- Recover the offending query. Filter
system.query_logon the exception type andexception_code241 for the incident window, then readquery_id,memory_usage, anduser. - Compare server usage against the ceiling.
MemoryTrackinginsystem.metricsversusmax_server_memory_usageseparates one bad query from a cluster that is simply full. - Confirm that spilling was even available. Check the effective
max_bytes_before_external_group_byandmax_bytes_before_external_sortvalues insystem.settings; zeroes here explain a large share of ClickHouse memory limit exceeded reports. - Shrink the state, not the limit. Add filters or PREWHERE, reduce grouping cardinality, swap exact distincts for approximate aggregates, or reverse the join operands.
- Change caps last, and in layers. Only once the state is bounded should per-query, per-user, and server limits be re-tuned together.
Verifying That a ClickHouse Memory Limit Exceeded Fix Actually Held
A remediation is only real when it survives the next doubling of data. Four checks, run a week after the change, separate a genuine fix from a postponed incident.
- The daily count of code-241 exceptions for the affected user or profile is zero, not merely lower than last week.
- Peak
memory_usagefor the query shape has a flat or falling trend line, which is what proves the state is bounded rather than just under the cap today. - Server-level
MemoryTrackingpeaks did not rise to absorb the change — if they did, the ClickHouse memory limit exceeded failure has moved from the query scope to the server scope. - Wall-clock latency for the shape stayed inside its SLO, confirming that spilling to disk was a trade you could afford.
Key Takeaways
- Every ClickHouse memory limit exceeded error names its scope — query, user, or server total; each scope has a different correct fix, and raising
max_memory_usageis rarely it. - Pull failed-query evidence from
system.query_log(ExceptionWhileProcessing,exception_code = 241) including peakmemory_usageand spill counters. - Enable external GROUP BY/SORT at roughly half the per-query cap so heavy queries degrade to disk instead of failing; provision fast temp storage for it.
- On clusters,
distributed_aggregation_memory_efficient = 1and sharding-key-aligned GROUP BYs keep the initiator out of memory trouble. - For RAM-exceeding JOINs: shrink the right side first, then grace hash join (22.12+), partial-merge, or dictionaries for hot dimensions.
- Layer limits by workload class — small caps for interactive, large-with-spill for batch — with a server ceiling protecting the OS; overcommit (22.x+) is the last resort, not the design.
FAQ
How do I fix “Memory limit exceeded” in ClickHouse?
First identify which limit fired from the error text (query, user, or total). For per-query failures on GROUP BY/ORDER BY, enable max_bytes_before_external_group_by and max_bytes_before_external_sort at about half the cap; for JOINs, shrink the right side or switch join_algorithm; raise caps only after spilling is in place.
What is max_memory_usage in ClickHouse?
The per-query memory cap in bytes, enforced by the query memory tracker. It layers with max_memory_usage_for_user (all of a user’s concurrent queries) and max_server_memory_usage / max_server_memory_usage_to_ram_ratio (whole server).
Why does ClickHouse run out of memory on GROUP BY?
Aggregation state is held in an in-RAM hash table sized by key cardinality times state size. High-cardinality keys exceed the cap unless external aggregation is enabled, cardinality is reduced, or (on clusters) aggregation is pushed down to shards.
Does ClickHouse spill to disk automatically?
Not by default for classic aggregation and sorting in most deployed versions — spilling activates only when the max_bytes_before_external_* thresholds are set. Defaults vary across versions and distributions, so verify effective values in system.settings on your build.
Does raising max_memory_usage fix ClickHouse memory limit exceeded?
Rarely, and never durably. A higher cap buys the same query more headroom until data growth catches up, and it converts a contained per-query failure into a server-wide outage. Bound the state first, then size the caps around it.
How do I find the query that caused ClickHouse memory limit exceeded?
Query system.query_log over the incident window for exception code 241 and read query_id, memory_usage, user, and the normalised query hash. Grouping by that hash shows whether one query shape or one tenant is responsible.
What is the difference between max_memory_usage and max_server_memory_usage?
The first caps a single query; the second caps everything the server tracks, including caches, dictionaries, and background merges. They fail with different messages and call for different remedies, which is why reading the scope in the error text matters.
Does external aggregation slow queries down?
It adds disk I/O only when the in-memory threshold is actually crossed, so well-behaved queries are unaffected. A slightly slower query that returns results is a better outcome than a fast one that throws code 241.
If code-241 pages are part of your on-call rotation, ChistaDATA’s ClickHouse Performance Consulting and 24x7x365 Support engineers this limit architecture, validates it against your workload, and stands behind it with a 15-minute S1 response SLA — on 100% open-source ClickHouse, zero vendor lock-in. Contact ChistaDATA.
Running ClickHouse in production? ChistaDATA provides ClickHouse consulting for architecture, performance and migrations, and 24×7 ClickHouse support with a 15-minute S1 response. For day-to-day operations see ClickHouse DBA services and ClickHouse managed services.
