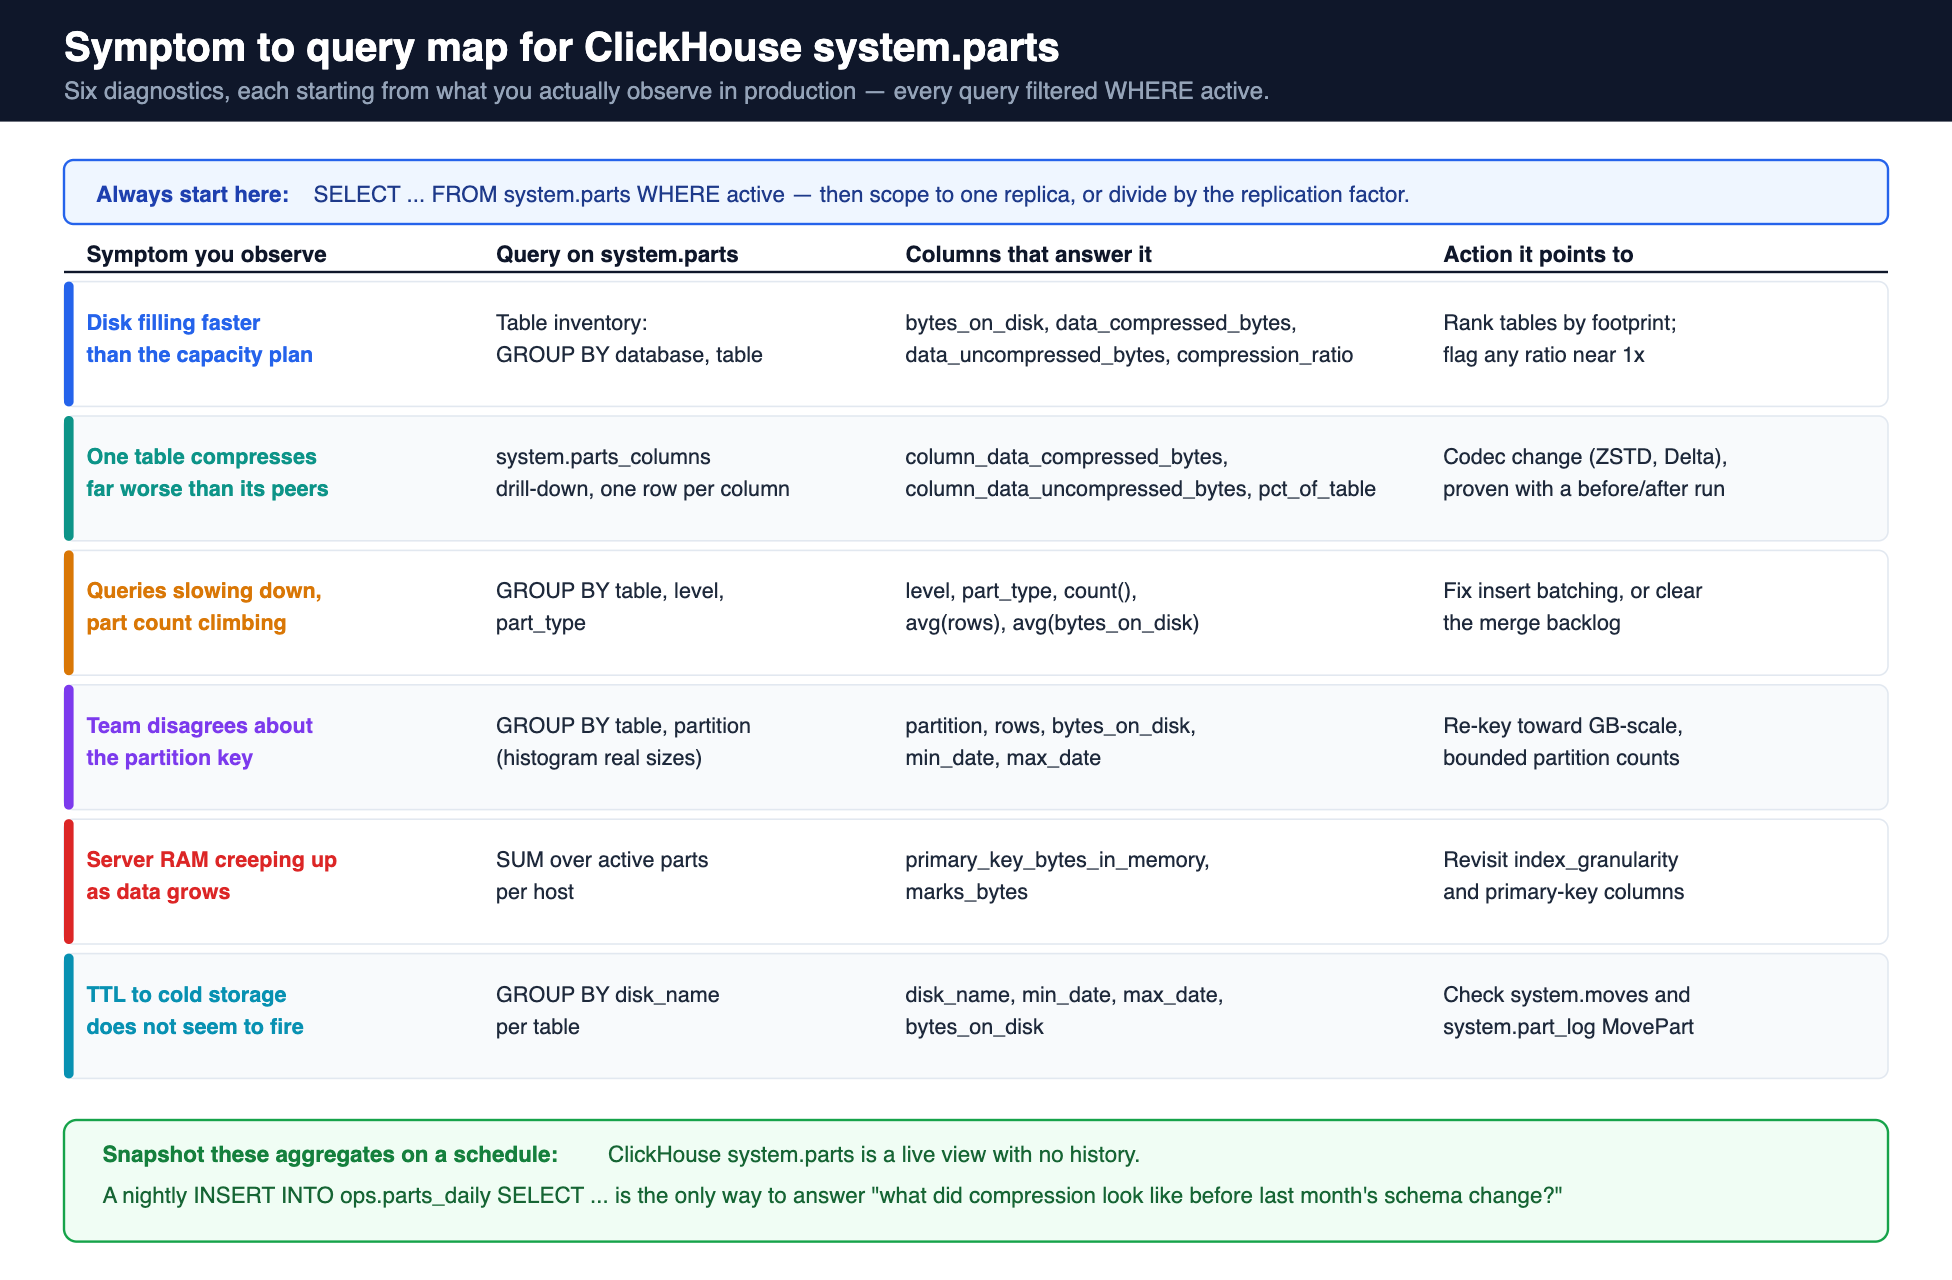
If system.query_log is where ClickHouse performance investigations start, system.parts is where storage investigations start — and half of the query-side problems trace back here anyway. The ClickHouse system.parts table describes every data part of every MergeTree table: its size compressed and uncompressed, row count, partition, merge level, storage format, primary-index memory footprint, and lifecycle state. This post is a working query cookbook — the six ClickHouse system.parts queries we run in nearly every ChistaDATA health check, each with the interpretation that turns numbers into decisions about compression, partition sizing, part health, and capacity. Five diagrams along the way map the ClickHouse system.parts columns, part states, and failure signatures those queries expose.
Ground Rules for Querying ClickHouse system.parts Correctly
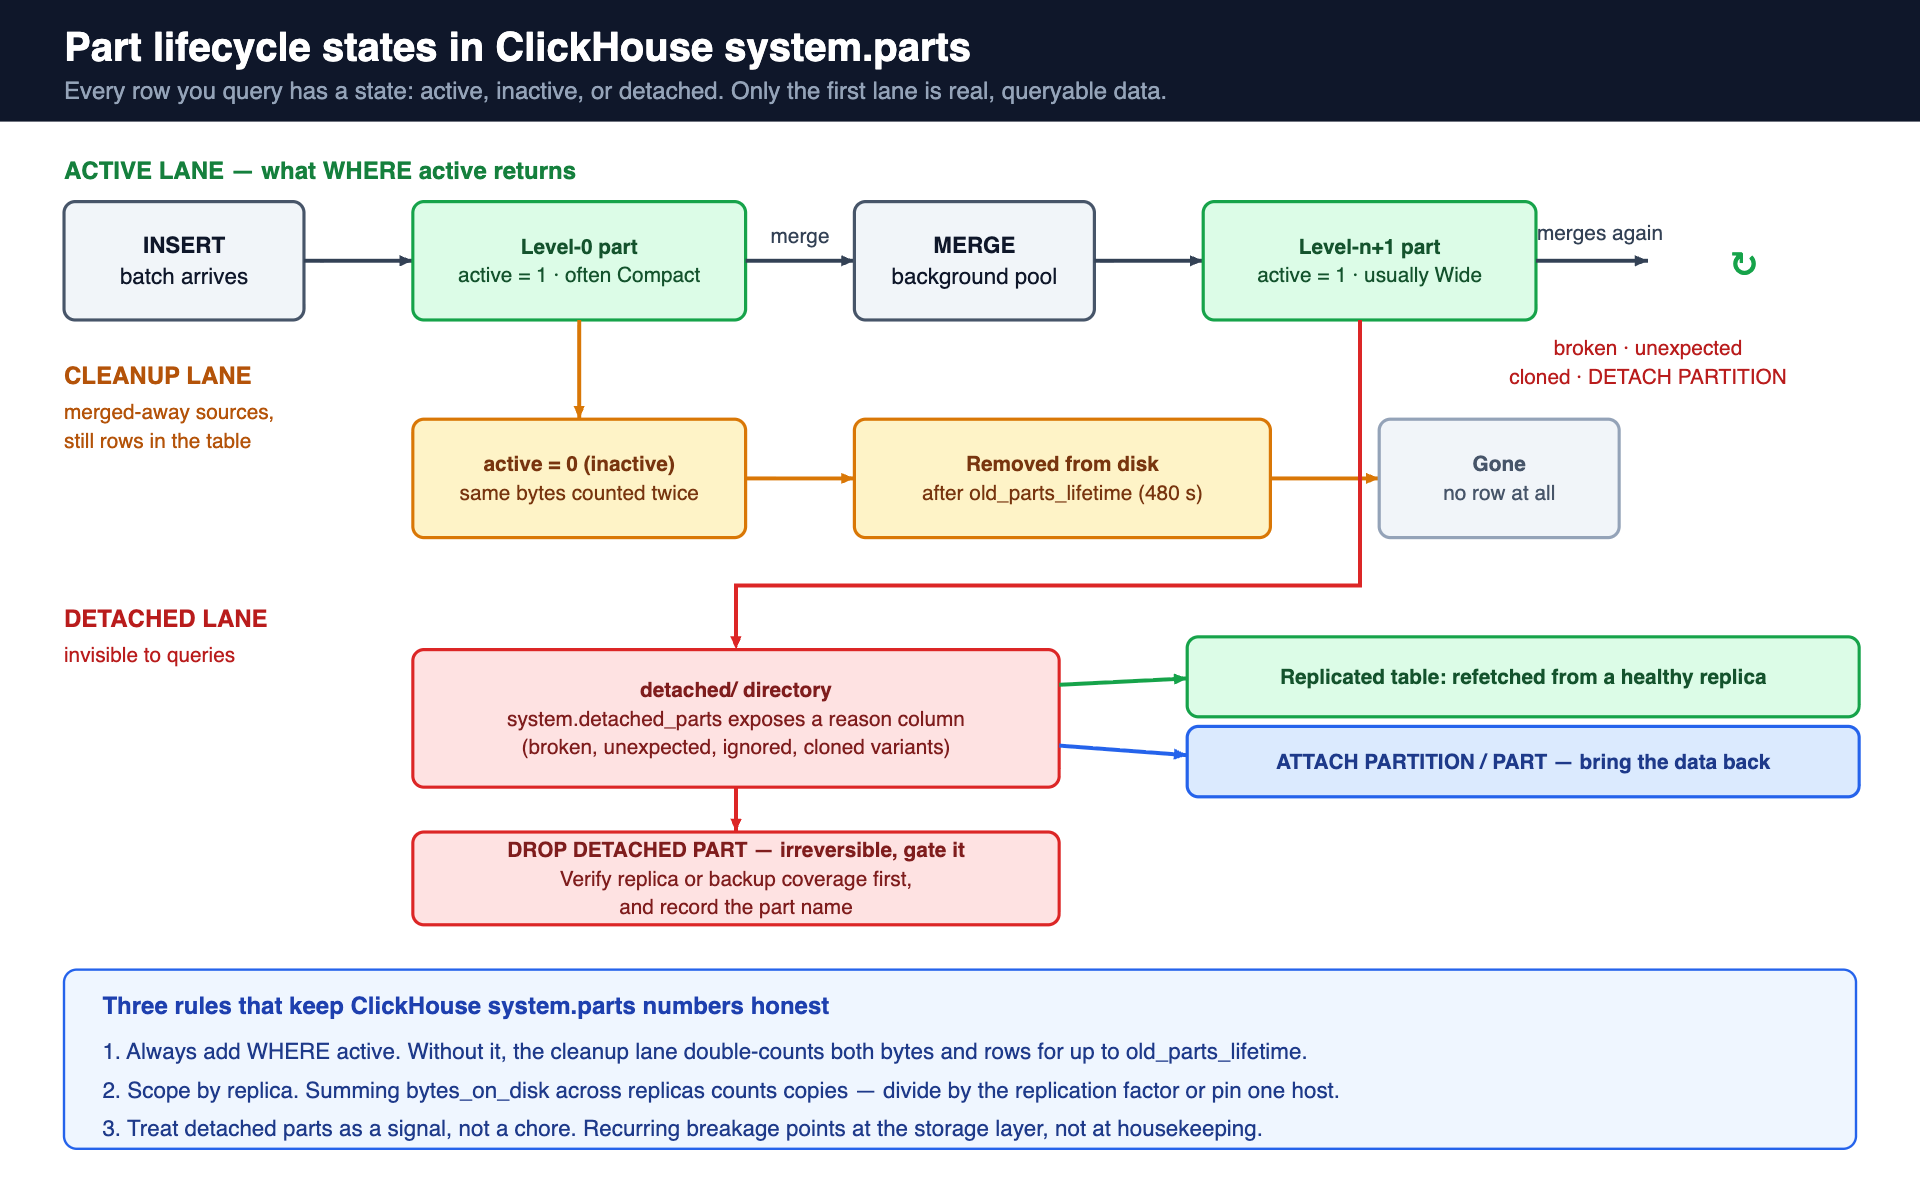
Two mistakes corrupt most ad hoc part analysis. First, forgetting WHERE active: inactive rows are parts already merged into larger ones (awaiting cleanup after old_parts_lifetime, 480 s by default) and double-count both bytes and rows. Second, summing bytes_on_disk across replicas through a distributed query and calling it dataset size — replicas hold copies, so cluster-wide sums need dividing by replication factor or scoping to one replica. With those fixed, start from the table-level inventory:
SELECT
    database,
    table,
    count()                                          AS active_parts,
    sum(rows)                                        AS total_rows,
    formatReadableSize(sum(bytes_on_disk))           AS bytes_on_disk,
    formatReadableSize(sum(data_compressed_bytes))   AS compressed,
    formatReadableSize(sum(data_uncompressed_bytes)) AS uncompressed,
    round(sum(data_uncompressed_bytes)
        / sum(data_compressed_bytes), 2)             AS compression_ratio
FROM system.parts
WHERE active
GROUP BY database, table
ORDER BY sum(bytes_on_disk) DESC
LIMIT 20;
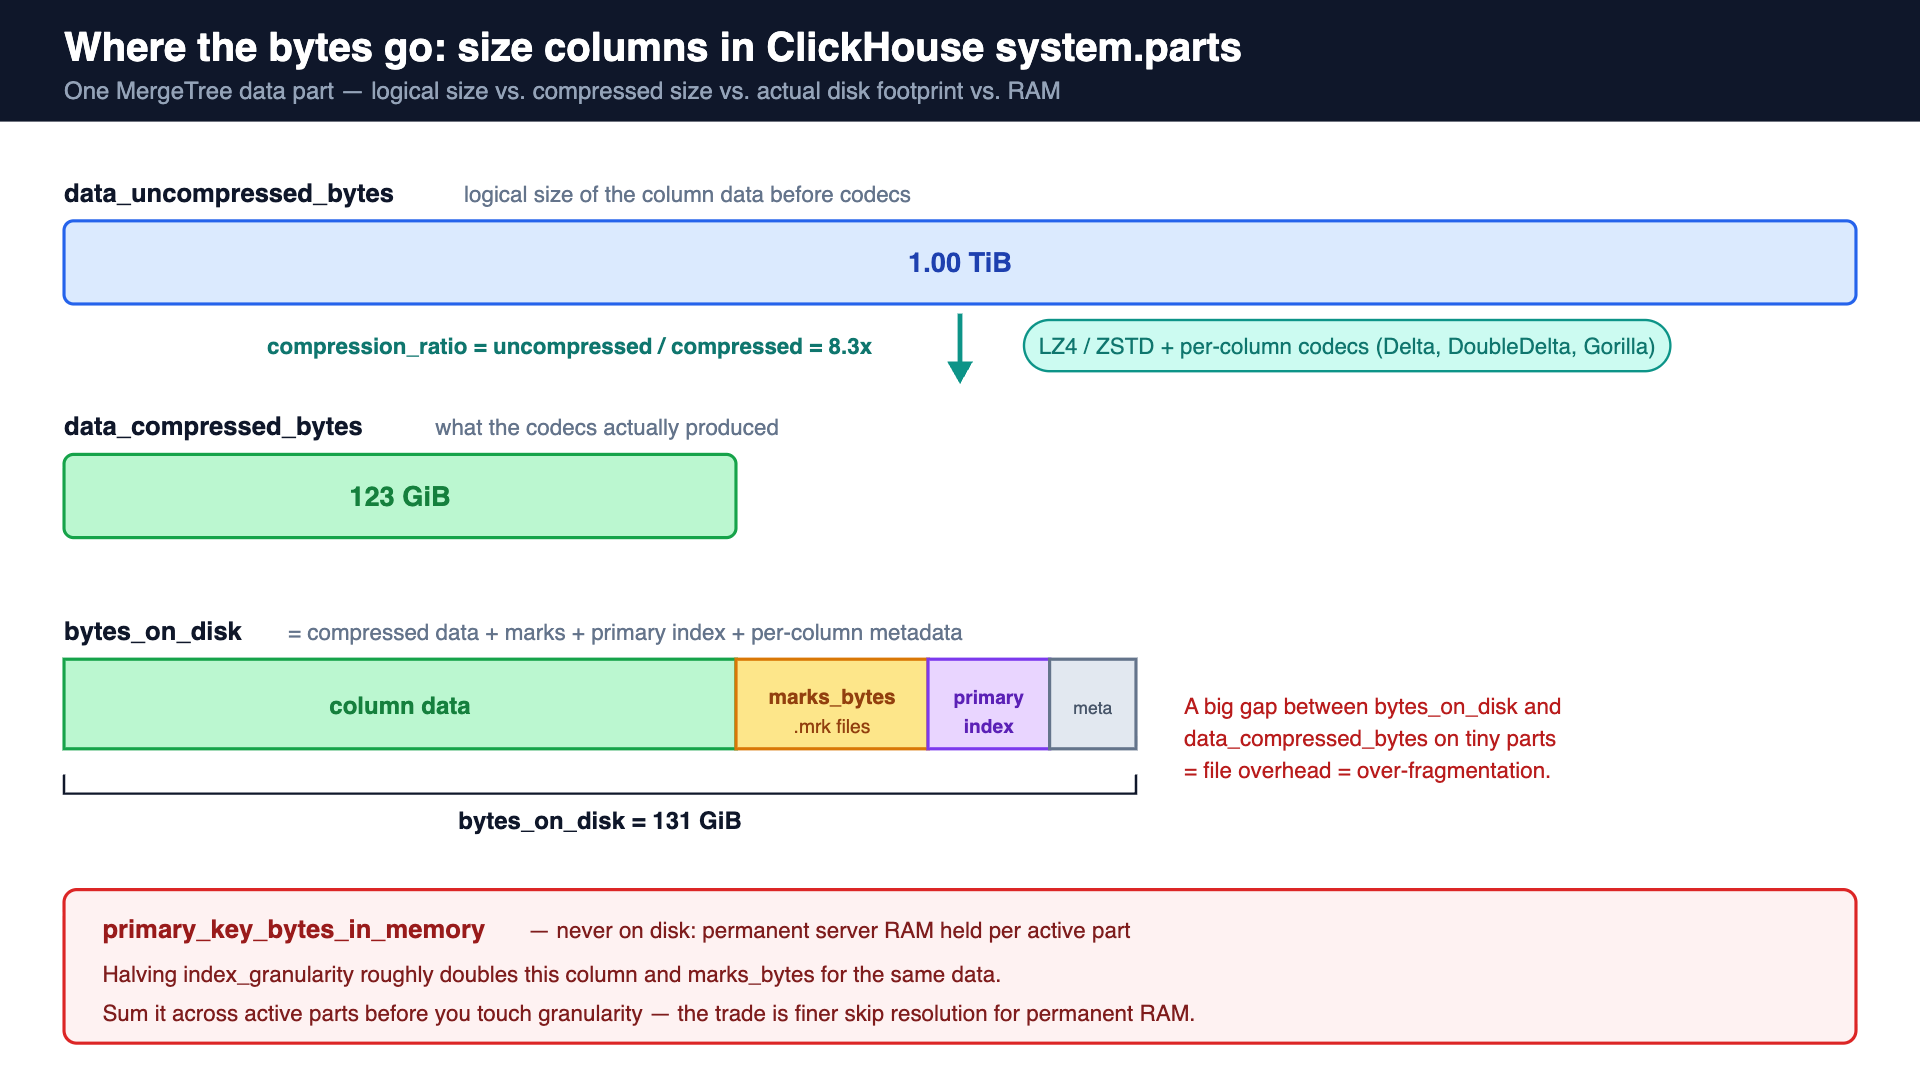
Interpretation: compression_ratio for typical analytical event data lands anywhere from ~3× to well past 10× depending on sort-key locality and codecs. A ratio near 1× on a large table is a red flag worth chasing — usually incompressible data (already-compressed blobs, random UUIDs early in the sort key destroying locality) or a column that belongs in a specialized codec. Note bytes_on_disk exceeds data_compressed_bytes by the size of marks, the primary index, and per-column metadata; a large gap on tiny parts is pure file overhead, another symptom of over-fragmentation.
One more habit worth building: snapshot these aggregates into a small ops table on a schedule (a nightly INSERT INTO ops.parts_daily SELECT ... materializing the query above). ClickHouse system.parts is a live view with no history — the moment you need “what did compression look like before last month’s schema change,” only your own snapshots can answer, and the storage cost of keeping them is trivially small next to their diagnostic value.
Part Health: Fragmentation, Levels, and Format
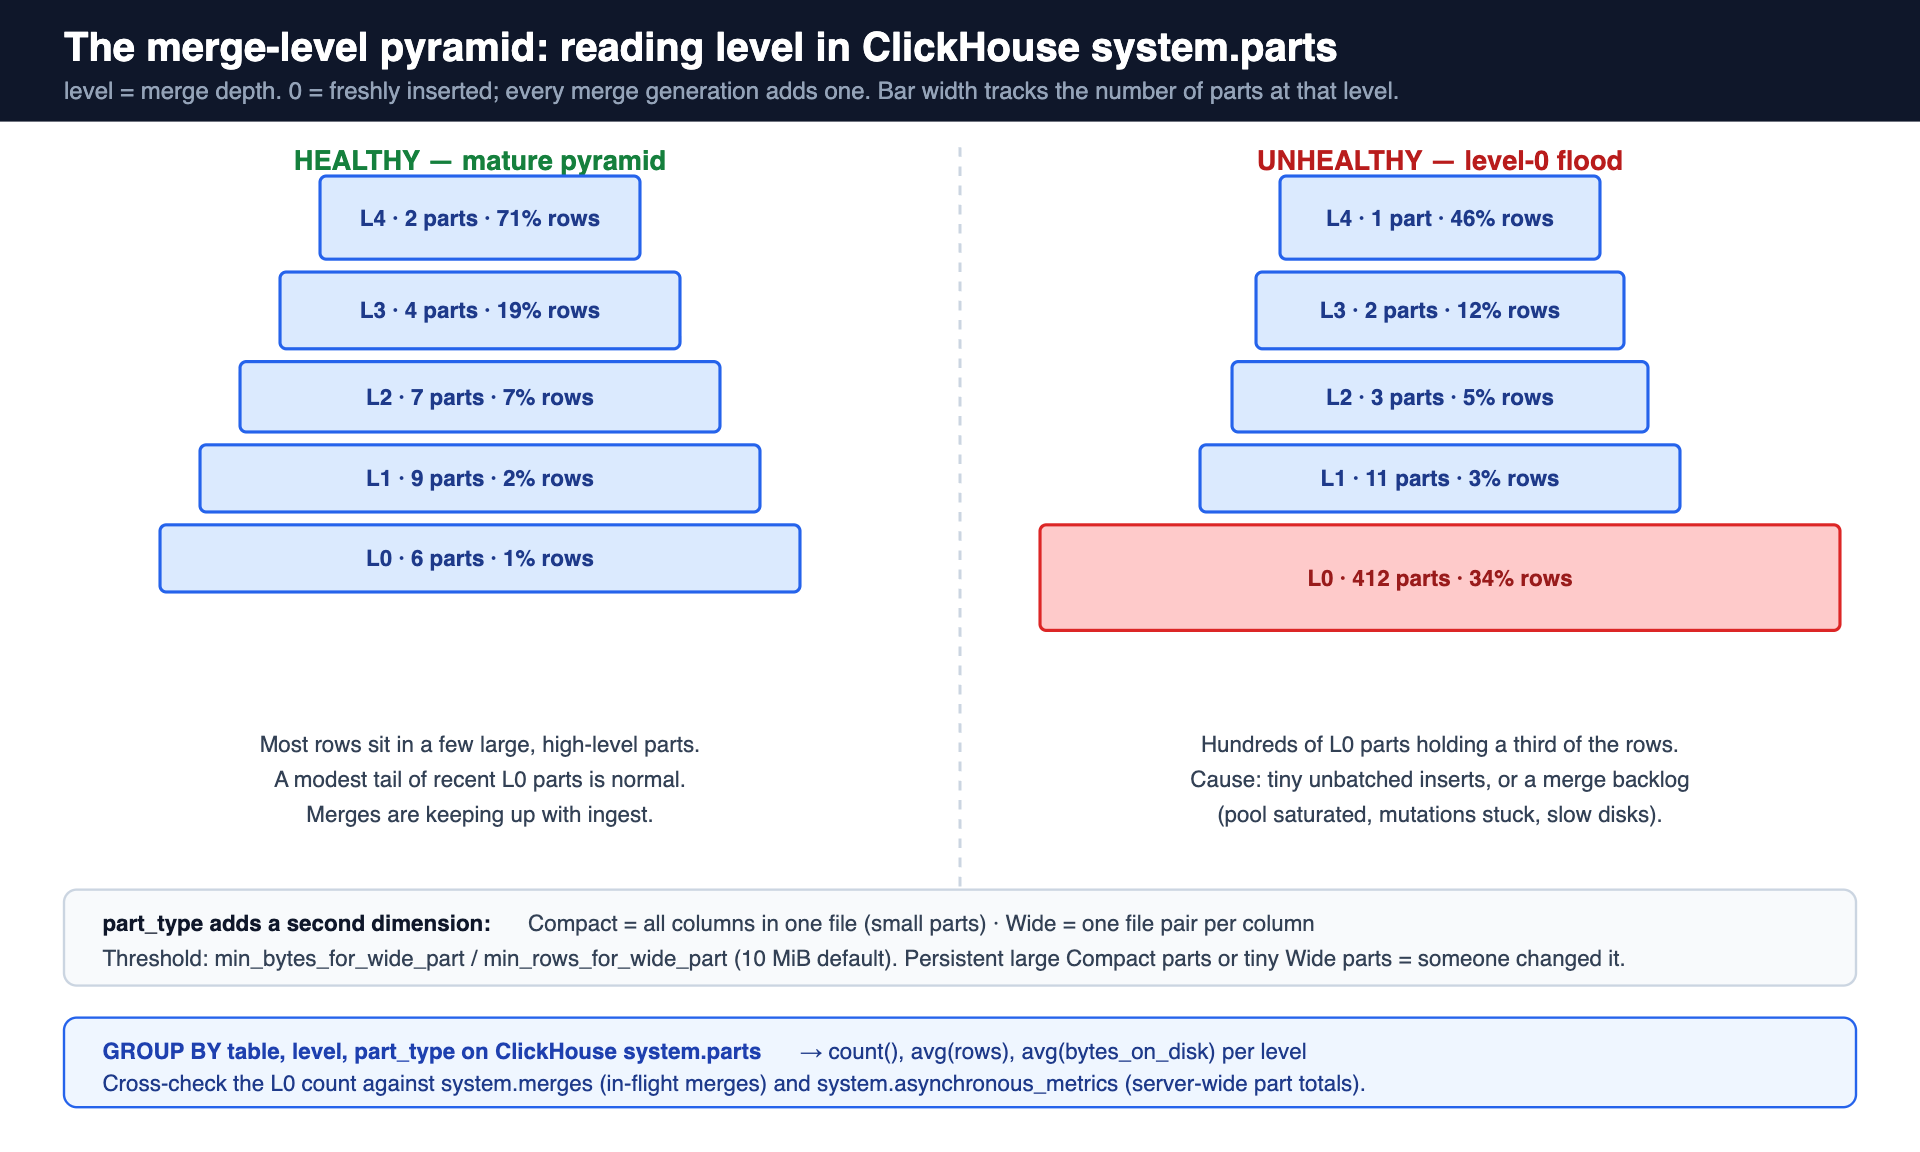
Part level records merge depth — 0 for freshly inserted parts, incrementing with each merge generation. The level distribution is a merge-health X-ray that complements system.merges directly:
SELECT
    table,
    level,
    part_type,                          -- 'Wide' or 'Compact'
    count()                             AS parts,
    round(avg(rows))                    AS avg_rows,
    formatReadableSize(avg(bytes_on_disk)) AS avg_size
FROM system.parts
WHERE active
  AND database = '${TARGET_DB}'
GROUP BY table, level, part_type
ORDER BY table, level;
A healthy mature table shows a pyramid: a few large high-level parts holding most rows, a modest tail of recent low-level parts. Hundreds of level-0 parts is an insert-batching or merge-backlog problem (covered in our too-many-parts and slow-merges guide, with the write path itself in our ingestion and batch-sizing guide). The part_type column adds a format dimension: Compact parts store all columns in one file and are created for small parts (below min_bytes_for_wide_part / min_rows_for_wide_part, 10 MiB by default on modern releases); Wide parts store one file pair per column. Persistent large Compact parts, or Wide parts at tiny sizes, mean someone changed those thresholds — confirm intent against system.merge_tree_settings.
Partition Sizing: The Query That Settles Design Arguments
Partition-granularity debates end quickly when ClickHouse system.parts data settles them — histogram actual partition sizes:
SELECT
    table,
    partition,
    count()                                    AS parts,
    sum(rows)                                  AS rows_in_partition,
    formatReadableSize(sum(bytes_on_disk))     AS partition_size,
    min(min_date)                              AS earliest,
    max(max_date)                              AS latest
FROM system.parts
WHERE active
  AND database = '${TARGET_DB}'
  AND table = '${TARGET_TABLE}'
GROUP BY table, partition
ORDER BY partition DESC
LIMIT 24;
The working heuristics we apply: partitions in the single-digit-GB to low-hundreds-of-GB range are comfortable; thousands of partitions of a few MB each mean the partition key is too fine (each carries part overhead, and inserts scatter across them); a handful of multi-TB partitions mean TTL drops and merges operate in painfully large units. Partition count times parts-per-partition is your file-count budget — system.asynchronous_metrics tracks total parts server-wide, and every one costs file descriptors, mark-cache entries, and startup scan time.
Column-Level Drill-Down and Index Memory
When table-level compression looks wrong, system.parts_columns (same lifecycle rules, one row per column per part) identifies the offending column — rank columns by on-disk share and per-column compression ratio:
SELECT
    column,
    formatReadableSize(sum(column_data_compressed_bytes))    AS compressed,
    formatReadableSize(sum(column_data_uncompressed_bytes))  AS uncompressed,
    round(sum(column_data_uncompressed_bytes)
        / sum(column_data_compressed_bytes), 2)              AS col_ratio,
    round(100 * sum(column_data_compressed_bytes)
        / sum(sum(column_data_compressed_bytes)) OVER (), 1) AS pct_of_table
FROM system.parts_columns
WHERE active
  AND database = '${TARGET_DB}'
  AND table = '${TARGET_TABLE}'
GROUP BY column
ORDER BY sum(column_data_compressed_bytes) DESC
LIMIT 15;
Typical findings: one raw-payload String column carrying most of the table (candidate for a ZSTD codec, extraction of hot fields, or TTL to cold storage), or a timestamp column compressing poorly because it lacks DoubleDelta/Delta codecs. Validate any codec change with ALTER TABLE ... MODIFY COLUMN on staging plus a before/after run of this exact query — the measurement is the acceptance test. Two memory columns complete the picture: primary_key_bytes_in_memory (summed per server, this is RAM permanently spent on primary indexes — inflated by needlessly fine index_granularity or bloated key columns) and marks_bytes, which sizes the mark files competing for the mark cache.
Granularity ties these memory numbers to schema decisions: halving index_granularity roughly doubles both primary_key_bytes_in_memory and marks_bytes for the same data, buying finer skip resolution at permanent RAM cost. Make that trade from measurement — run the sums before and after on a staging copy — and note that projections materialize as parts too: system.projection_parts mirrors this table’s columns per projection, and a table whose projections rival the base table in bytes has a design conversation pending, not a storage anomaly.
On clusters, run any of these queries fleet-wide with clusterAllReplicas('${CLUSTER}', system.parts) and group by hostName(): replicas of the same table should report near-identical active byte and row totals, and divergence beyond merge-timing noise means replication lag or lost parts — cross-check system.replicas before it becomes a query-correctness ticket.
Lifecycle States and Detached Parts
Beyond active/inactive, parts can be detached — sitting in the detached/ directory, invisible to queries, listed in system.detached_parts with a reason column (broken, unexpected, ignored, cloned variants). Non-empty detached listings deserve investigation, not reflexive cleanup: broken parts on a replicated table are usually refetched from healthy replicas automatically, but recurring breakage points at storage-layer corruption. Verify replica coverage of the data before removing anything, and gate any ALTER TABLE ... DROP DETACHED PART behind explicit confirmation with the part name recorded — it is irreversible. Full column semantics for every field in this post are in the official ClickHouse system.parts documentation.
Capacity Forecasting and Tiered Storage from Part Metadata
Because parts carry partition identity and byte counts, ClickHouse system.parts doubles as a growth ledger. For time-partitioned tables, per-partition sizes are per-period ingest volume — trend them and you have a capacity forecast grounded in actual compressed bytes rather than estimated raw data:
SELECT
    partition                                       AS period,
    formatReadableSize(sum(bytes_on_disk))          AS stored,
    sum(rows)                                       AS rows,
    round(sum(bytes_on_disk) / sum(rows), 1)        AS bytes_per_row
FROM system.parts
WHERE active
  AND database = '${TARGET_DB}'
  AND table = '${TARGET_TABLE}'
GROUP BY partition
ORDER BY partition DESC
LIMIT 12;
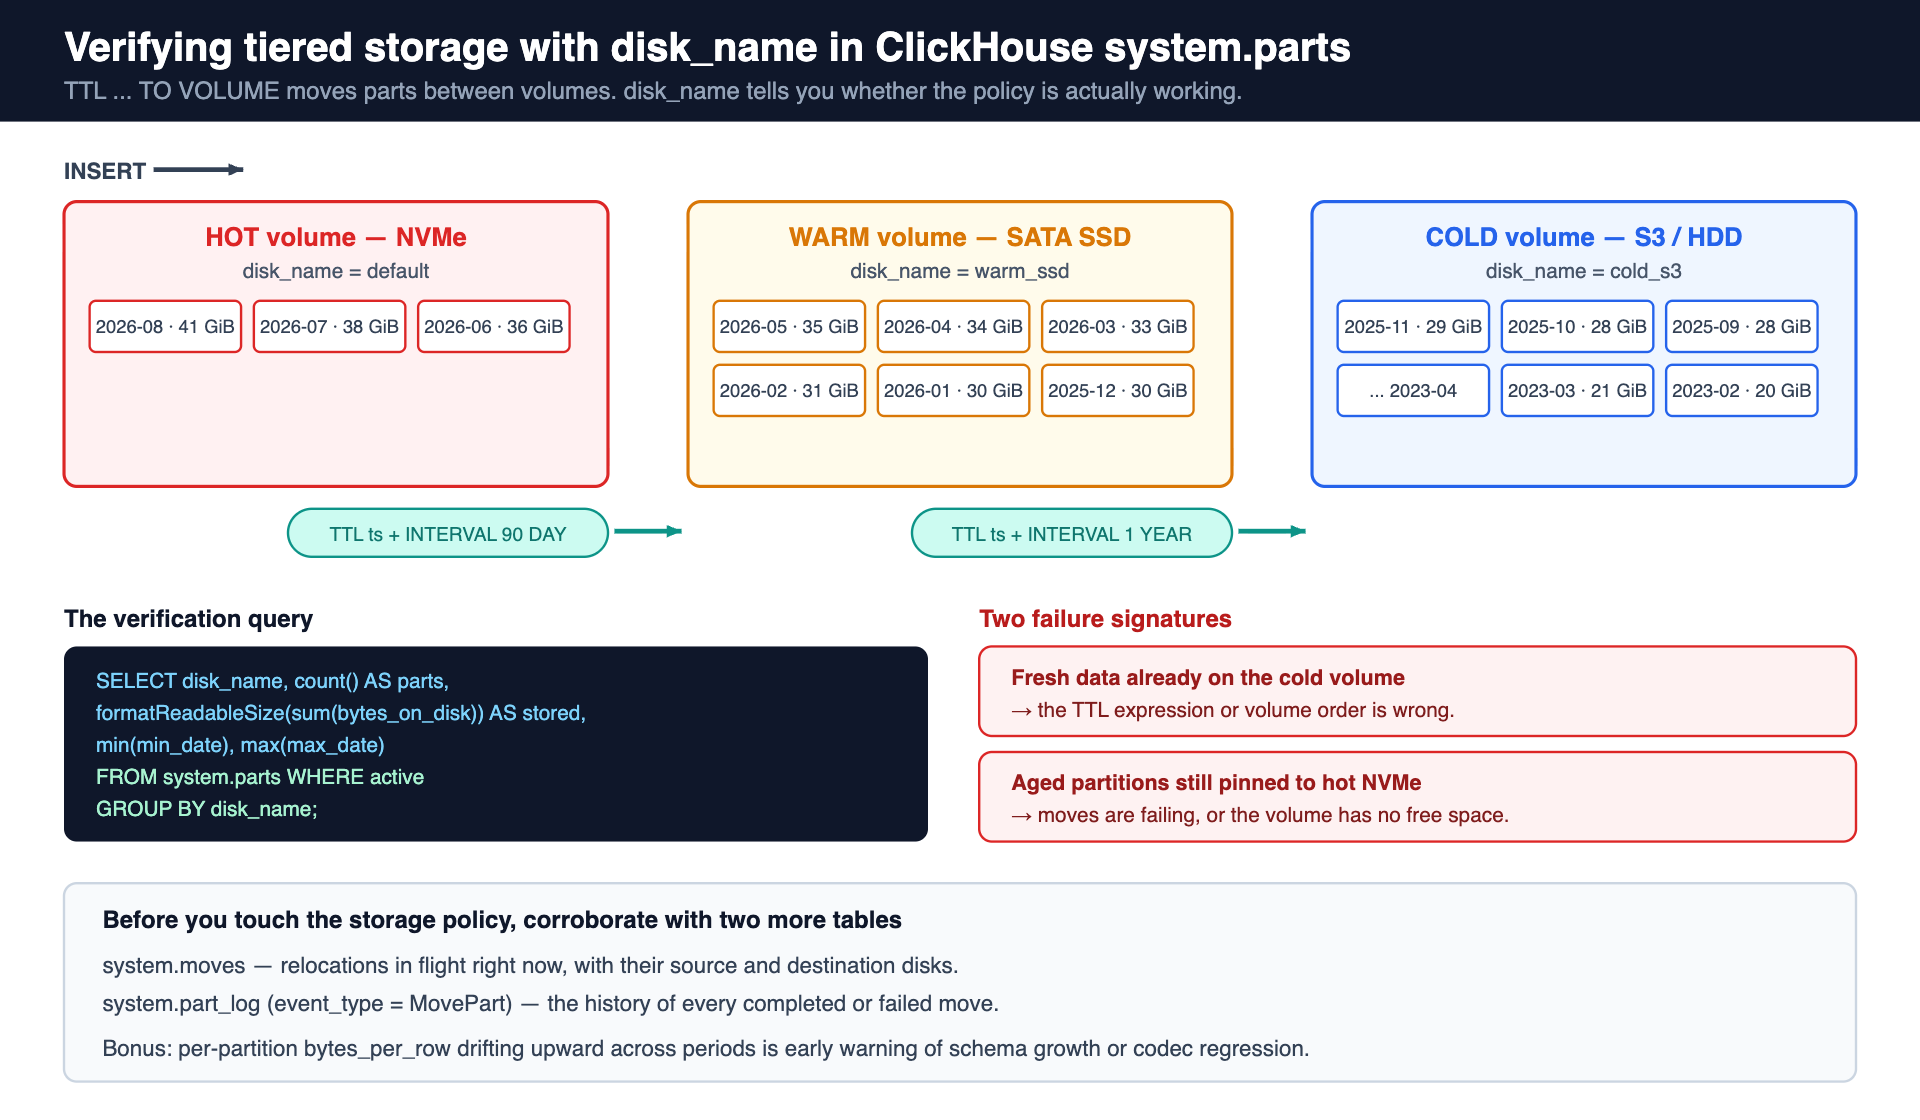
bytes_per_row drifting upward across periods is an early-warning metric almost nobody tracks: it means schema growth, codec regression, or sort-key locality decay — each cheaper to fix when caught within a month than after a year of accumulation. On tiered-storage deployments, the disk_name column shows where each part physically lives, which validates whether TTL ... TO VOLUME policies actually move data on schedule:
SELECT
    disk_name,
    count()                                     AS parts,
    formatReadableSize(sum(bytes_on_disk))      AS stored,
    min(min_date)                               AS oldest_data,
    max(max_date)                               AS newest_data
FROM system.parts
WHERE active
  AND database = '${TARGET_DB}'
  AND table = '${TARGET_TABLE}'
GROUP BY disk_name;
Fresh data appearing on the cold volume, or aged partitions stuck on hot NVMe, means the move policy is misconfigured or moves are failing — cross-check system.moves for in-flight relocations and system.part_log MovePart events for history before touching the storage policy itself.
Column Groups Cheat Sheet
| ClickHouse system.parts column group | What they diagnose | Healthy signal |
|---|---|---|
data_compressed_bytes / data_uncompressed_bytes | Compression effectiveness, codec candidates | Ratio ≥ ~3× for typical event data; investigate near-1× outliers |
rows, level, part_type | Insert batching quality and merge progress | Pyramid level distribution; few level-0 parts at steady state |
partition, min_date / max_date | Partition-key granularity and TTL behavior | GB-scale partitions; bounded partition count |
primary_key_bytes_in_memory, marks_bytes | Index RAM and mark-cache pressure | Stable share of server RAM as data grows |
modification_time, active | Merge recency and cleanup lag | Inactive parts disappearing within old_parts_lifetime |
system.detached_parts.reason | Corruption and replication anomalies | Empty, or explained and resolved entries |
Key Takeaways
- Every ClickHouse system.parts analysis starts the same way: filter
WHERE activeand scope replica-aware; those two habits separate valid part analysis from double-counted noise. - Table-level compression ratio flags problems;
system.parts_columnsattributes them to specific columns and turns codec work into a measured before/after. - The
leveldistribution is a merge-health X-ray: pyramids are healthy, level-0 floods are batching or backlog problems. - Histogram real partition sizes before debating partition keys — GB-scale partitions and bounded partition counts are the target.
primary_key_bytes_in_memoryis permanent RAM spend; track it as data grows and before changingindex_granularity.- Detached parts get investigated and verified against replica coverage before any gated, irreversible cleanup.
FAQ
How do I check table sizes and compression in ClickHouse?
Aggregate ClickHouse system.parts with WHERE active: sum bytes_on_disk for footprint and divide data_uncompressed_bytes by data_compressed_bytes for the compression ratio, grouping by database and table. Drill into per-column detail via system.parts_columns.
What is the difference between active and inactive parts?
Active parts serve queries; inactive parts have been merged into larger parts and await deletion after old_parts_lifetime (480 s default). Counting inactive parts double-counts data, so nearly every analysis query needs WHERE active.
What does the level column in ClickHouse system.parts mean?
Merge depth: 0 for freshly inserted parts, incremented each time parts merge into a new generation. A steady-state table shows few level-0 parts and most rows in high-level parts; persistent level-0 accumulation signals under-batched inserts or merges falling behind.
Is it safe to delete detached parts in ClickHouse?
Only after diagnosis: check system.detached_parts.reason, confirm the data exists on healthy replicas (or in backups), and treat removal as an irreversible, confirmation-gated step. Recurring broken detachments indicate storage problems that deletion will not fix.
What is the difference between system.parts and system.parts_columns?
ClickHouse system.parts holds one row per data part, so it answers table-, partition-, and disk-level questions: footprint, part counts, merge levels, physical placement. system.parts_columns holds one row per column per part, which is what attributes a poor table-wide compression ratio to a specific column. The same lifecycle rules apply to both, so both need WHERE active.
Is it expensive to query ClickHouse system.parts on a busy server?
No. ClickHouse system.parts is a lightweight view over metadata the server already keeps in memory, so the aggregates in this post return in milliseconds even on instances carrying hundreds of thousands of parts. The only cost worth thinking about is running them in a tight loop across every replica of a large cluster; a scheduled snapshot every few minutes gives you the same insight for a fraction of the overhead.
Standing caveat: run codec, granularity, and cleanup changes in staging first with before/after measurement from the queries above, and maintain a robust backup/DR posture — part-level operations are exactly where restore paths earn their keep.
Turn Part Telemetry into a Storage Strategy
These ClickHouse system.parts queries are a subset of the ChistaDATA health check, where part telemetry drives codec plans, partition redesigns, and capacity forecasts on 100% open-source ClickHouse with zero vendor lock-in. Our consulting and 24x7x365 support — with a 15-minute S1 SLA — turn storage findings into staged, reversible engineering work. Book a ChistaDATA storage review and know exactly where every byte and every part stands.
