ChistaDATA · Real-time analytics · Updated September 2026
From Batch Processing to Real-Time Analytics with ClickHouse: Architecture, Migration and Proof
Moving from batch processing to real-time analytics means replacing the nightly ETL window with a tier that ingests continuously, becomes queryable in seconds and serves hundreds of concurrent users. ClickHouse was built for exactly that workload profile.
This engineering guide from ChistaDATA covers what changes when batch processing gives way to real-time analytics, the reference architecture we deploy, the MergeTree data model that keeps queries sub-second, streaming ingestion from Kafka and CDC, a six-phase reversible migration off a batch warehouse, and the system-table telemetry that proves the result. Every claim on the page maps to a mechanism you can inspect, not a slogan.
01
What changes
- Hours of freshness become seconds
- Few large loads become continuous inserts
- Tens of analysts become thousands of users
- Load windows give way to background merges
02
How it is built
- Kafka, Debezium CDC and async inserts
- Raw ReplicatedMergeTree, immutable
- Incremental materialized views to rollups
- TTL tiering to S3, Keeper for coordination
03
What is current in 2026
- Async inserts on by default since 26.3 LTS
- Lightweight UPDATE with patch parts (25.7+)
- Iceberg and Delta writes, open catalogs
- ClickHouse 26.8 LTS distributed optimizer
04
How it is proven
- End-to-end freshness in seconds
- p95 and p99 from system.query_log
- Parts and merge backlog from system.parts
- Parity checks against the old warehouse
The shift
Batch processing vs real-time analytics: what actually changes
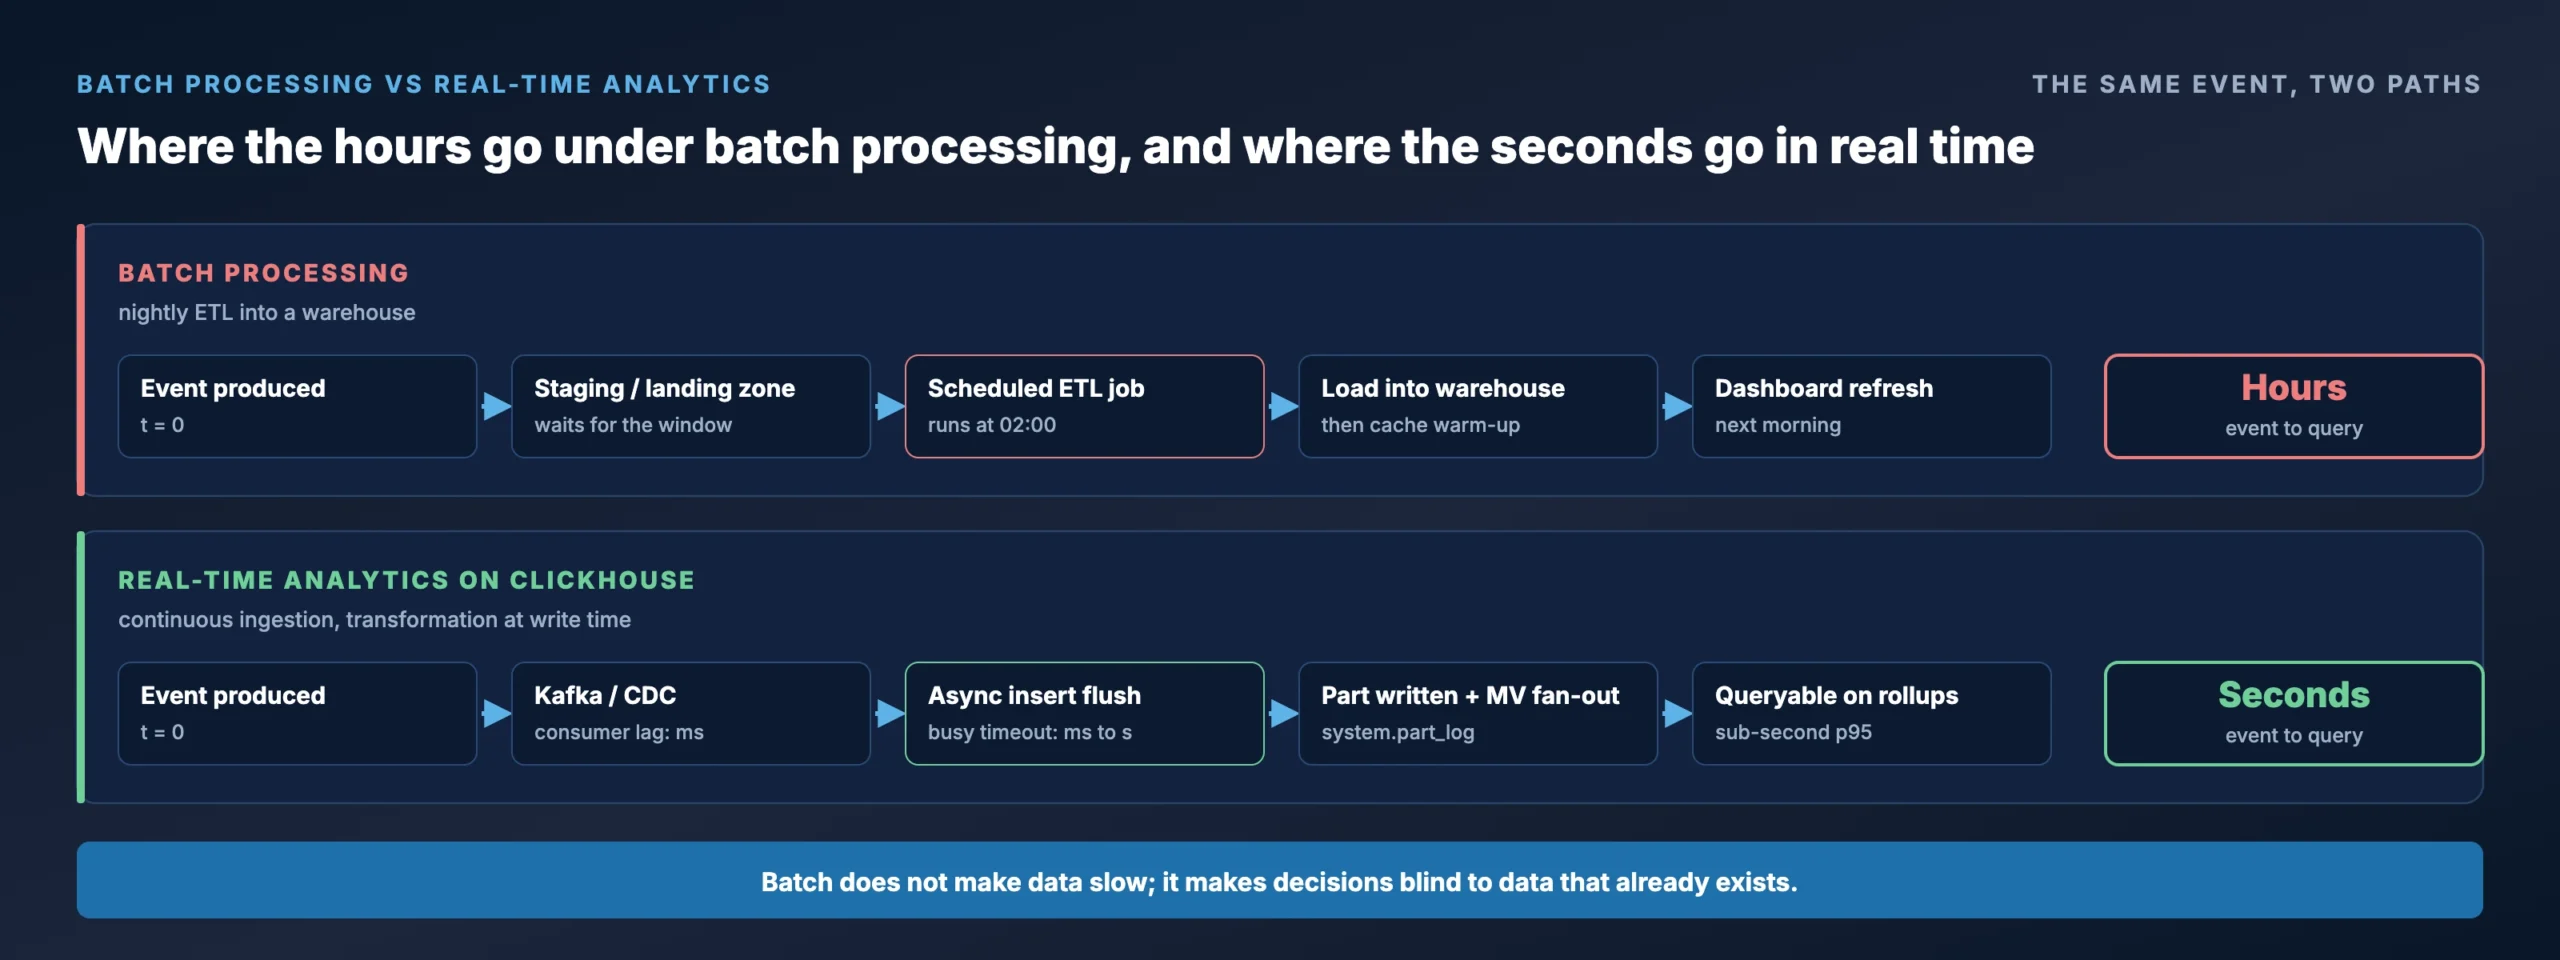
Batch processing collects data over a window, hourly, nightly or weekly, then transforms and loads it in scheduled jobs. The design optimises throughput per job, not time to insight. Every downstream consumer, from fraud rules to executive dashboards, inherits the schedule’s latency.
Real-time analytics inverts the contract. Events are ingested continuously, become queryable within seconds, and are served to many concurrent users and applications against a data set that is always current. The workload profile differs in every dimension: many small inserts instead of a few large loads, continuous background merging instead of a maintenance window, and interactive concurrency instead of a handful of long reports.
The engine therefore has to be built for that profile. Bolting streaming onto a batch warehouse produces micro-batches with warehouse-scale cost and warehouse-scale latency. ClickHouse was designed from the start for continuous ingestion and sub-second aggregation over columnar data, which is why it has become the default open-source engine when teams move from batch processing to real-time analytics.
| Dimension | Batch warehouse | Real-time analytics on ClickHouse |
|---|---|---|
| Data freshness | Hours to a day | Seconds |
| Ingestion pattern | Few large loads | Continuous streams and server-side batched inserts |
| Query concurrency | Tens of analysts | Hundreds to thousands of users and APIs |
| Typical p95 latency | Seconds to minutes | Sub-second on pre-aggregated paths |
| Cost driver | Compute reserved for load windows | Compression ratio and merge efficiency |
| Failure surface | Missed load window | Consumer lag, merge backlog, replication lag |
The problem
Where batch processing architectures break down
None of these are performance bugs. They are consequences of a design that assumed data could wait.
Latency is a blind spot, not a delay
A fraud rule that runs on last night’s data cannot stop this morning’s transaction. An SRE dashboard refreshed hourly hides a ten-minute outage. The cost of batch processing is every decision made without data that already existed.
Concurrency was never in the design
Batch warehouses assume a small number of heavy queries. Exposing them to customer-facing dashboards or product analytics creates queue depth, admission-control throttling and unpredictable p99 latency.
Streaming sources arrive anyway
Kafka topics, CDC from PostgreSQL and MySQL, clickstreams and telemetry are already continuous. Forcing them into hourly loads adds staging layers, duplicate handling and late-arrival logic that the analytics engine should own natively.
Cost scales with the wrong variable
Reserved compute sized for the nightly peak sits idle the rest of the day. Real-time engines spread work continuously and win on compression, so cost tracks data volume rather than load-window size.
The engine
Why ClickHouse is the engine for real-time analytics
ClickHouse’s advantage is not one feature but four properties that a batch-to-real-time migration needs at the same time. Each maps to a mechanism you can inspect in system.* tables.
1. Query performance at scale
Columnar storage in the MergeTree family, a sparse primary index with configurable granularity, vectorized execution and codec-level compression (LZ4, ZSTD, Delta, DoubleDelta, Gorilla) let aggregations scan billions of rows with a fraction of the I/O. We explain the execution model in ClickHouse vectorized query processing and the storage side in columnar vs row-based databases, measured on 1 billion rows.
2. Native streaming ingestion
The Kafka table engine, the official ClickHouse Kafka Connect sink with exactly-once delivery, asynchronous inserts (on by default since 26.3 LTS) and Debezium-based CDC deliver rows to MergeTree parts continuously, without an external micro-batch scheduler.
3. High concurrency for interactive applications
Incremental materialized views, projections, the query cache, workload-scoped settings profiles and, since 26.8 LTS, a cost-based distributed optimizer keep p95 predictable when hundreds of dashboards hit the same tables.
4. Open ecosystem, open licence
Apache 2.0 licensed, deployable on bare metal, Kubernetes or any cloud, with S3 tiering for cold data, Apache Iceberg and Delta Lake reads and writes for the lakehouse, and first-class drivers for Grafana, Superset, Metabase and every major language.
Reference architecture
Ingest, transform, serve: the real-time analytics pipeline on ClickHouse
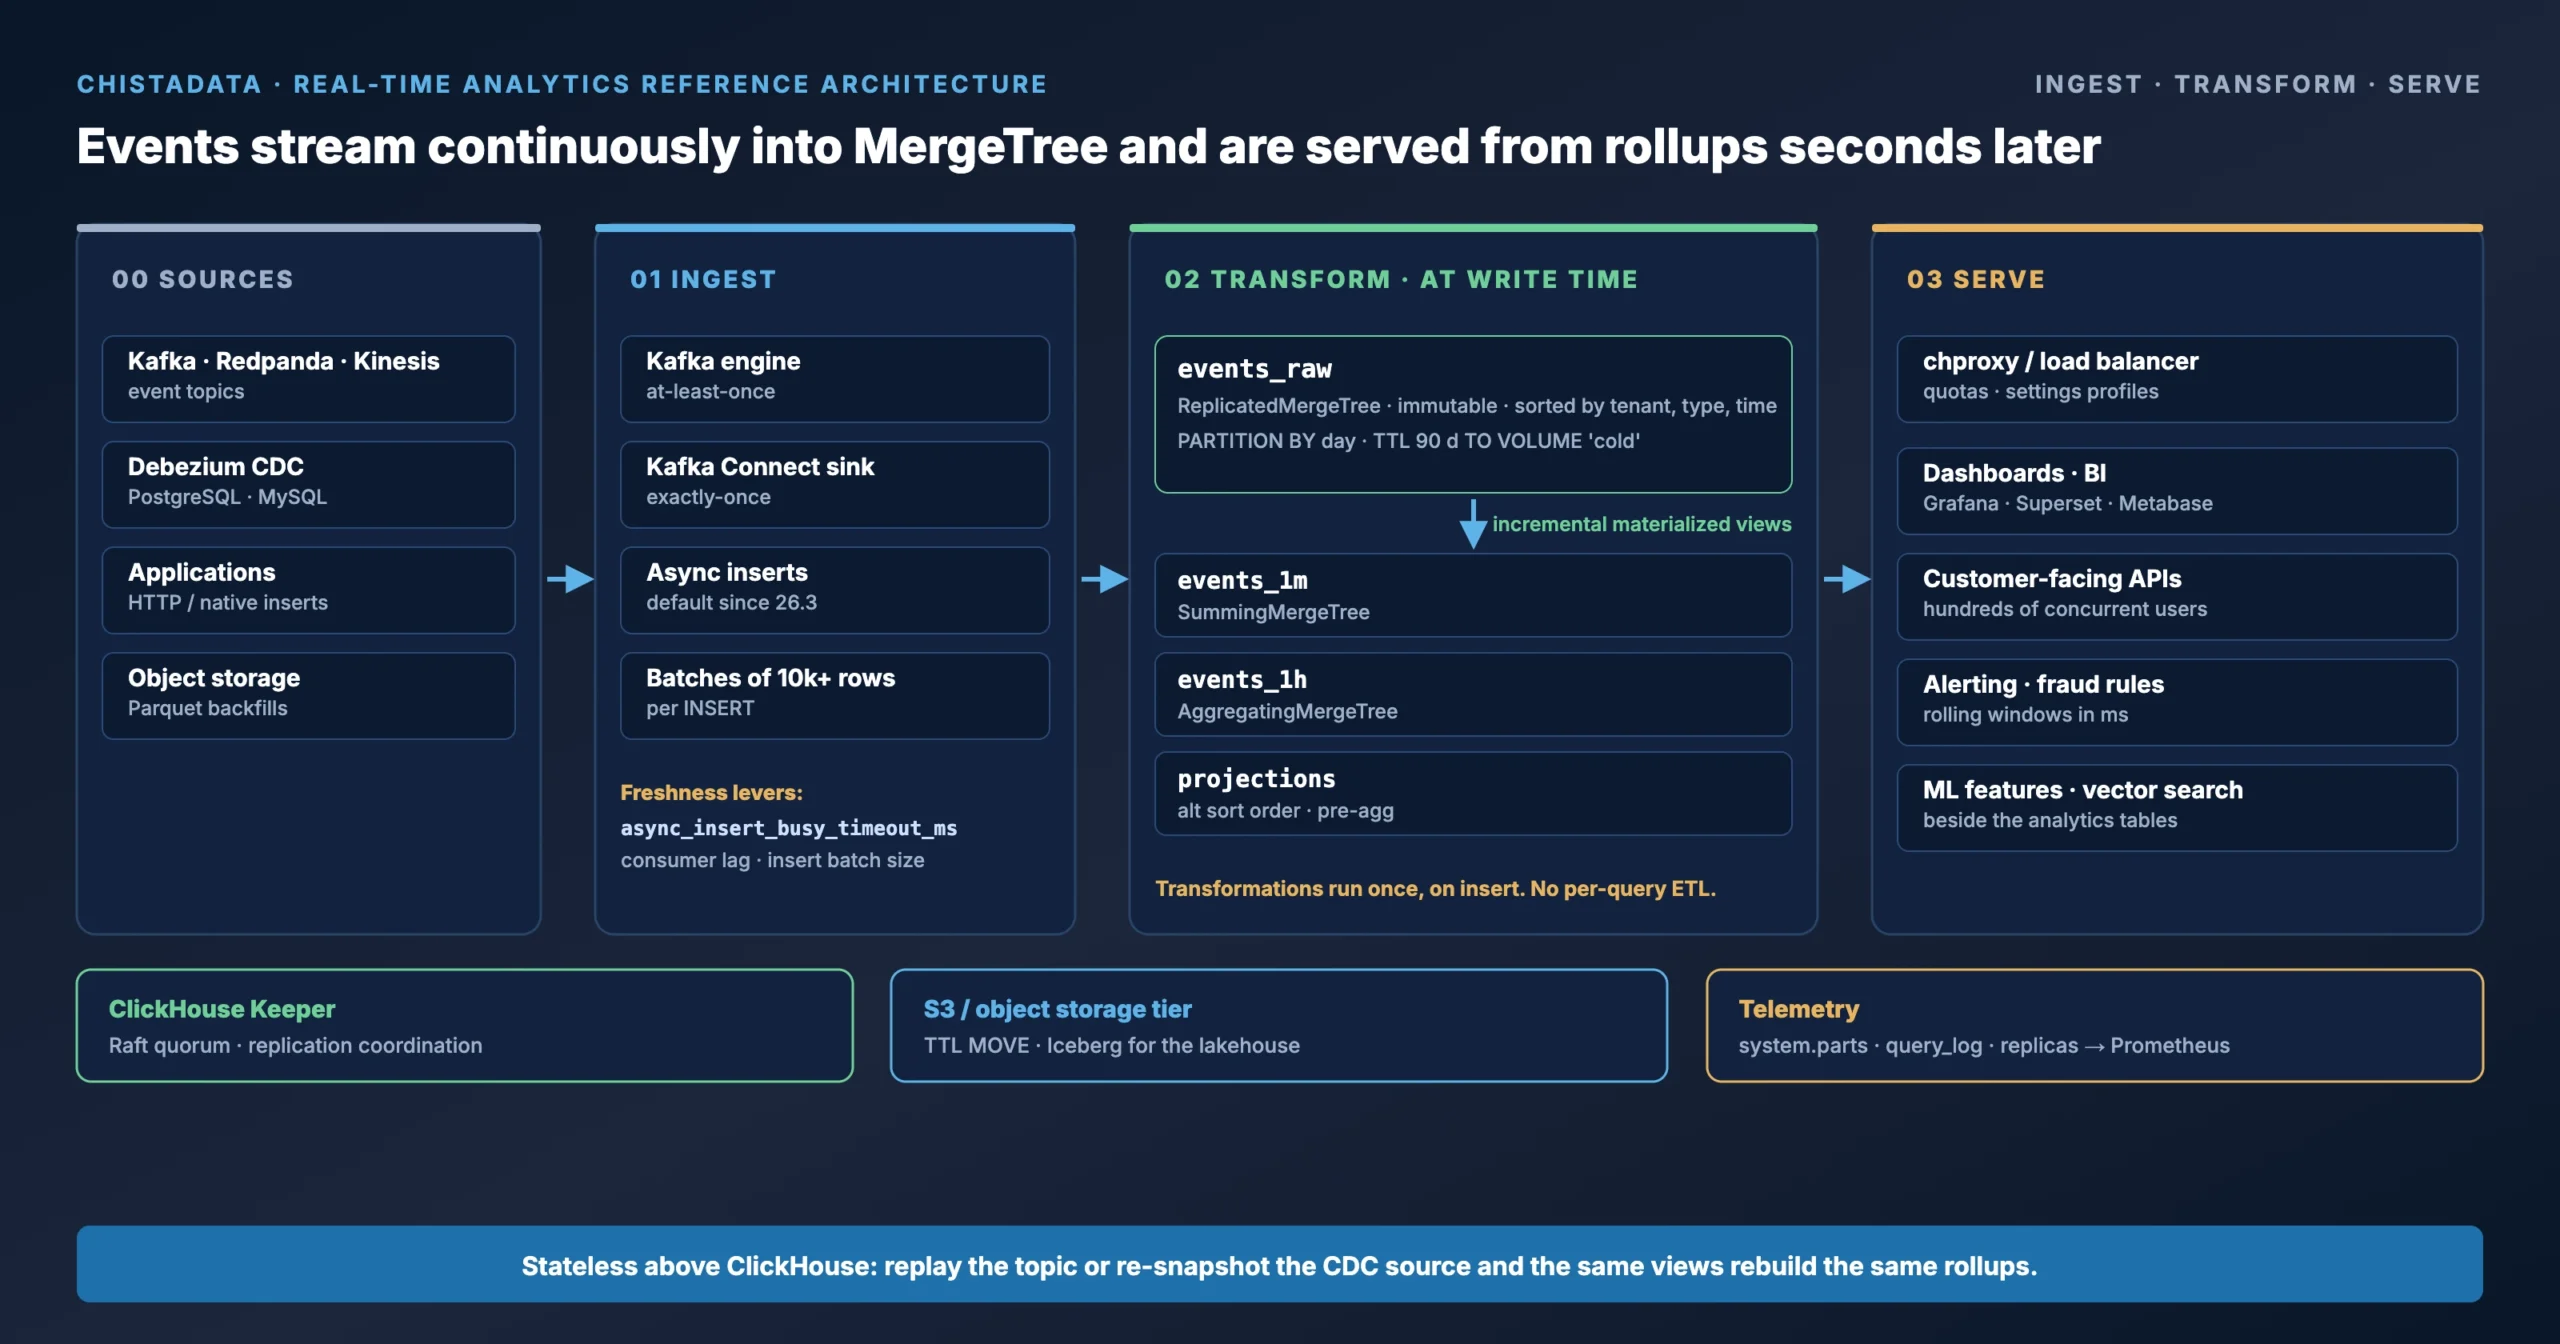
This is the architecture ChistaDATA deploys for batch-to-real-time programmes. It is stateless above ClickHouse: replay a Kafka offset range or re-snapshot a CDC source and the same materialized views rebuild the same rollups. That property is what makes the cutover reversible.
01 · INGEST
Streams land as parts
Kafka, Redpanda or Kinesis topics, Debezium CDC from PostgreSQL and MySQL, and application inserts over HTTP or native protocol. Target tens of thousands of rows per insert, or let async inserts coalesce small writes server-side.
02 · TRANSFORM
Once, at write time
A raw MergeTree table holds immutable events. Incremental materialized views fan out on insert into SummingMergeTree or AggregatingMergeTree rollups by minute, hour, tenant or dimension set. No per-query transformation.
03 · SERVE
Rollups, not raw scans
Dashboards, embedded product analytics, alerting and ML feature reads query the rollups through chproxy or a load balancer, with per-workload quotas and settings profiles. Cold partitions tier to object storage under TTL.
04 · OPERATE
Keeper, tiering, telemetry
ClickHouse Keeper coordinates replication, TTL moves hot data to S3-backed disks after its useful window, and every plane exports system-table metrics to Prometheus and Grafana.
Data modelling
MergeTree data modelling for freshness and query latency
The single most important decision in a real-time analytics deployment is the ORDER BY key of the raw table, because it defines both the sparse primary index and the physical sort order inside each part. Lead with the low-cardinality columns every query filters on, then the time column. Partition by a coarse time bucket so that TTL moves and drops operate on whole partitions and inserts do not spray parts across many partitions.
The pattern below is minimal but production-shaped: a replicated raw events table, an hourly rollup and the materialized view that keeps the rollup current on every insert. Engine parameters are explicit by ChistaDATA convention. It is written for ClickHouse 25.8 LTS and later and verified on 26.8 LTS.
UPDATE available since 25.7, which writes patch parts instead of rewriting the partition.-- Raw immutable events
CREATE TABLE IF NOT EXISTS analytics.events_raw ON CLUSTER '{cluster}'
(
event_time DateTime64(3, 'UTC') CODEC(Delta(8), ZSTD(1)),
tenant_id UInt32,
event_type LowCardinality(String),
user_id UInt64,
amount Decimal(18, 4),
attrs Map(String, String)
)
ENGINE = ReplicatedMergeTree('/clickhouse/tables/{shard}/analytics/events_raw', '{replica}')
PARTITION BY toYYYYMMDD(event_time)
ORDER BY (tenant_id, event_type, event_time)
TTL toDateTime(event_time) + INTERVAL 90 DAY TO VOLUME 'cold'
SETTINGS storage_policy = 'hot_cold',
index_granularity = 8192;
-- Hourly rollup served to dashboards
CREATE TABLE IF NOT EXISTS analytics.events_1h ON CLUSTER '{cluster}'
(
hour DateTime('UTC'),
tenant_id UInt32,
event_type LowCardinality(String),
events UInt64,
amount_sum Decimal(18, 4),
users AggregateFunction(uniq, UInt64)
)
ENGINE = ReplicatedAggregatingMergeTree('/clickhouse/tables/{shard}/analytics/events_1h', '{replica}')
PARTITION BY toYYYYMM(hour)
ORDER BY (tenant_id, event_type, hour);
-- Maintained on every insert into events_raw
CREATE MATERIALIZED VIEW IF NOT EXISTS analytics.mv_events_1h ON CLUSTER '{cluster}'
TO analytics.events_1h
AS
SELECT
toStartOfHour(event_time) AS hour,
tenant_id,
event_type,
count() AS events,
sum(amount) AS amount_sum,
uniqState(user_id) AS users
FROM analytics.events_raw
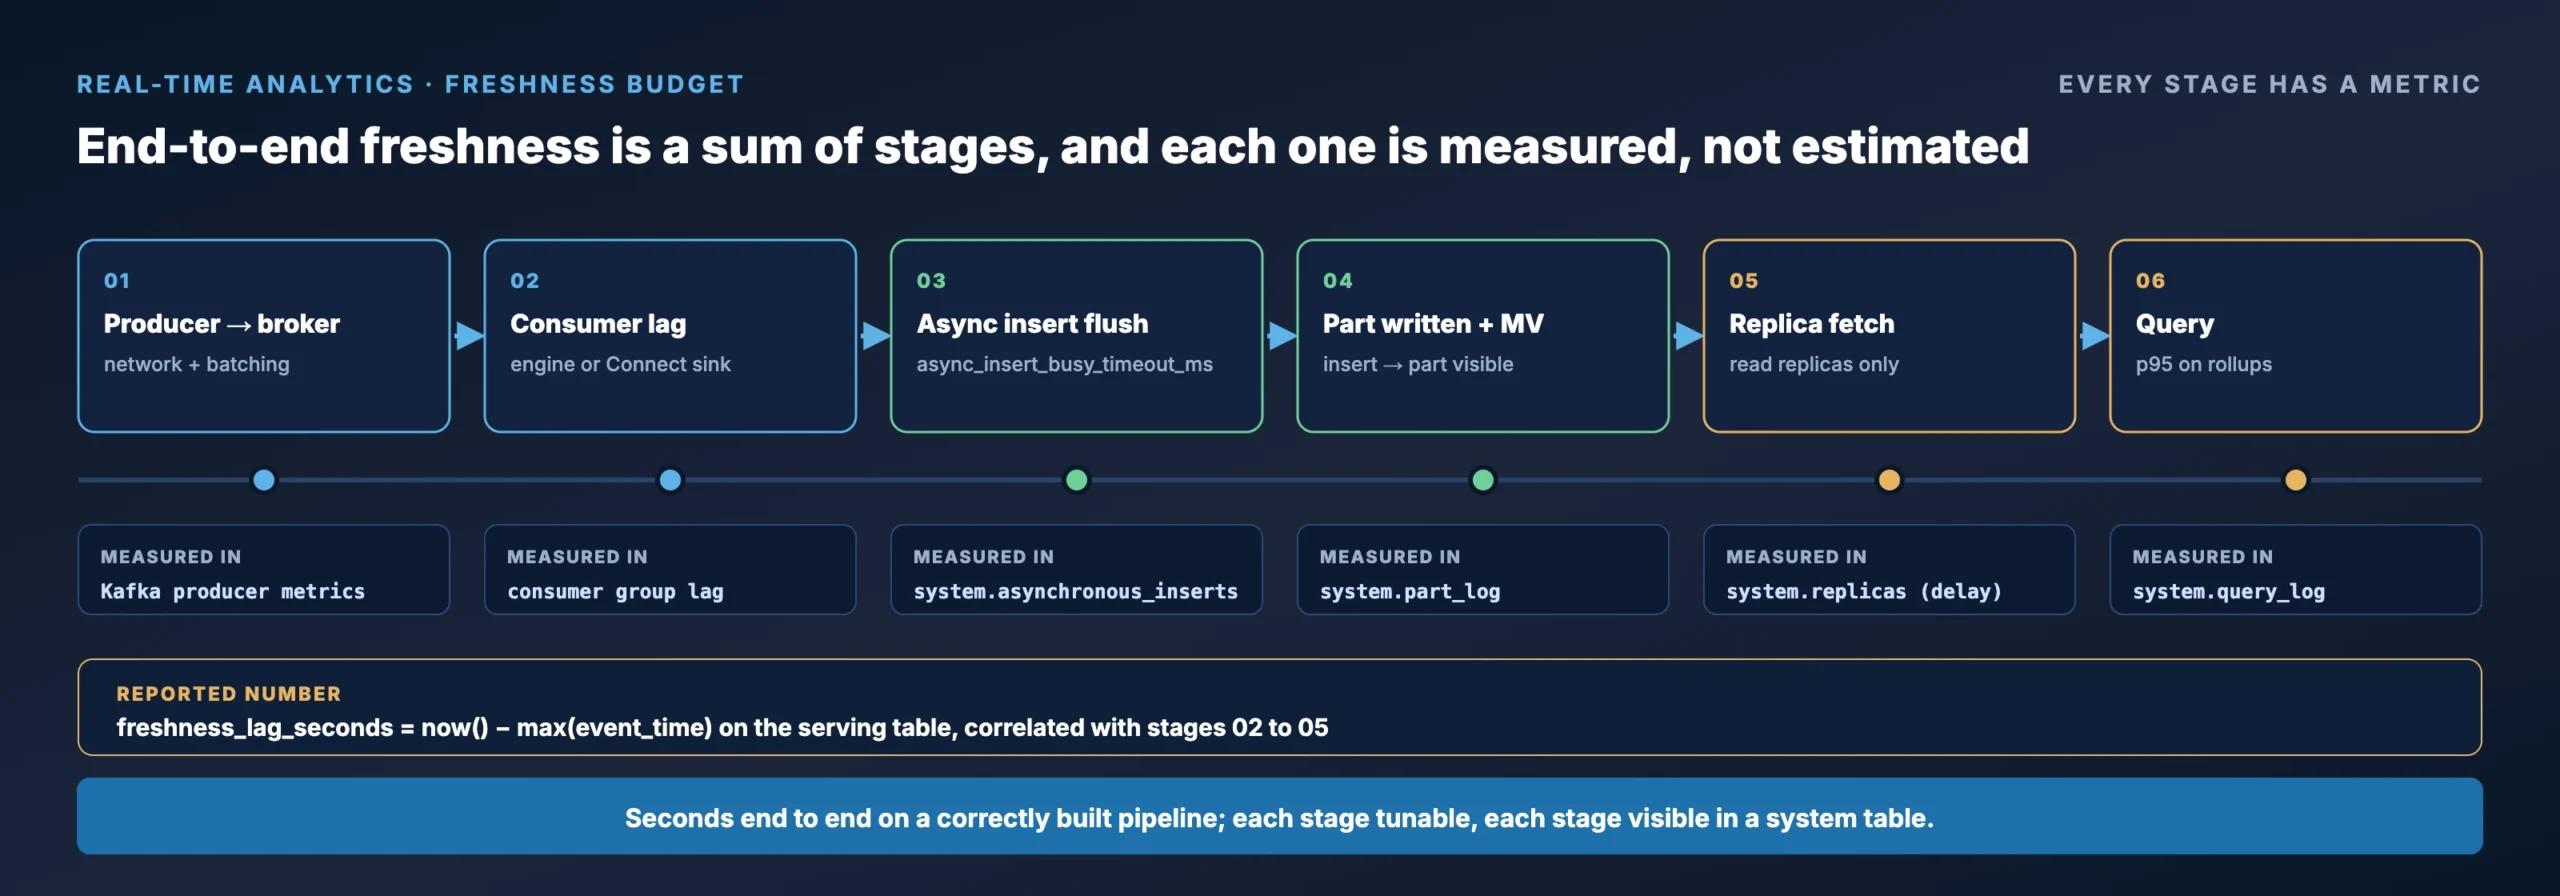
GROUP BY hour, tenant_id, event_type;Freshness is then a function of three things you can measure: Kafka consumer lag, the insert-to-part latency reported in system.part_log, and replication delay in system.replicas. Query latency on the serving path is a function of how much the rollup reduces the scanned row count, visible directly as read_rows in system.query_log.
Two additions belong in a 2026 design. Projections let a single raw table serve a second sort order or a pre-aggregation without a separate view. Refreshable materialized views, production-ready since 25.1, cover the small set of rollups that must be recomputed on a schedule rather than incrementally, for example a daily top-N that joins to a dimension table.
Current as of September 2026
What has changed for real-time analytics on ClickHouse recently
A batch-to-real-time design written against 23.x ClickHouse leaves capability on the table. These are the changes that alter the architecture or the operations of the pipeline above.
| Change | Since | What it means for a real-time pipeline |
|---|---|---|
| Async inserts enabled by default | 26.3 LTS | Small, frequent inserts are batched server-side without client changes. Review async_insert_max_data_size and async_insert_busy_timeout_ms: they now define the floor of your freshness budget. |
Lightweight UPDATE with patch parts | 25.7+ | Late corrections no longer rewrite whole parts. CDC patterns that used ALTER TABLE ... UPDATE can move to patch parts; ReplacingMergeTree remains the choice for high-rate upserts. |
| Native JSON type | 25.3 GA | Semi-structured events can land as typed JSON with dynamic subcolumns instead of Map(String, String), with better compression and direct column access. |
| Iceberg and Delta Lake writes, catalog integrations | 25.8 to 26.8 | The cold tier can be an open lakehouse readable by Spark and Trino, not just S3-backed MergeTree parts. 26.8 LTS added Iceberg writes to S3 Tables and Puffin statistics. |
| Vector similarity index GA | 25.8 LTS | Real-time feature stores and RAG retrieval can run beside the analytics tables instead of in a separate engine. |
| Cost-based distributed optimizer, parallel GROUP BY with adaptive merging | 26.8 LTS | Distributed JOIN and aggregation plans change on upgrade. Re-baseline the serving queries with EXPLAIN PIPELINE before and after. |
| Parquet lazy materialisation | 26.8 LTS | Backfills from object storage read far fewer bytes; ClickHouse reports around 77% fewer S3 reads on its own benchmarks, so history loads during migration are cheaper. |
Migration path
Migrating from batch processing to real-time analytics in six reversible phases
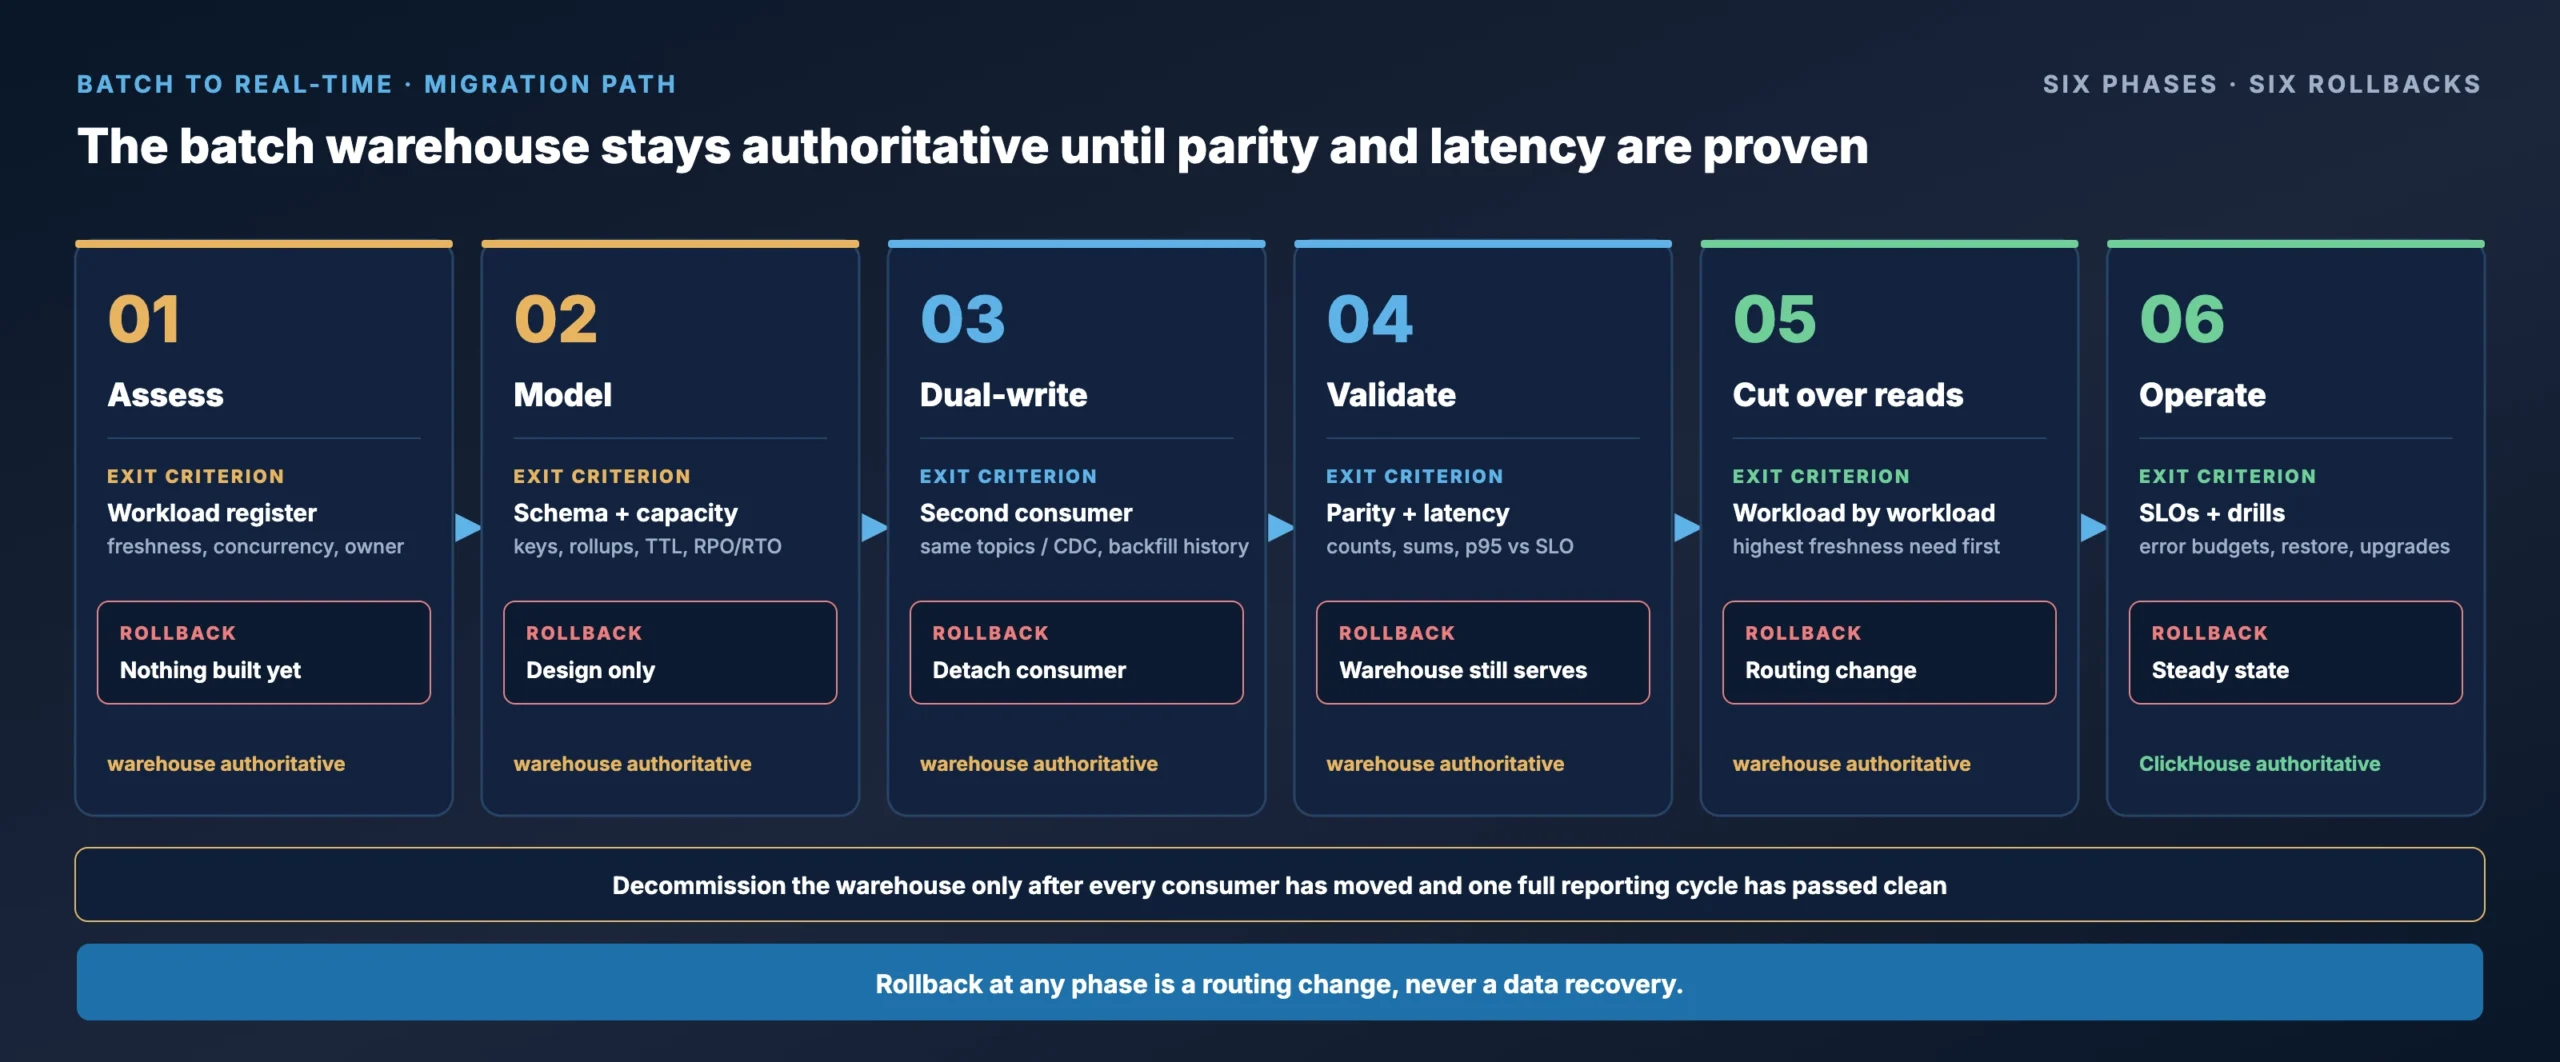
ChistaDATA runs batch-to-real-time migrations as staged, reversible programmes. The source system keeps serving until ClickHouse has proven parity on both data and latency, and every phase has an explicit rollback: stop the read cutover and the batch warehouse is still authoritative.
Assess
Inventory queries, SLAs and consumers. Classify workloads by required freshness and concurrency. Identify which streams (Kafka, CDC, files) already exist and which batch jobs must become streams.
Model
Design sort keys, partitions, rollups and TTL tiers from the actual query inventory. Size shards, replicas and ClickHouse Keeper. Define RPO and RTO and the replication topology before the first byte is loaded.
Dual-write
Attach ClickHouse as a second consumer of the same Kafka topics or a Debezium CDC stream. Backfill history from the warehouse in partition-sized batches, from Parquet on object storage where possible. Nothing downstream changes yet.
Validate
Run parity checks (row counts, sums, distinct counts by partition) and latency comparisons against production query mixes. Load-test concurrency with the real dashboard fleet, not synthetic users.
Cut over reads
Move consumers workload by workload, starting with the highest-freshness need. Keep the batch warehouse warm until the last consumer moves and one full reporting cycle passes clean. Rollback is a routing change.
Operate
SLOs and error budgets per workload, runbooks, quarterly restore and failover drills, upgrade management across LTS lines and capacity planning, under ChistaDATA managed services or your own team with our 24×7 support behind it.
| Ingestion strategy | Best fit | Trade-off to plan for |
|---|---|---|
| Dual-write from the application | Greenfield event producers you control | Consistency between writes; prefer a broker in between |
| Kafka fan-out to ClickHouse | Existing event bus with topic history | Exactly-once needs the Kafka Connect sink or idempotent keys; the Kafka table engine is at-least-once |
| CDC via Debezium | OLTP tables in PostgreSQL or MySQL | Updates and deletes need ReplacingMergeTree with FINAL or dedup-at-read, or lightweight UPDATE on 25.7+ |
| Gradual read migration | Large BI estates with many dashboards | Semantic-layer differences: SQL dialect, NULL handling, time zones |
Measurement
Proving the outcome: the telemetry that defines real-time analytics
A migration is finished when the numbers say so. ChistaDATA reports three metrics for every real-time analytics engagement, each sourced from a ClickHouse system table rather than an estimate.
End-to-end freshness
The gap between the event timestamp and the moment the row is visible to SELECT. Compare now() to max(event_time) on the serving table, and correlate with Kafka consumer lag and insert events in system.part_log.
Serving latency
p95 and p99 of query_duration_ms from system.query_log per dashboard or API user, with read_rows and read_bytes to show how much the data model reduced scan volume. See the p99 latency playbook.
Ingestion health
Parts per partition and merge backlog from system.parts and system.merges; too-many-parts errors are the classic symptom of under-batched inserts. Replication delay from system.replicas bounds the freshness of read replicas.
Illustrative, not measured for you
A well-modelled hourly rollup typically reduces read_rows by two to four orders of magnitude versus scanning raw events, which is where sub-second p95 comes from. Actual ratios depend on cardinality and query shape; we measure them per workload during validation.
The three queries behind the report
-- Serving latency by dashboard user, last 24 h
SELECT
    user,
    count() AS queries,
    quantile(0.95)(query_duration_ms) AS p95_ms,
    quantile(0.99)(query_duration_ms) AS p99_ms,
    avg(read_rows) AS avg_read_rows
FROM system.query_log
WHERE type = 'QueryFinish'
  AND event_time >= now() - INTERVAL 24 HOUR
  AND query_kind = 'Select'
GROUP BY user
ORDER BY p99_ms DESC;

-- Ingestion health: parts per active partition
SELECT
    database,
    table,
    partition,
    count() AS active_parts,
    sum(rows) AS rows,
    max(modification_time) AS last_part_written
FROM system.parts
WHERE active
  AND database = 'analytics'
GROUP BY database, table, partition
ORDER BY active_parts DESC
LIMIT 20;

-- Freshness: how far behind is the serving table?
SELECT dateDiff('second', max(hour), now()) AS freshness_lag_seconds
FROM analytics.events_1h;
Use cases
Where moving from batch processing to real-time analytics pays back first
Fraud, risk and AML
Score transactions against rolling windows of behaviour while the transaction is still in flight. ClickHouse holds months of history at full granularity and answers window aggregations in milliseconds. Read: real-time AML on ClickHouse.
Observability and log analytics
Replace hourly log rollups and expensive Elasticsearch clusters with a single MergeTree tier: high-cardinality metrics, traces and logs queried together. Read: Elasticsearch to ClickHouse for observability.
Product and customer analytics
Embedded, customer-facing dashboards with per-tenant isolation, funnels, retention cohorts and A/B results updated as sessions happen, at concurrency levels a batch warehouse cannot serve.
Ad-tech, gaming and IoT telemetry
Billions of events a day from bidding, live game sessions or sensor fleets, with sub-second rollups for monetisation, matchmaking and anomaly alerting.
How ChistaDATA delivers
How ChistaDATA delivers batch-to-real-time on ClickHouse
ChistaDATA is a full-stack ClickHouse infrastructure operations company: consulting, 24×7×365 consultative support, platform engineering and managed services on 100% open-source ClickHouse. Every real-time analytics engagement is led by principal ClickHouse engineers and documented in decision-grade written deliverables.
- Assessment and architecture. Query inventory, freshness classification, sort-key and partition design, shard, replica and Keeper sizing, RPO and RTO definition, and a migration roadmap with rollback at every phase. Start with a ClickHouse performance audit or ClickHouse consulting.
- Proof of concept on your data. Representative workloads, real dashboard concurrency, parity and latency reports from
system.query_log, and a cost model based on measured compression. - Production operations. 24×7 monitoring, SLOs and error budgets, runbook automation, upgrade management, quarterly restore and failover drills and capacity planning, through managed services, a remote ClickHouse DBA or our Data SRE practice.
Support is governed by an enterprise SLA: Severity 1 response in 15 minutes, Severity 2 in 12 hours, Severity 3 in 24 hours, Severity 4 in 48 hours. Standing caveat for every recommendation on this page: test before applying to production, and maintain a robust, drilled disaster-recovery posture.
FAQ
Batch processing to real-time analytics: frequently asked questions
What is the difference between batch processing and real-time analytics?
Batch processing transforms and loads data in scheduled windows, so every consumer sees data that is hours old. Real-time analytics ingests continuously and makes events queryable within seconds, serving many concurrent users against an always-current data set. The two differ in freshness, ingestion pattern, concurrency and cost model, not only in speed.
Why use ClickHouse for real-time analytics instead of a cloud data warehouse?
Cloud warehouses are built for large scheduled loads and a small number of heavy queries. ClickHouse is built for continuous inserts, background merges and high query concurrency, with native Kafka and CDC ingestion, incremental materialized views and columnar compression that keep both latency and cost predictable. It is also open source, so the same platform runs on any cloud or on premises.
How fresh can data be in ClickHouse?
Seconds, end to end, on a correctly built pipeline. The budget is the sum of producer-to-broker lag, the async insert flush interval, part creation and replica fetch. Each stage is measurable from Kafka consumer metrics, system.part_log and system.replicas, and each can be tuned down to sub-second on the hot path.
Can we migrate from batch processing to real-time analytics without downtime?
Yes. The six-phase path above dual-writes ClickHouse beside the existing warehouse, validates parity and latency, then moves consumers one workload at a time. The warehouse stays authoritative until the last consumer moves, so rollback at any phase is a routing change rather than a data recovery.
Which ClickHouse version should a new real-time platform run?
The current LTS line. Since 26.3 LTS async inserts are on by default, and 26.8 LTS brought the cost-based distributed optimizer and Iceberg writes. The release coverage line on this page is updated as each LTS ships, and we run upgrade engineering for estates on older lines.
How does ChistaDATA support real-time ClickHouse platforms in production?
Through 24×7×365 consultative support with a 15-minute Severity 1 response, fully managed services under contracted SLOs, or a named remote ClickHouse DBA inside your team. All three include monitoring from system tables, runbooks, quarterly restore drills and upgrade management.
Sources and further reading
References
- ClickHouse documentation: MergeTree
- ClickHouse documentation: Kafka table engine
- ClickHouse documentation: asynchronous inserts
- ClickHouse documentation: incremental materialized views
- ClickHouse documentation: projections
- ClickHouse: Release 26.8 LTS
- ClickHouse: Release 26.3 LTS
- ClickHouse: 2025 roundup
- Cloudflare: HTTP analytics for 6M requests per second using ClickHouse
- ChistaDATA: How to use Kafka with ClickHouse
- ChistaDATA: ClickHouse projections for query optimisation
- ChistaDATA: ClickHouse ingestion performance troubleshooting
- ChistaDATA: Merge and mutation performance in ClickHouse
- ChistaDATA: Troubleshooting ClickHouse replication
- ChistaDATA: MergeTree engine internals
- ChistaDATA University
Start the transformation
Move from batch processing to real-time analytics with ClickHouse
Bring your query inventory, your streams and your freshness targets. ChistaDATA engineers will map a staged, reversible migration and prove the result in your own telemetry.
All guidance on this page is general engineering advice. Test every change on a non-production environment before applying it to production, and maintain a robust backup and disaster recovery posture. Version claims are as published in September 2026.