ClickHouse internals · Performance engineering · Lab-measured
ClickHouse vectorized query processing is the reason a single CPU core can aggregate billions of values per second. Instead of pushing one row at a time through the query plan, ClickHouse moves blocks of up to 65,409 rows through tight loops over column arrays that the CPU executes with SIMD instructions.
This guide explains how the engine does it, from MergeTree granules to processors to AVX-512 registers, and puts numbers on it. We measured each mechanism in our lab on the ClickHouse 26.7 engine, so every figure below comes with the query that produced it.
Lab at a glance
- Engine
- ClickHouse 26.7.2.1 (embedded via chDB 4.4.0)
- CPU
- Intel Xeon 2.8 GHz, AVX2 and AVX-512, 2 vCPU
- Memory
- 7 GB RAM, Linux 6.18
- Method
- max_threads = 1 to isolate per-core effects; median of 3 to 5 runs
Execution models
What ClickHouse vectorized query processing actually means
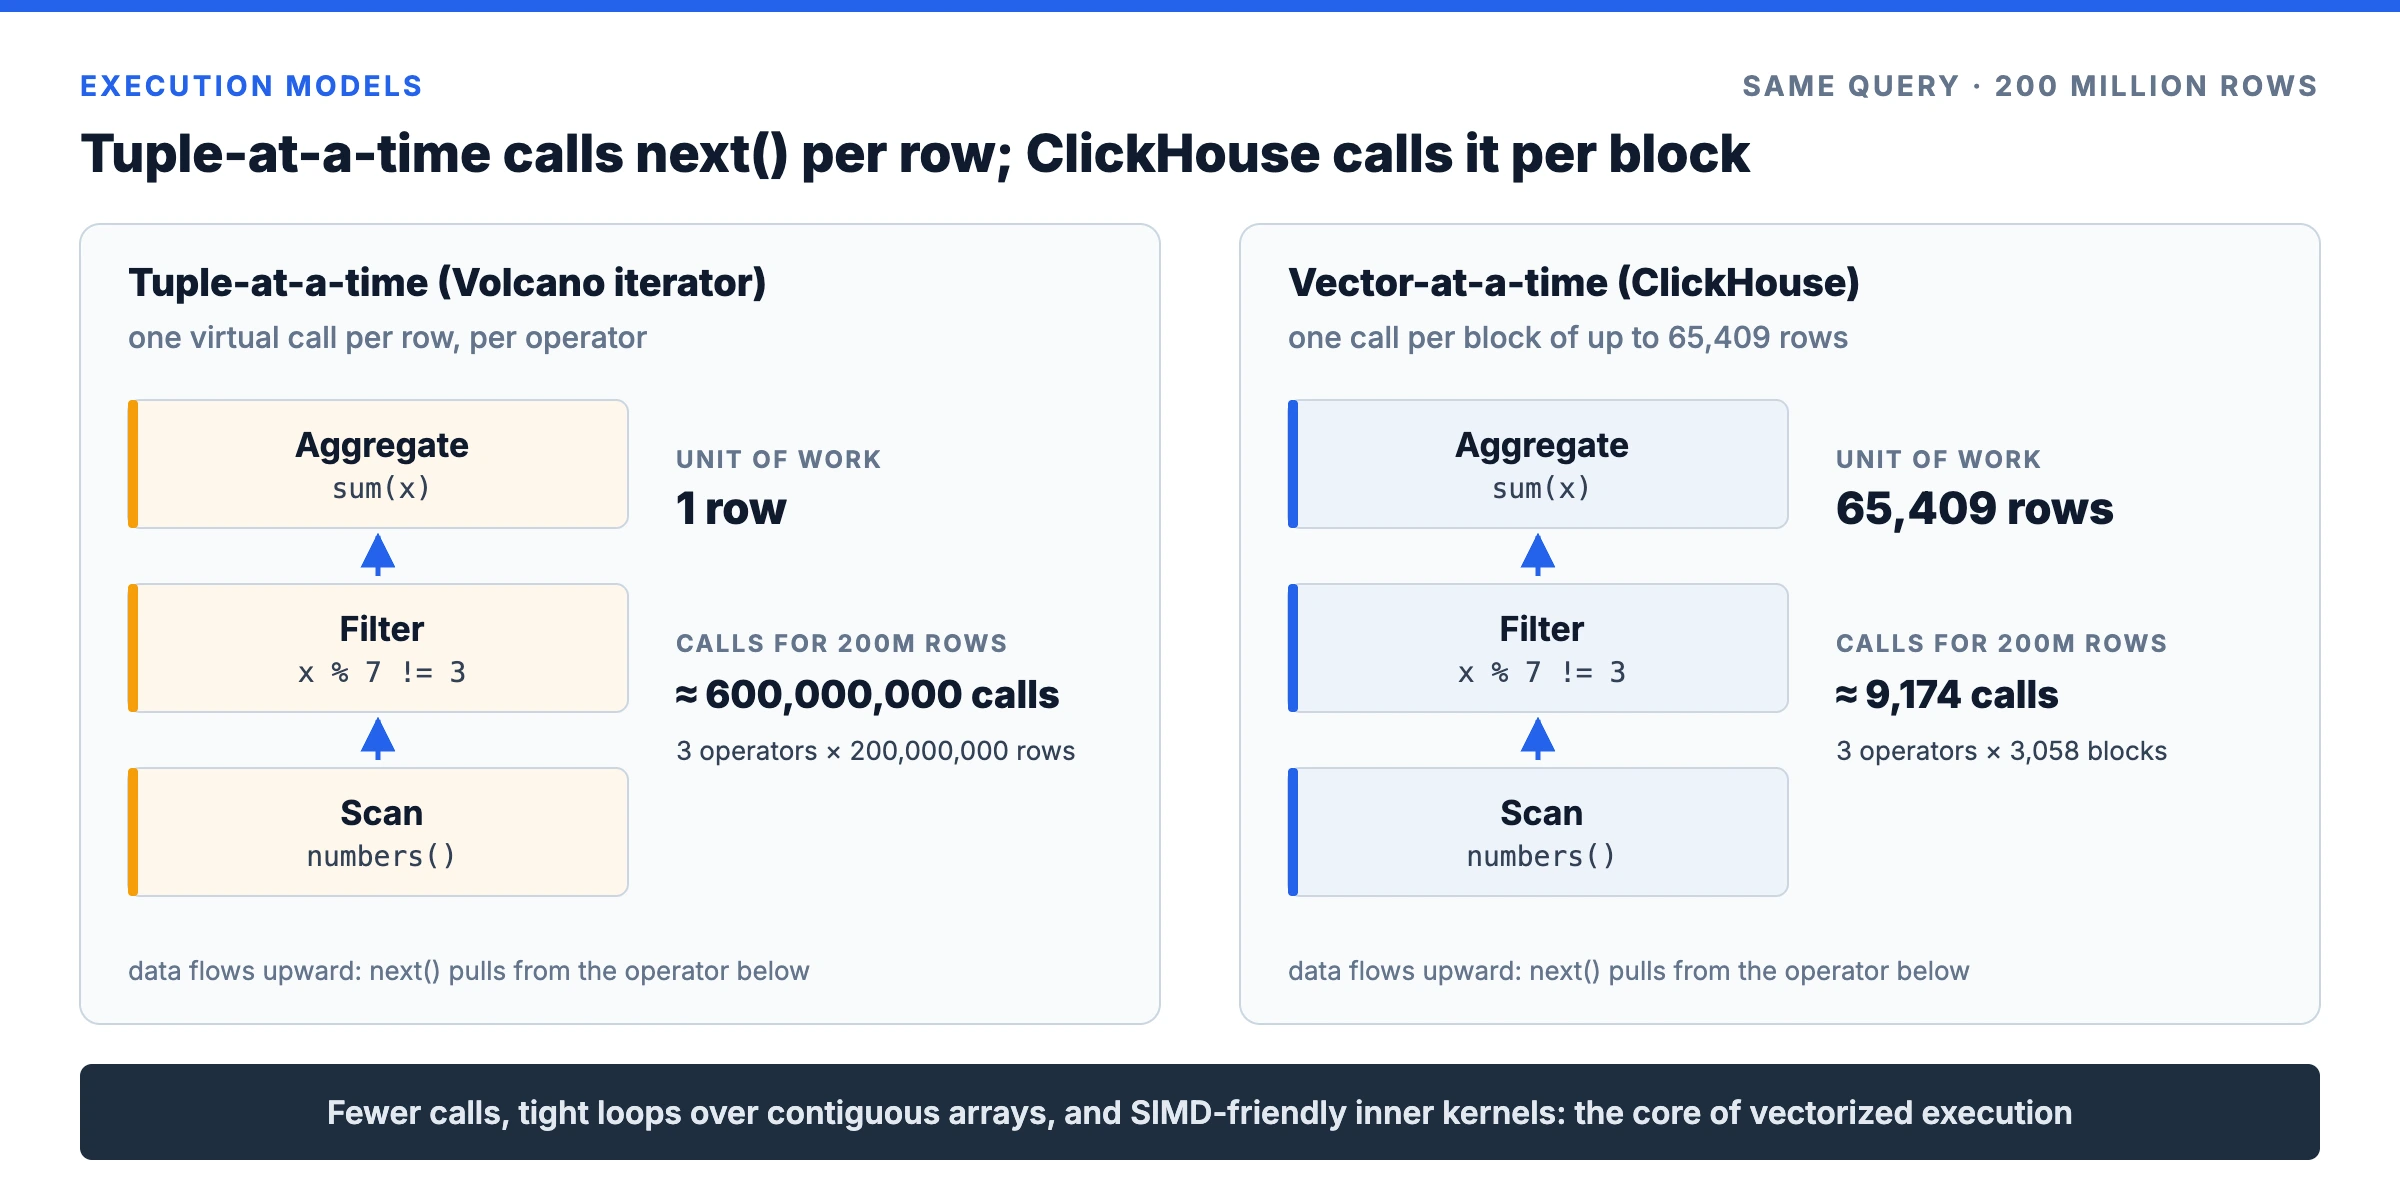
To see why ClickHouse vectorized query processing matters, start with the alternative. Classic row stores execute plans with the Volcano iterator model: every operator exposes a next() method that returns one row. A scan, a filter and an aggregate over 200 million rows therefore cost around 600 million function calls before any useful arithmetic is done, and each call breaks the CPU pipeline with branches and cache misses.
Vector-at-a-time execution, introduced by the MonetDB/X100 paper by Boncz, Zukowski and Nes (CIDR 2005), changes the unit of work from a row to a batch. ClickHouse adopted the same model: operators produce, pass and consume chunks of rows. The ClickHouse architecture documentation describes it as dispatching operations on arrays rather than on individual values.
With ClickHouse vectorized query processing and the default block size, the same 200 million rows travel as 3,058 blocks, so the three operators make roughly 9,174 calls in total. The per-call overhead becomes noise, and the work inside each call is a simple loop the compiler can vectorize.
The block size is a deliberate compromise. Too small, and the engine pays function-call and bookkeeping costs on every few rows, which is exactly what the Volcano model suffers from. Too large, and the intermediate columns that each operator produces stop fitting in the CPU caches, so every step pays a trip to main memory. A few tens of thousands of rows per block keeps both costs low for typical analytical columns, and ClickHouse additionally caps blocks by bytes through preferred_block_size_bytes so that wide string columns do not blow the cache budget.
Inside the engine
Blocks, columns and processors: how the data moves
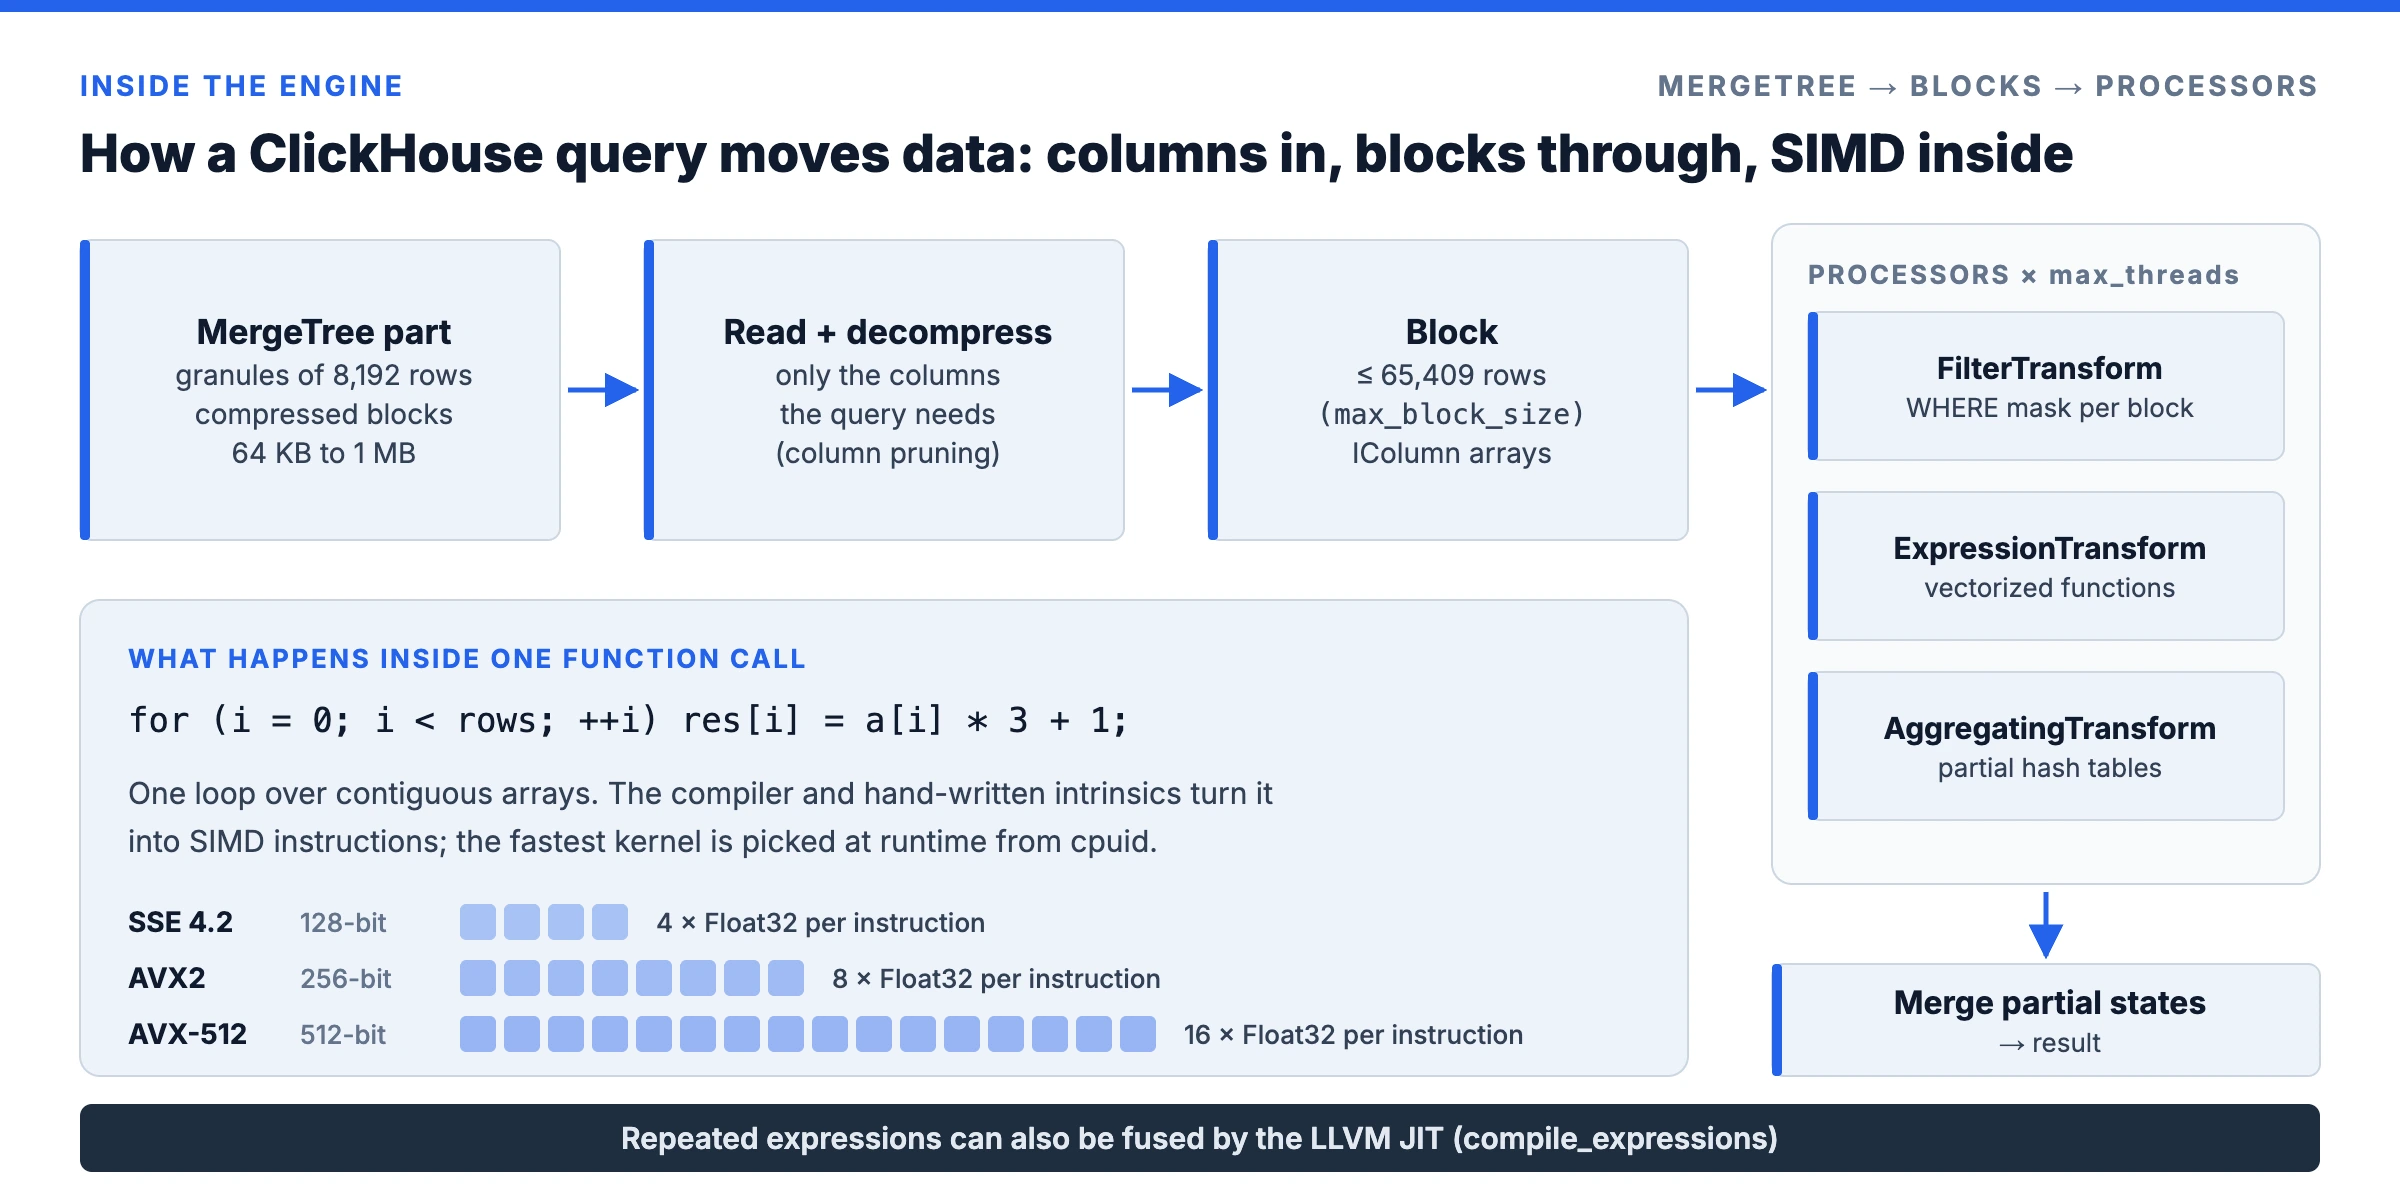
A Block is ClickHouse’s in-memory unit of work: a set of columns, each an IColumn backed by contiguous arrays, plus their types and names. Numeric columns are plain arrays; strings and arrays use an offsets vector and a data vector. Functions never modify a column in place, they return a new one, which keeps every inner loop simple and branch-light.
- On disk, MergeTree splits each part into granules of 8,192 rows, and compresses columns in blocks of roughly 64 KB to 1 MB of uncompressed data. See our ClickHouse MergeTree guide for how granules and marks drive index lookups.
- In memory, readers assemble blocks of up to
max_block_sizerows, 65,409 by default according to the settings reference. At 8 bytes per value that is about 511 KiB per UInt64 column, small enough to stay close to the core’s caches. - In the pipeline, processors such as FilterTransform, ExpressionTransform and AggregatingTransform consume and produce chunks. The pipeline is replicated across
max_threadsstreams and partial aggregation states are merged at the end.
Only the columns a query references are read and decompressed. That is the storage half of the story, and it is covered with measurements in the column pruning section.
Hardware
SIMD and runtime CPU dispatch
SIMD is where ClickHouse vectorized query processing meets the hardware. Once data sits in contiguous arrays, a single instruction can operate on several values at once. The wider the register and the narrower the type, the more values move per instruction:
| Instruction set | Register width | Float64 lanes | Float32 lanes | UInt8 lanes |
|---|---|---|---|---|
| SSE 4.2 | 128-bit | 2 | 4 | 16 |
| AVX2 | 256-bit | 4 | 8 | 32 |
| AVX-512 | 512-bit | 8 | 16 | 64 |
ClickHouse ships several compute kernels for hot functions, written with intrinsics or left to compiler auto-vectorization, and picks the fastest one at runtime from the cpuid instruction. According to the ClickHouse VLDB 2024 paper, this lets one binary run on hardware as old as 15 years, with SSE 4.2 as the minimum on x86-64, while still using AVX-512 where it exists. The same paper notes more than 30 hash table variants selected per key type, which is the same idea applied to aggregation.
Want to know why the whole engine is built this way? Our overview of why ClickHouse is so fast and the comparison of columnar and row-based databases cover the broader design.
ChistaDATA lab
ClickHouse vectorized query processing in numbers
Theory is cheap, so we measured ClickHouse vectorized query processing directly. We ran every test on the ClickHouse 26.7.2.1 engine embedded in chDB 4.4.0, on a 2-vCPU Intel Xeon at 2.8 GHz with AVX-512 and 7 GB of RAM. Every query pins max_threads = 1, so the numbers describe one core. They are real measurements on a small virtual machine, not a benchmark of your hardware.
Test 1: block size is the vectorization dial
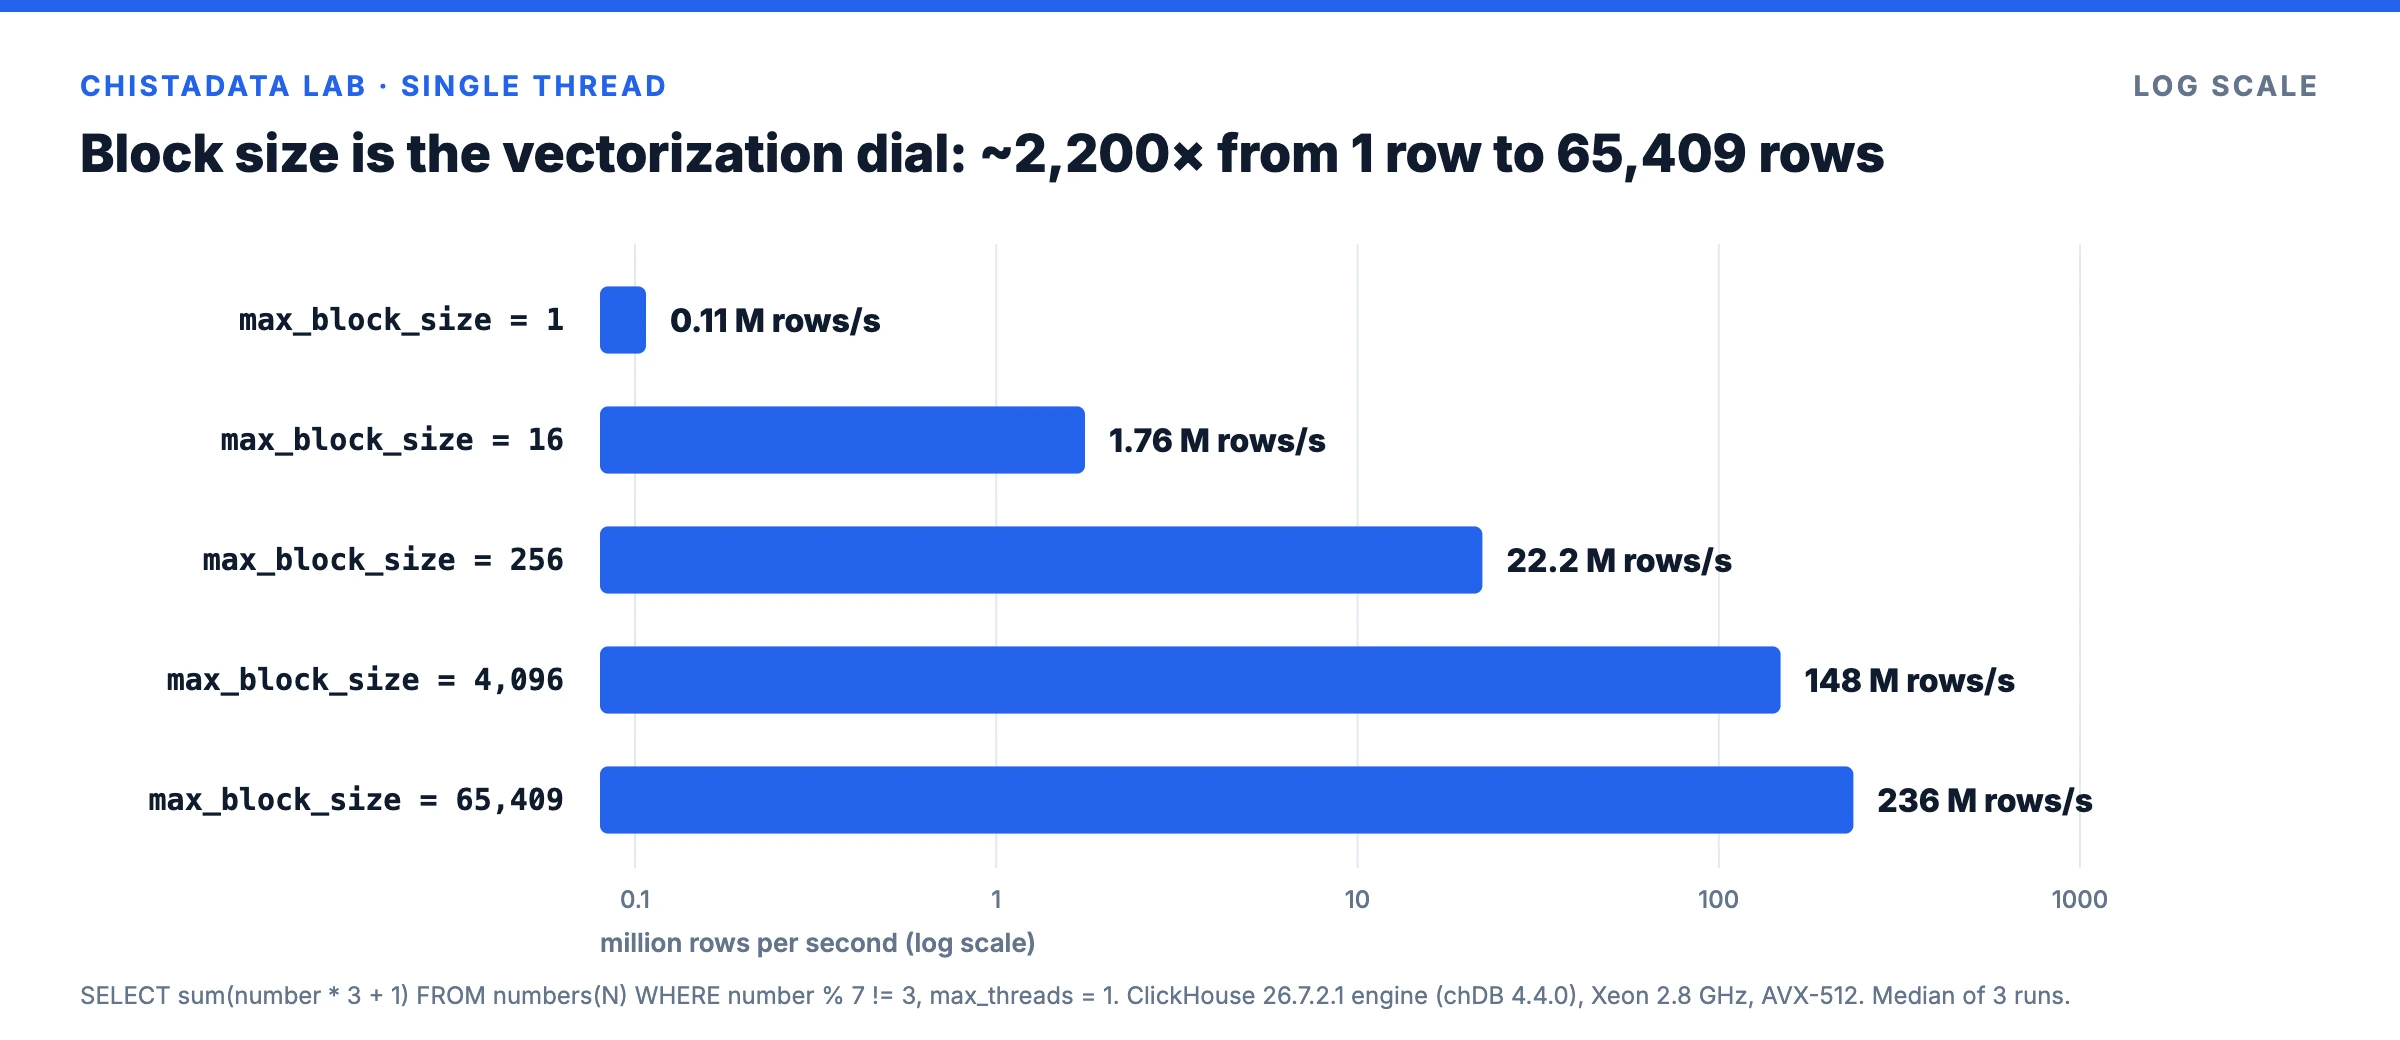
If ClickHouse vectorized query processing matters, making the vectors tiny should hurt. The first test keeps the query fixed and changes only max_block_size. Shrinking the block to one row effectively turns ClickHouse back into a row-at-a-time engine.
SELECT sum(number * 3 + 1)
FROM numbers(200000000)
WHERE number % 7 != 3
SETTINGS max_block_size = 65409, max_threads = 1;| max_block_size | Rows processed | Median time | Throughput |
|---|---|---|---|
| 1 | 2,000,000 | 18.66 s | 0.11 million rows/s |
| 16 | 20,000,000 | 11.37 s | 1.76 million rows/s |
| 256 | 200,000,000 | 9.02 s | 22.2 million rows/s |
| 4,096 | 200,000,000 | 1.35 s | 148.3 million rows/s |
| 65,409 (default) | 200,000,000 | 0.85 s | 235.8 million rows/s |
Test 2: narrower types, more values per register
The second test sums one column of a 200-million-row Memory table, so disk and decompression are out of the picture.
SELECT sum(u8) FROM mem SETTINGS max_threads = 1; -- repeated for u32, u64, f32, f64| Column type | Bytes per value | Median time | Throughput |
|---|---|---|---|
| UInt8 | 1 | 0.047 s | 4,272 million rows/s |
| UInt32 | 4 | 0.111 s | 1,810 million rows/s |
| Float32 | 4 | 0.131 s | 1,522 million rows/s |
| UInt64 | 8 | 0.203 s | 986 million rows/s |
| Float64 | 8 | 0.211 s | 949 million rows/s |
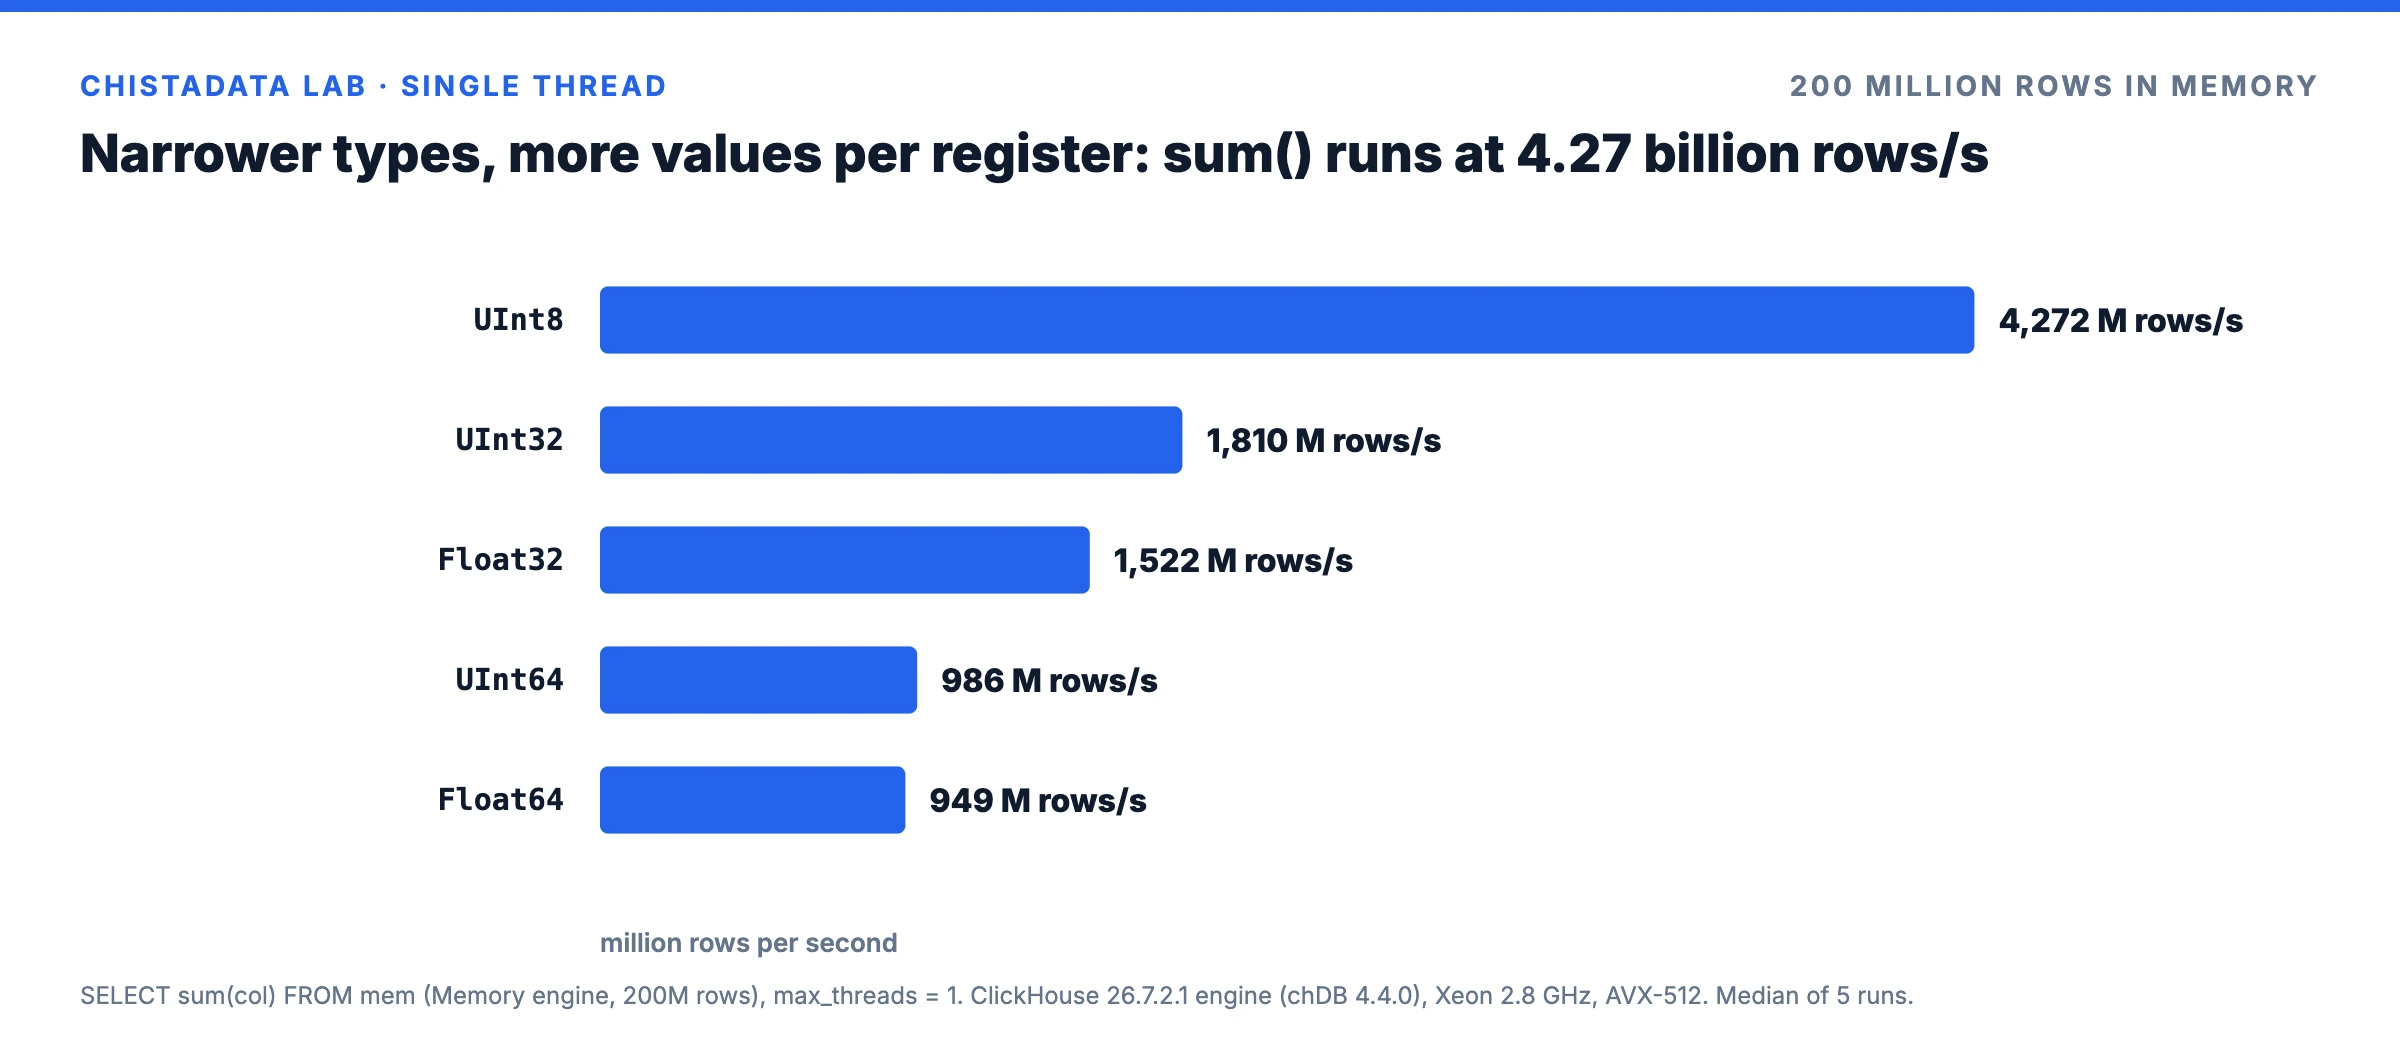
numbers() generator, and the type test is partly bound by memory bandwidth. The trend is what matters. Always test on your own workload and hardware before changing production settings, and keep a verified backup and DR posture in place.Code generation
LLVM JIT on top of vectorization
ClickHouse vectorized query processing has one known cost: each function writes a temporary column that the next function reads back. For long arithmetic expressions, ClickHouse can fuse the chain into one native function with LLVM. The VLDB paper explains that compilation starts only after the same expression has been seen a configurable number of times, controlled by min_count_to_compile_expression, so short one-off queries do not pay the compile cost.
SELECT sum(((number * 7 + 3) % 1000) * 2 + (number % 13) * 5
           - (number % 11) * 3 + ((number * 17) % 97))
FROM numbers(100000000)
SETTINGS max_threads = 1,
         compile_expressions = 1,
min_count_to_compile_expression = 0;compile_expressions = 0compile_expressions = 1, a 1.41× gain on the same coreCompiled code is cached, so the compile cost is paid once per expression shape rather than once per query, and the cache can be inspected and dropped like any other ClickHouse cache. Where compilation fails or is not supported for a function, the engine silently falls back to the regular vectorized path, which makes the setting safe to leave enabled.
Both runs return the same result. The gain depends on how long the expression chain is: simple aggregates barely change, while wide arithmetic and conditional expressions benefit most.
Storage
Column pruning: the I/O half of vectorized processing
ClickHouse vectorized query processing is only fast if the right data reaches the vectors. We loaded 20 million rows into a 20-column MergeTree table of UInt64 values and compared a query that touches one column with one that touches all 20.
| Measurement | One column (c7) | All 20 columns |
|---|---|---|
| Compressed bytes on disk | 76.9 MiB | 1.50 GiB |
| Uncompressed bytes | 152.6 MiB | 2.98 GiB |
| Median query time, one thread | 0.26 s | 5.59 s |
Reading one column touched about one twentieth of the table’s bytes. The all-columns query also does 20 times more arithmetic, so the time ratio mixes I/O and compute, but the lesson is the same: SELECT * on a wide table throws away most of what a column store gives you. Our SQL antipatterns in ClickHouse guide lists the other common ways to fall off the fast path.
Honest limits
Where ClickHouse vectorized query processing stops helping
ClickHouse vectorized query processing removes interpretation overhead and feeds SIMD units. It does not remove every cost, and knowing the boundaries saves a lot of tuning time.
- Point lookups and tiny queries. A query that returns a handful of rows spends most of its time parsing, planning and locating granules. Block size barely matters there; the primary key and sort order decide the latency.
- Random memory access. Hash aggregation and hash joins probe tables at unpredictable addresses. ClickHouse chooses a specialised hash table per key type to soften this, but high-cardinality GROUP BY and large joins remain bound by cache misses and memory, not by SIMD width.
- Row-shaped logic. Executable UDFs, per-row string parsing and deeply nested conditionals leave less for the vector units to do. Rewriting them with built-in array and string functions usually pays back quickly.
- Merges and small parts. Thousands of tiny parts mean thousands of small reads and short vectors. Batching inserts and keeping part counts healthy is part of query performance; see monitoring merge queues in ClickHouse.
- Too many threads on too few cores. Parallel streams multiply throughput only while cores and memory bandwidth are free. On shared hosts, raising
max_threadspast the physical cores adds contention rather than speed.
In practice, ClickHouse vectorized query processing is rarely the bottleneck in a slow ClickHouse estate. The usual culprits are schema choices, sort keys that do not prune, and ingestion patterns. That is why every ChistaDATA engagement starts with evidence from system.query_log and system.parts rather than with settings changes.
Practice
Keeping queries on the ClickHouse vectorized fast path
| Practice | Why it matters | How to verify |
|---|---|---|
Leave max_block_size at its default for analytical queries | Smaller blocks multiply per-block overhead, as Test 1 shows | SELECT getSetting('max_block_size') |
Use the narrowest correct type, and LowCardinality(String) for repetitive strings | More values per register and fewer bytes through memory | system.columns compressed and uncompressed sizes |
Use Nullable only where NULL carries meaning | Each Nullable column carries an extra null-map column to read and check | system.columns type review |
| Select only the columns you need | Column pruning keeps I/O and decompression proportional to the query | read_bytes in system.query_log |
| Prefer built-in functions to executable UDFs | Executable UDFs serialize blocks to an external process | Query profile and query_duration_ms |
Keep compile_expressions enabled for repeated heavy expressions | Fuses chains of functions into one native loop | Before-and-after timing, as in the JIT test |
Two queries show whether ClickHouse vectorized query processing is working for you. EXPLAIN PIPELINE shows which processors run and how many parallel streams they use:
EXPLAIN PIPELINE
SELECT event_type, count()
FROM analytics.events
WHERE event_date >= today() - 7
GROUP BY event_type;
And system.query_log shows how much data each query shape read and how much CPU it burned:
SELECT
    normalized_query_hash,
    count()                                             AS runs,
    quantile(0.99)(query_duration_ms)                   AS p99_ms,
    formatReadableSize(avg(read_bytes))                 AS avg_read,
    round(avg(ProfileEvents['UserTimeMicroseconds']) / 1e6, 2) AS avg_cpu_s
FROM system.query_log
WHERE type = 'QueryFinish'
  AND event_date >= today() - 1
GROUP BY normalized_query_hash
ORDER BY p99_ms DESC
LIMIT 20;
If this is the kind of analysis you want done on your cluster, our ClickHouse performance tuning and optimization engagements start from exactly these system tables.
FAQ
ClickHouse vectorized query processing: frequently asked questions
Is vectorized execution the same as SIMD?
No. ClickHouse vectorized query processing is the engine design of processing blocks of values per operator call. SIMD is the CPU feature that executes one instruction on several values. Vectorized execution makes SIMD possible, because the inner loops run over contiguous arrays.
Should max_block_size ever be lowered?
Rarely for analytical queries. Lowering it can reduce peak memory for very wide rows, but Test 1 shows how quickly throughput falls. Change it per query, measure, and keep the default otherwise.
Does ClickHouse need AVX-512?
No. On x86-64 the minimum is SSE 4.2. ClickHouse detects AVX2 and AVX-512 at runtime and uses faster kernels when they are available, so the same binary runs everywhere.
Does the JIT replace vectorization?
No. ClickHouse vectorized query processing remains the execution model. The LLVM JIT fuses repeated expressions into one native function and runs inside the same block-based pipeline.
Why are our queries slow if ClickHouse is vectorized?
Usually because of what reaches the vectors: too many columns, a sort key that does not prune granules, too many small parts, or joins that spill. A ClickHouse performance audit finds which one from your query log.
Next step
Put these numbers to work on your own cluster
ClickHouse vectorized query processing only pays off when queries stay on the fast path. ChistaDATA engineers profile your real workload, find where queries leave the vectorized fast path, and fix the schema and settings behind it, with a measured before-and-after report.
Running ClickHouse in production? ChistaDATA provides ClickHouse consulting for architecture, performance and migrations, and 24×7 ClickHouse support with a 15-minute S1 response. For day-to-day operations see ClickHouse DBA services and ClickHouse managed services.
