Introduction
In the previous part of this series, we had seen the steps to connect to a ClickHouse database server running on ChistaDATA cloud DBAAS from an Apache Superset application. In this part, we will look at the steps to add a dataset in Apache Superset, create charts and dashboard based on the dataset and SQL Lab to explore the data.
Adding a Dataset
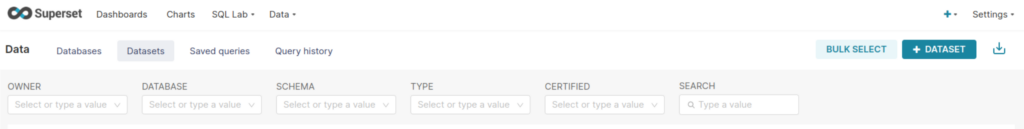
- Navigate to Data -> Datasets. Select the add Dataset button on the top right section of the page.
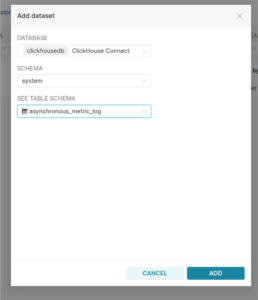
2. Enter the database name, schema name and the table name of the data table and select the ADD button
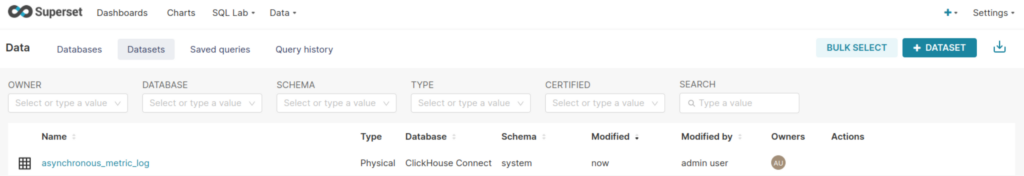
3. The newly added dataset will be available in the datasets page
Exploring the data with SQL Lab
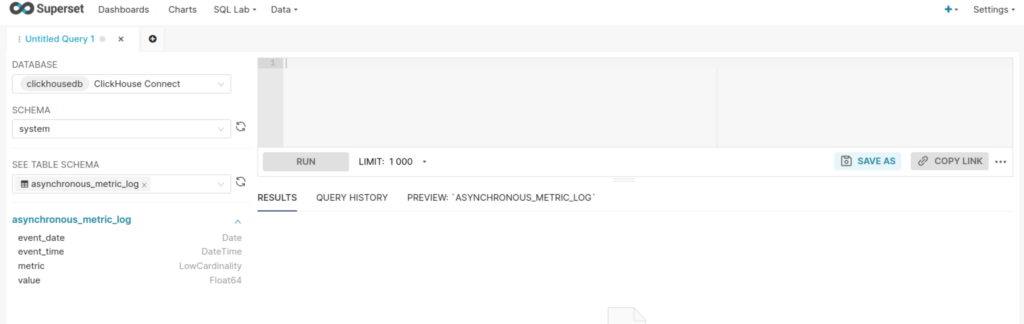
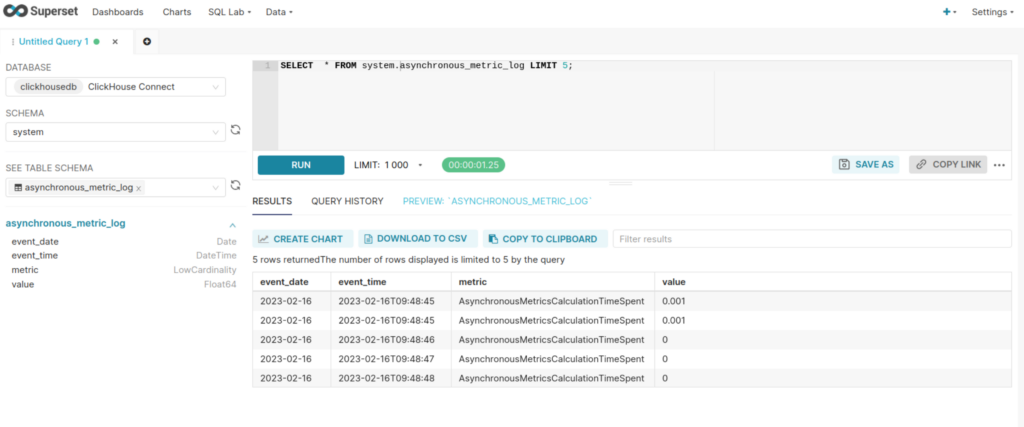
Apache Superset has a modern and feature rich SQL IDE called SQL Lab. You can refer this page for a comprehensive list of available features and usage. To execute a query navigate to SQL Lab -> SQL Editor.
- Choose the Database, schema and table schema to look at the columns and data type of those columns
2. You can execute the queries in the query editor and see the results
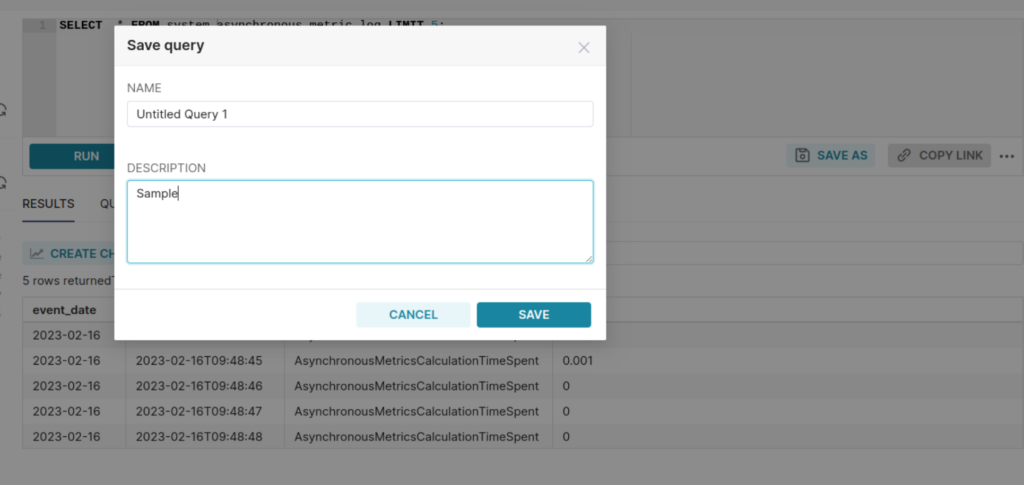
3. You can also save the queries by selecting the SAVE AS button which is below the query editor. You can specify a name and text description for the queries and hit the SAVE button
Creating Visualisations
Apache Superset has a powerful engine, that includes around 60 different charts available. To create a new chart, you can follow these steps.
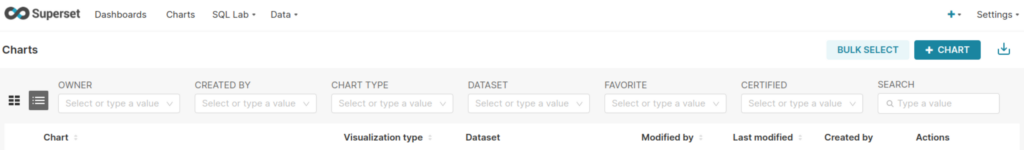
- Select the Charts in Superset home and you will see a page that displays list of available charts (if there are any).
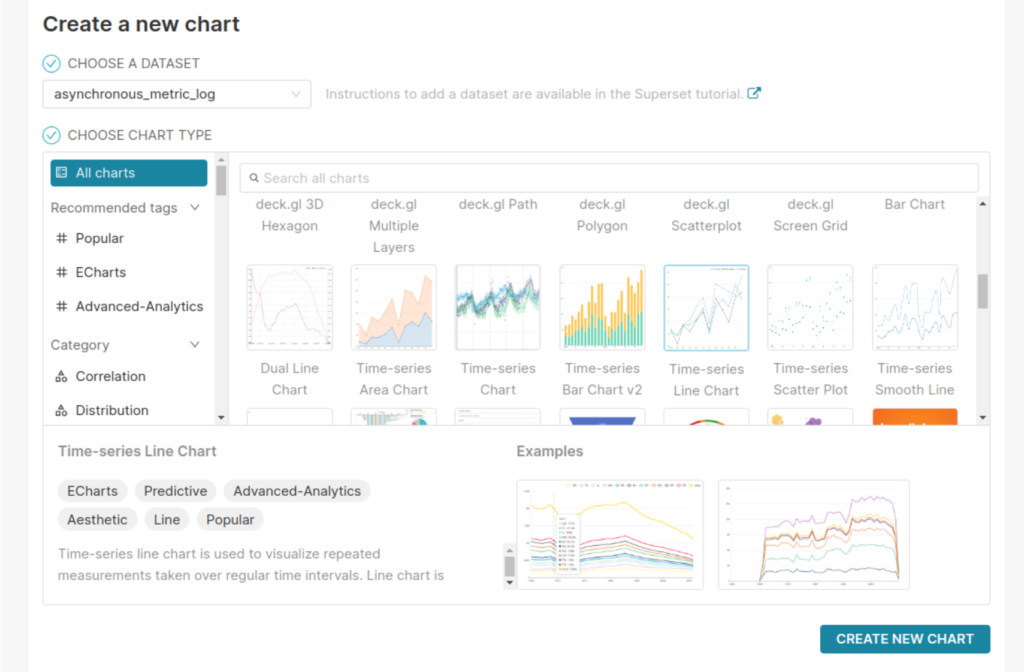
2. Select the Add Chart button on the top right corner of the page. the following page will be displayed.
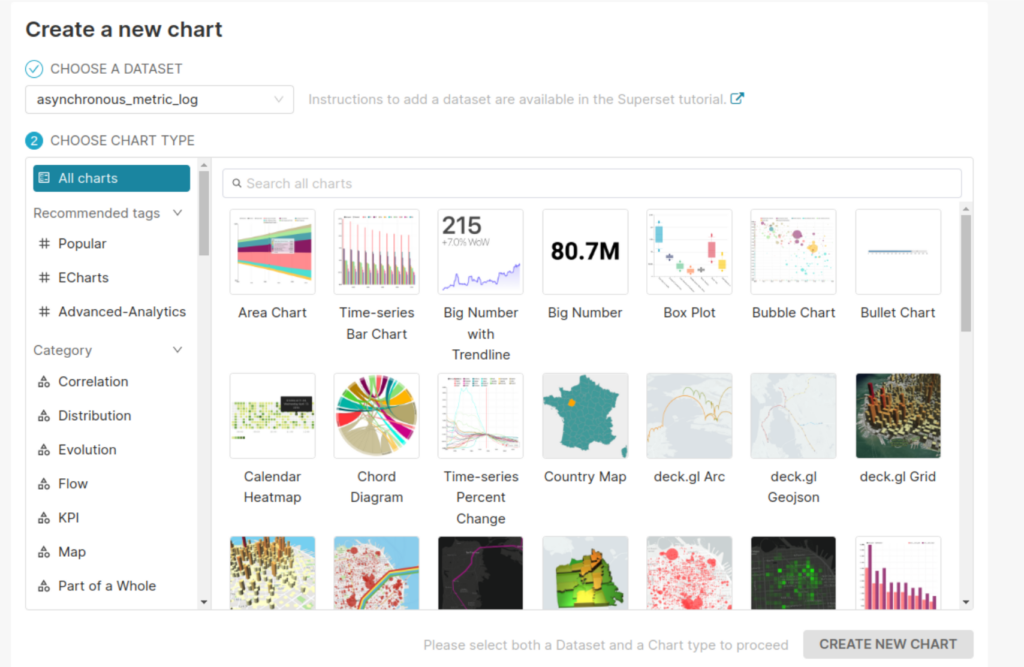
3. Select the type of chart and hit the CREATE NEW CHART button
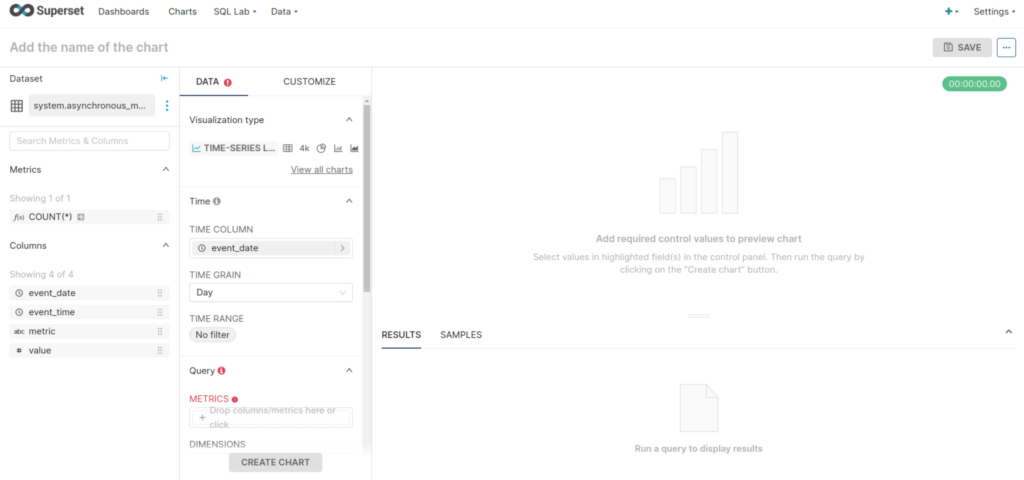
4. You will be taken to the screen where we can configure our chart. You can also preview the chart before saving it. Add a name and save the chart when it is ready.
Dashboards
Dashboards are collection of related charts. To create a dashboard in Apache Superset, you can follow these steps.
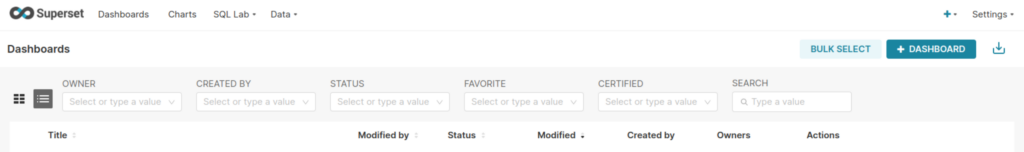
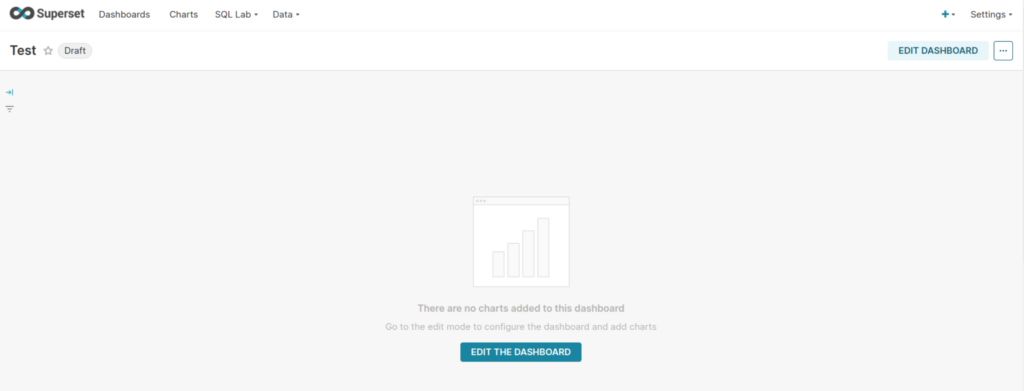
- Select the Dashboards section in the Apache Superset home page. You will be take to the dashboards page.
2. Select the create dashboard button on the top right of the page. provide a name and save the dashboard.
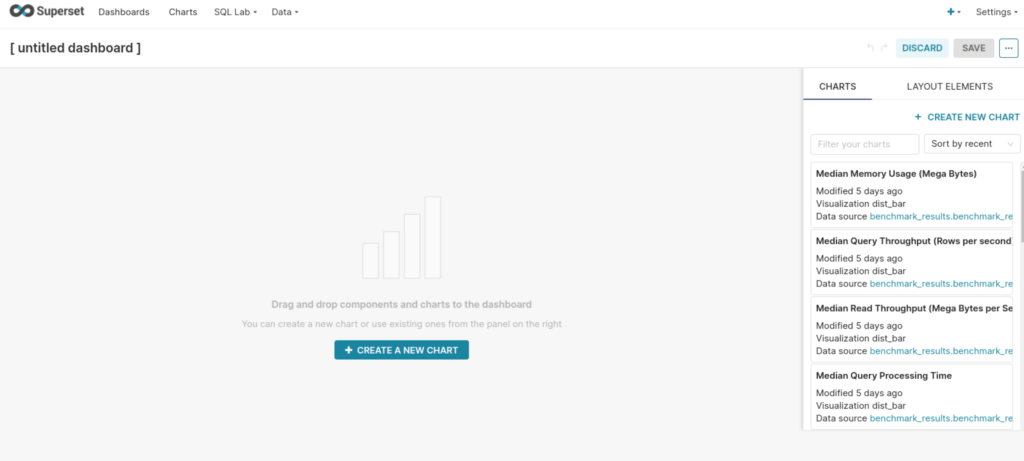
3. Select Edit Dashboard option
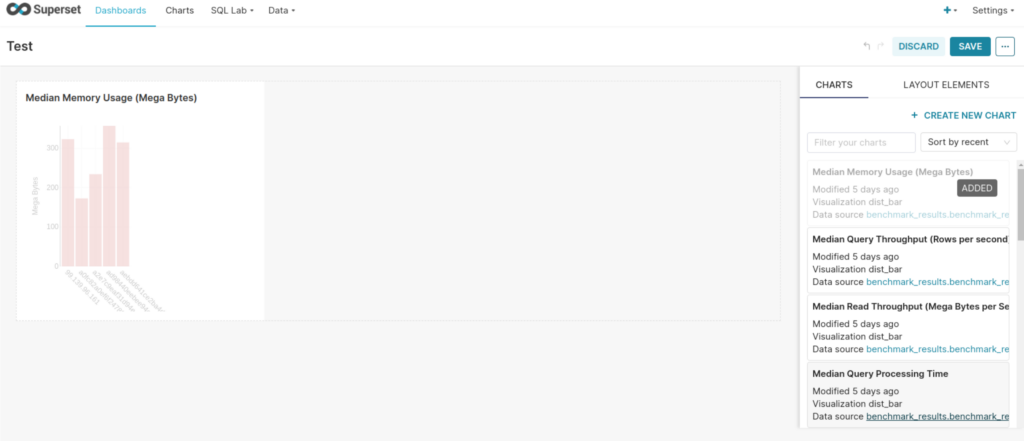
4. You can add the saved charts by dragging and dropping the charts that are listed on the right. You can also resize and edit the chart position in the dashboard.
Conclusion
Apache Superset is a super fast tool for data visualization and exploration. In this series, we have seen how to connect ChistaDATA’s cloud DBAAS to Apache Superset, explore the data, create visualizations and dashboards. You can sign up for ChistaDATA Cloud and try out with Apache Superset to test the steps explained in this series.
To read more on ChistaDATA Cloud, do consider reading the following articles:
- Get Started with ChistaDATA Cloud for ClickHouse: Part 1
- Connecting ChistaDATA Cloud for ClickHouse with Python
- Get Started with ChistaDATA Cloud for ClickHouse: Part 2