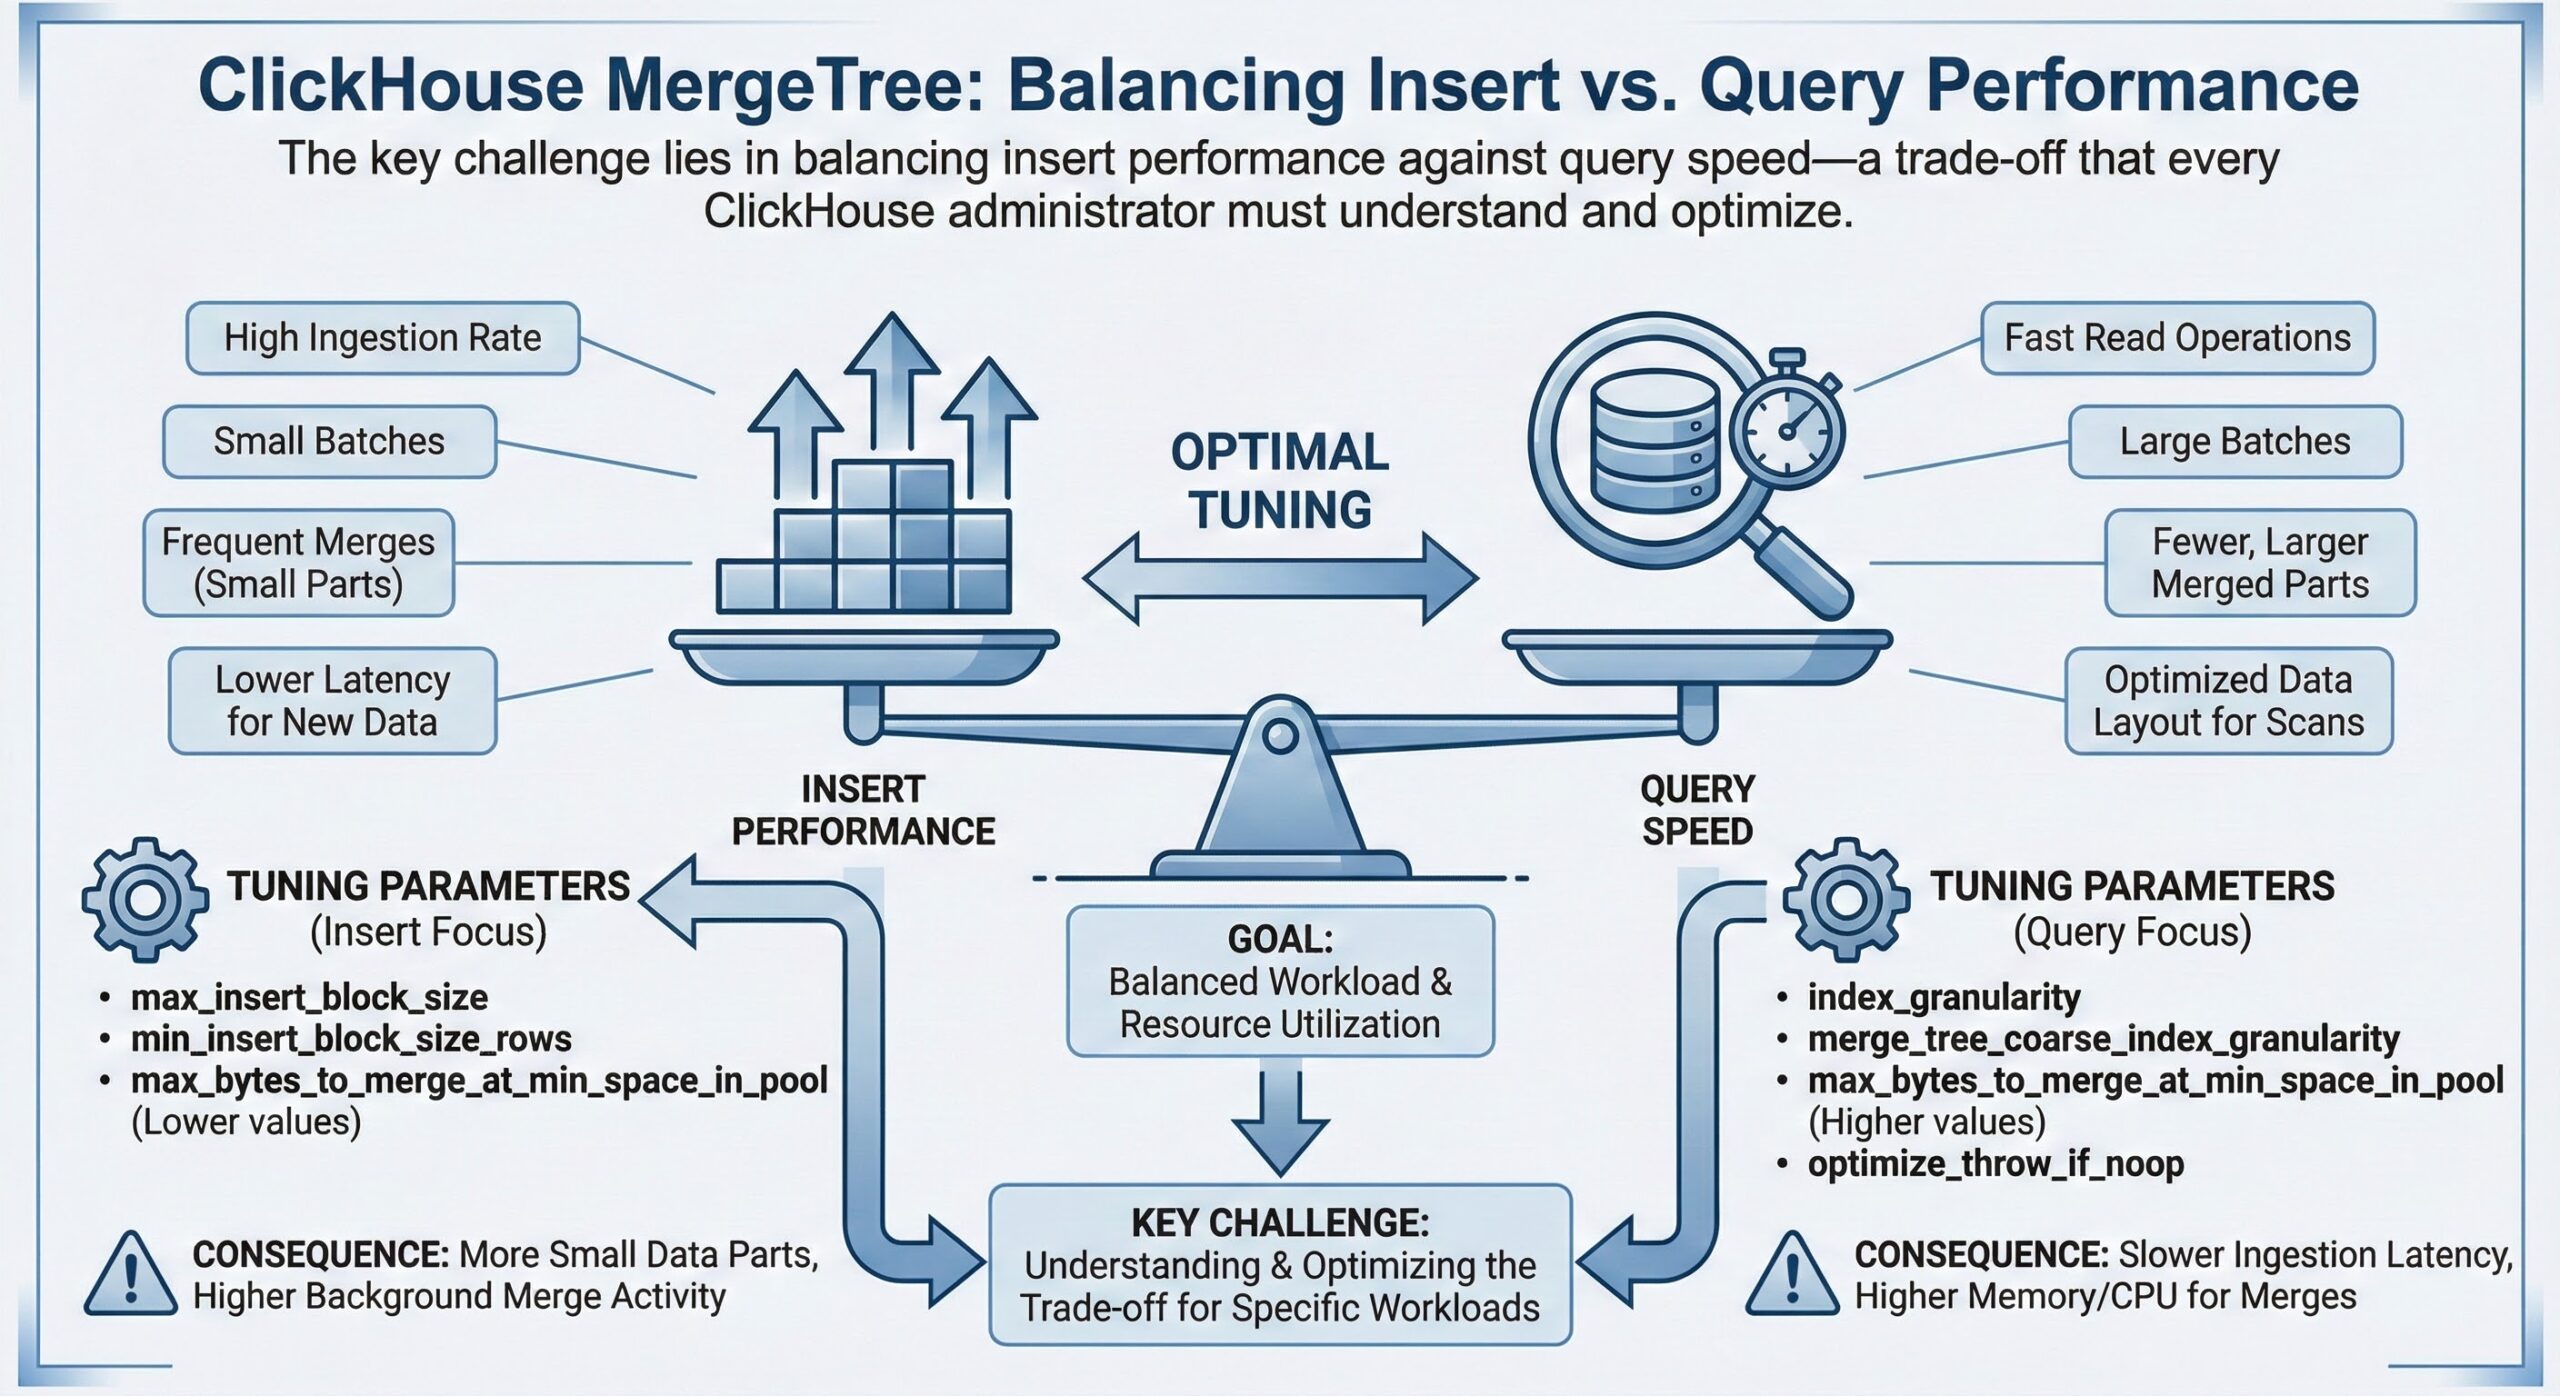
In ClickHouse, the MergeTree engine family is the cornerstone of high-performance data storage and querying. However, achieving optimal performance requires careful tuning of merge-related settings. The key challenge lies in balancing insert performance against query speed—a trade-off that every ClickHouse administrator must understand and optimize for their specific workload.
Understanding MergeTree Parts and Merge Behavior
When data is inserted into a MergeTree table, ClickHouse creates data “parts”—individual directories containing the data files. Each INSERT operation typically creates one or more parts. Over time, ClickHouse’s background merge process combines these smaller parts into larger ones, improving query performance by reducing the number of files that need to be read.
The merge process is crucial because:
• Too many parts degrades query performance (ClickHouse must read from multiple files)
• Too few parts means slower inserts (merge operations consume I/O and CPU resources)
• Uncontrolled part growth can lead to the dreaded “Too many parts” error
Key MergeTree Settings for Performance Tuning
1. parts_to_throw_insert
This setting controls the maximum number of active parts allowed in a partition before ClickHouse rejects new inserts with an exception.
Default value: 300
How it works:
• When a partition reaches this threshold, ClickHouse throws an exception: “Too many parts (300). Merges are processing significantly slower than inserts.”
• This is a safety mechanism to prevent query performance degradation
• It forces you to either wait for merges to complete or tune your merge settings
When to increase parts_to_throw_insert:
For high-throughput streaming workloads where inserts arrive faster than merges can keep up, you may need to increase this value. However, this comes with trade-offs:
Example configuration for high-throughput workloads:
<merge_tree>
<parts_to_throw_insert>600</parts_to_throw_insert>
<parts_to_delay_insert>300</parts_to_delay_insert>
</merge_tree>
In this configuration:
• Inserts are delayed (but not rejected) when parts exceed 300
• Inserts are rejected when parts exceed 600
• This gives the merge process more breathing room for high-volume scenarios
2. background_pool_size
This setting controls the number of threads allocated for background merge operations.
Default value: 16
How it works:
• More threads = faster merges = lower part counts = better query performance
• However, more threads consume more CPU and I/O resources
• Too many threads can starve query processing threads and degrade overall performance
Tuning guidance:
• For systems with many CPU cores (32+) and fast storage (NVMe SSD), consider increasing to 24-32 threads
• For systems with limited I/O bandwidth, keep the default or reduce it
• Monitor CPU and I/O utilization during peak merge periods
Configuration example:
<background_pool_size>24</background_pool_size>
3. max_bytes_to_merge_at_max_space_in_pool
This setting controls the maximum size of parts that can be merged.
Default value: 150 GB
Why it matters:
• Larger merges take longer but are more efficient
• Smaller merges complete faster but may result in more frequent operations
• For tables with very large parts, you may need to increase this limit
The Insert/Query Performance Trade-Off
Understanding the fundamental trade-off is essential:
High Insert Performance Configuration:
• Higher parts_to_throw_insert (allows more unmerged parts)
• Lower background_pool_size (fewer resources spent on merges)
• Result: Fast inserts but slower queries (more parts to scan)
High Query Performance Configuration:
• Lower parts_to_throw_insert (forces frequent merges)
• Higher background_pool_size (aggressive merging)
• Result: Slower inserts but faster queries (fewer parts to scan)
Balanced Configuration Example:
For most production workloads, a balanced approach works best:
<merge_tree>
<parts_to_throw_insert>400</parts_to_throw_insert>
<parts_to_delay_insert>200</parts_to_delay_insert>
</merge_tree>

<background_pool_size>20</background_pool_size>
<background_merges_mutations_concurrency_ratio>2</background_merges_mutations_concurrency_ratio>
This configuration:
• Provides headroom for burst insert traffic
• Maintains reasonable query performance
• Uses 20 threads for merge operations
• Allows 40 concurrent merge tasks (20 threads × ratio of 2)
Monitoring Merge Queue Depth
Monitoring is crucial to understand if your settings are working effectively. Here are the key metrics to track:
1. Query system.parts to check active parts
SELECT
table,
partition,
count() AS part_count,
sum(rows) AS total_rows,
formatReadableSize(sum(bytes_on_disk)) AS total_size
FROM system.parts
WHERE active = 1
GROUP BY table, partition
ORDER BY part_count DESC
LIMIT 10;
What to look for:
• Partitions with consistently high part counts (>100) indicate merge pressure
• Sudden spikes suggest burst insert traffic
• Compare against your parts_to_throw_insert threshold
2. Monitor merge queue
SELECT
table,
count() AS queued_merges,
sum(parts_to_merge) AS total_parts_to_merge,
formatReadableSize(sum(size_in_bytes)) AS total_merge_size
FROM system.merges
GROUP BY table;
Key insights:
• Non-zero queued_merges indicates active merge work
• Growing queue depth suggests merges can’t keep up with inserts
• Large total_merge_size indicates I/O-intensive merge operations
3. Track background pool utilization
SELECT
metric,
value
FROM system.metrics
WHERE metric LIKE '%BackgroundPool%'
ORDER BY metric;
Important metrics:
• BackgroundPoolTaskActive: Currently running merge threads
• BackgroundMergesAndMutationsPoolTask: Queued merge tasks
If BackgroundPoolTaskActive consistently equals background_pool_size, your merge threads are saturated.
Practical Tuning Workflow
Follow this systematic approach when tuning your MergeTree settings:
Step 1: Establish Baseline Metrics
• Run the monitoring queries above during normal operations
• Record typical part counts, merge queue depth, and query latencies
• Note CPU and I/O utilization patterns
Step 2: Identify the Bottleneck
• Are you hitting “Too many parts” errors? → Increase parts_to_throw_insert
• Are merge threads saturated? → Increase background_pool_size
• Are queries slow but inserts fast? → Decrease parts_to_throw_insert or increase background_pool_size
• Are inserts slow but queries fast? → Increase parts_to_throw_insert or decrease background_pool_size
Step 3: Make Incremental Changes
• Adjust settings by 25-50% at a time
• Wait for at least one full merge cycle (typically 10-30 minutes)
• Re-measure metrics
Step 4: Validate and Iterate
• Compare new metrics against baseline
• Ensure both insert and query performance meet SLAs
• Continue adjusting until you find the sweet spot
Common Scenarios and Recommended Settings
Scenario 1: Real-Time Analytics with Streaming Data
Workload characteristics:
• Continuous high-volume inserts (thousands per second)
• Query latency requirements: <1 second
• Recent data is queried most frequently
Recommended settings:
<merge_tree>
<parts_to_throw_insert>500</parts_to_throw_insert>
<parts_to_delay_insert>250</parts_to_delay_insert>
</merge_tree>
<background_pool_size>24</background_pool_size>
Scenario 2: Batch ETL Workloads
Workload characteristics:
• Periodic bulk inserts (hourly or daily)
• Query-heavy during business hours
• Lower insert concurrency
Recommended settings:
<merge_tree>
<parts_to_throw_insert>200</parts_to_throw_insert>
<parts_to_delay_insert>100</parts_to_delay_insert>
</merge_tree>
<background_pool_size>16</background_pool_size>
Scenario 3: Mixed Workload (Balanced)
Workload characteristics:
• Moderate insert rate with occasional spikes
• Mix of analytical and operational queries
• Need to balance both insert and query performance
Recommended settings:
<merge_tree>
<parts_to_throw_insert>350</parts_to_throw_insert>
<parts_to_delay_insert>175</parts_to_delay_insert>
</merge_tree>
<background_pool_size>20</background_pool_size>
Best Practices and Final Recommendations
1. Don’t Over-Tune: Start with defaults and only adjust when you have clear evidence of a problem. Premature optimization can introduce unnecessary complexity.
2. Monitor Continuously: Set up alerts for high part counts and merge queue depth. Proactive monitoring prevents performance degradation.
3. Consider Hardware: Settings should be tuned based on your hardware capabilities. Fast NVMe SSDs allow for more aggressive merging.
4. Partition Strategy Matters: Well-designed partitioning reduces the parts per partition, making merge tuning easier.
5. Test Under Load: Always test configuration changes under realistic workload conditions before deploying to production.
6. Document Your Changes: Keep a record of what settings you changed, why you changed them, and what impact they had.
Conclusion
Tuning MergeTree settings is both an art and a science. The key is understanding the insert/query performance trade-off and using data-driven monitoring to find the optimal balance for your specific workload. By carefully adjusting parts_to_throw_insert, background_pool_size, and related settings, you can significantly improve ClickHouse performance.
Remember: there’s no one-size-fits-all configuration. Start with the recommendations in this guide, monitor your metrics closely, and iterate until you achieve the performance your application requires.
Need help optimizing your ClickHouse deployment? ChistaDATA’s expert team specializes in ClickHouse performance tuning and can help you achieve optimal insert and query performance. Contact us for a consultation.
Further Reading
Unlock Blistering Query Speed with ClickHouse LowCardinality
Reduce Query Memory Usage in ClickHouse
PREWHERE vs WHERE in ClickHouse Queries
Connect Prometheus to Your ClickHouse® Cluster