Monitoring Merge Queues in ClickHouse: Detecting and Resolving Merge Pressure
ClickHouse, renowned for its high-performance columnar storage and analytical query capabilities, relies heavily on its underlying Log-Structured Merge-Tree (LSM-Tree) architecture to achieve exceptional write throughput and efficient data compression. However, this very architecture introduces a critical background process: data part merges. While merges are essential for maintaining query performance and storage efficiency, unmonitored or excessive merge activity can lead to a condition known as “merge pressure,” which can severely degrade cluster performance. This comprehensive guide delves into the intricacies of ClickHouse’s merge system, providing a detailed roadmap for monitoring merge queues, detecting the early signs of pressure, diagnosing root causes, and implementing effective resolution strategies. By proactively managing merge operations, database administrators and engineers can ensure their ClickHouse clusters remain stable, responsive, and performant under heavy workloads.
Understanding the LSM-Tree Architecture and the Merge Imperative
At the heart of ClickHouse’s design is the LSM-Tree, a data structure optimized for write-heavy workloads. Unlike traditional B-trees that update data in-place, LSM-trees write new data sequentially to immutable files, often called “parts” or “SSTables” (Sorted String Tables). This approach minimizes random disk I/O during writes, allowing ClickHouse to ingest data at remarkable speeds, often saturating network or disk bandwidth.
When a user inserts data into a ClickHouse table, the data does not immediately become part of a large, consolidated file. Instead, the insertion process follows a multi-stage path:
- Write-Ahead Log (WAL) and Memory Buffer: The incoming data is first written to a write-ahead log for durability and then placed into an in-memory buffer.
- Flush to Disk as a Part: Once the in-memory buffer reaches a certain size (or after a configurable timeout), its contents are flushed to disk as a new, immutable data part. This part contains the data in a compressed, columnar format.
- Accumulation of Parts: As more data is inserted, more small parts are created and stored in the table’s directory on the filesystem.
While this process is highly efficient for writes, it creates a significant problem for reads. A query requesting data over a time range might need to scan dozens, hundreds, or even thousands of these small, separate parts. Reading from many small files is much slower than reading from fewer, larger files due to the overhead of opening files, seeking, and decompressing data. This is where the merge process becomes absolutely critical.
The ClickHouse background merge process is responsible for periodically combining these smaller parts into larger, more consolidated ones. This process serves several vital functions:
- Improved Query Performance: By reducing the number of parts a query must scan, merge operations drastically decrease the I/O and CPU overhead of read operations. Fewer parts mean fewer file handles, fewer seeks, and more efficient use of vectorized query execution.
- Enhanced Data Compression: Larger parts generally achieve better compression ratios. When smaller parts are merged, the resulting larger part can be compressed more effectively, leading to significant storage savings.
- Data Deduplication (for ReplacingMergeTree): For tables using the *MergeTreefamily, particularly ReplacingMergeTree and VersionedCollapsingMergeTree, merges are the mechanism by which duplicate rows (with the same primary key) are removed, keeping the dataset clean and accurate.
- TTL (Time-To-Live) Enforcement: When a table has a TTL rule defined (e.g., TTL event_date + INTERVAL 30 DAY), the merge process is responsible for identifying and removing data that has expired, freeing up disk space.
The merge process is not a single monolithic task but a continuous, background operation managed by a merge scheduler. This scheduler decides which parts to merge, when to merge them, and how many merge operations can run concurrently. It operates based on a set of heuristics and configurable limits to balance the need for consolidation against the resource cost of performing the merges.
The Anatomy of a Merge Operation
A merge operation in ClickHouse is a resource-intensive process that involves reading data from multiple source parts, combining the data according to the table’s sorting key, applying any necessary transformations (like deduplication), compressing the result, and writing it to a new, larger part on disk. Understanding the steps involved helps in diagnosing performance bottlenecks.
- Selection: The merge scheduler selects a set of parts that are eligible to be merged. The selection criteria are complex and depend on the table’s settings, the size of the parts, the number of parts, and the type of merge needed (e.g., regular merge, TTL merge, deduplication merge).
- Reading: The merge process reads the data from the selected source parts. This involves decompressing the data from each part and loading it into memory for processing. The I/O cost here is the sum of the sizes of all source parts.
- Sorting and Merging: The data from the source parts is merged in a way that preserves the table’s primary key order. For ReplacingMergeTree, rows with the same primary key are processed to keep only the most recent version based on the version column. This step is CPU-intensive, requiring significant computational power to sort and combine the data streams.
- Compression: The merged, sorted data is then compressed using the table’s specified compression codec (e.g., LZ4, ZSTD). This step is also CPU-intensive, as modern compression algorithms require substantial processing to achieve high compression ratios.
- Writing: The final, compressed data is written to a new part file on disk. This is a sequential write operation, which is generally fast on modern storage, but the total volume of data written is equal to the size of the new, merged part.
- Commit and Cleanup: Once the new part is successfully written, the merge is committed. The metadata is updated to reflect that the new part now contains the data, and the old source parts are marked for deletion. A subsequent background process, the “part cleaner,” will eventually remove these obsolete parts from the filesystem.
The total resource cost of a single merge is substantial. The I/O write amplification is particularly noteworthy: for a merge that combines parts totaling 100GB, the process might read 100GB (the sources), write 100GB (the new part), and then later delete the 100GB of source parts. This results in 200GB of write I/O for 100GB of “net” data. If many large merges occur simultaneously, this can saturate the disk’s write bandwidth, leaving little capacity for new data inserts or other operations.
Identifying Merge Pressure: The Symptoms of an Overloaded System
Merge pressure occurs when the rate at which new parts are being created by incoming writes exceeds the rate at which the background merge process can consolidate them. This imbalance leads to an ever-growing number of small parts, which in turn creates a vicious cycle that degrades performance. Recognizing the symptoms of merge pressure is the first step toward resolution.
Exponential Growth in Part Count
The most direct indicator of merge pressure is a rapidly increasing number of active parts in a table or across the entire database. A healthy ClickHouse table typically has a relatively stable number of parts, with new small parts being created and then quickly merged into larger ones. Under merge pressure, the number of parts grows linearly or even exponentially over time. This can be observed by regularly querying the system.parts table and plotting the count of active parts.
Prolonged Query Latencies
As the number of parts increases, the performance of SELECT queries deteriorates. Queries that once returned in milliseconds may start taking seconds or even minutes. This is because each query must open, seek, and decompress data from a much larger number of files. The overhead from managing thousands of file handles and performing thousands of small I/O operations can overwhelm the CPU and I/O subsystems. Queries that scan large portions of the dataset are the most affected, but even point queries can slow down if the primary key index becomes fragmented across too many parts.
High CPU Utilization
Merge operations are CPU-intensive, primarily due to the sorting, deduplication, and compression steps. When merge pressure is high, the system may be running many concurrent merges, consuming a large portion of the available CPU capacity. This high CPU usage is not always visible as a single spike; it can manifest as a sustained, high baseline utilization. This leaves fewer CPU cycles for query execution, further exacerbating query latency. It’s important to distinguish between CPU usage from queries and CPU usage from merges, which can be done by correlating CPU metrics with the number of active merges.
Disk I/O Saturation
The write amplification inherent in the merge process can lead to disk I/O saturation. If the combined write throughput of new data inserts and ongoing merge operations exceeds the maximum write bandwidth of the underlying storage (e.g., NVMe SSDs, SATA SSDs, or HDDs), the system becomes I/O-bound. This can be observed as high disk utilization (e.g., await or %util in iostat), long write latencies, and a backlog of I/O operations. When the disk is saturated, even simple operations can become slow, and the system may become unresponsive.
Increased Memory Pressure
While ClickHouse is designed to be memory-efficient, large merge operations can consume significant amounts of RAM. The merge process needs to buffer data from the source parts, perform sorting in memory, and hold the compressed output before writing it to disk. If many large merges are running simultaneously, they can exhaust the available memory, potentially leading to swapping, which will catastrophically degrade performance. Monitoring the system’s memory usage and correlating it with merge activity is crucial.
Backpressure on Data Ingestion
In severe cases of merge pressure, the system may not be able to keep up with the incoming write load. ClickHouse has built-in mechanisms to apply backpressure, which can cause INSERT operations to slow down or even fail with timeouts. This is a critical symptom, as it means the data pipeline itself is breaking down. The system.processes table might show INSERT queries waiting for resources, and client applications may report write failures.
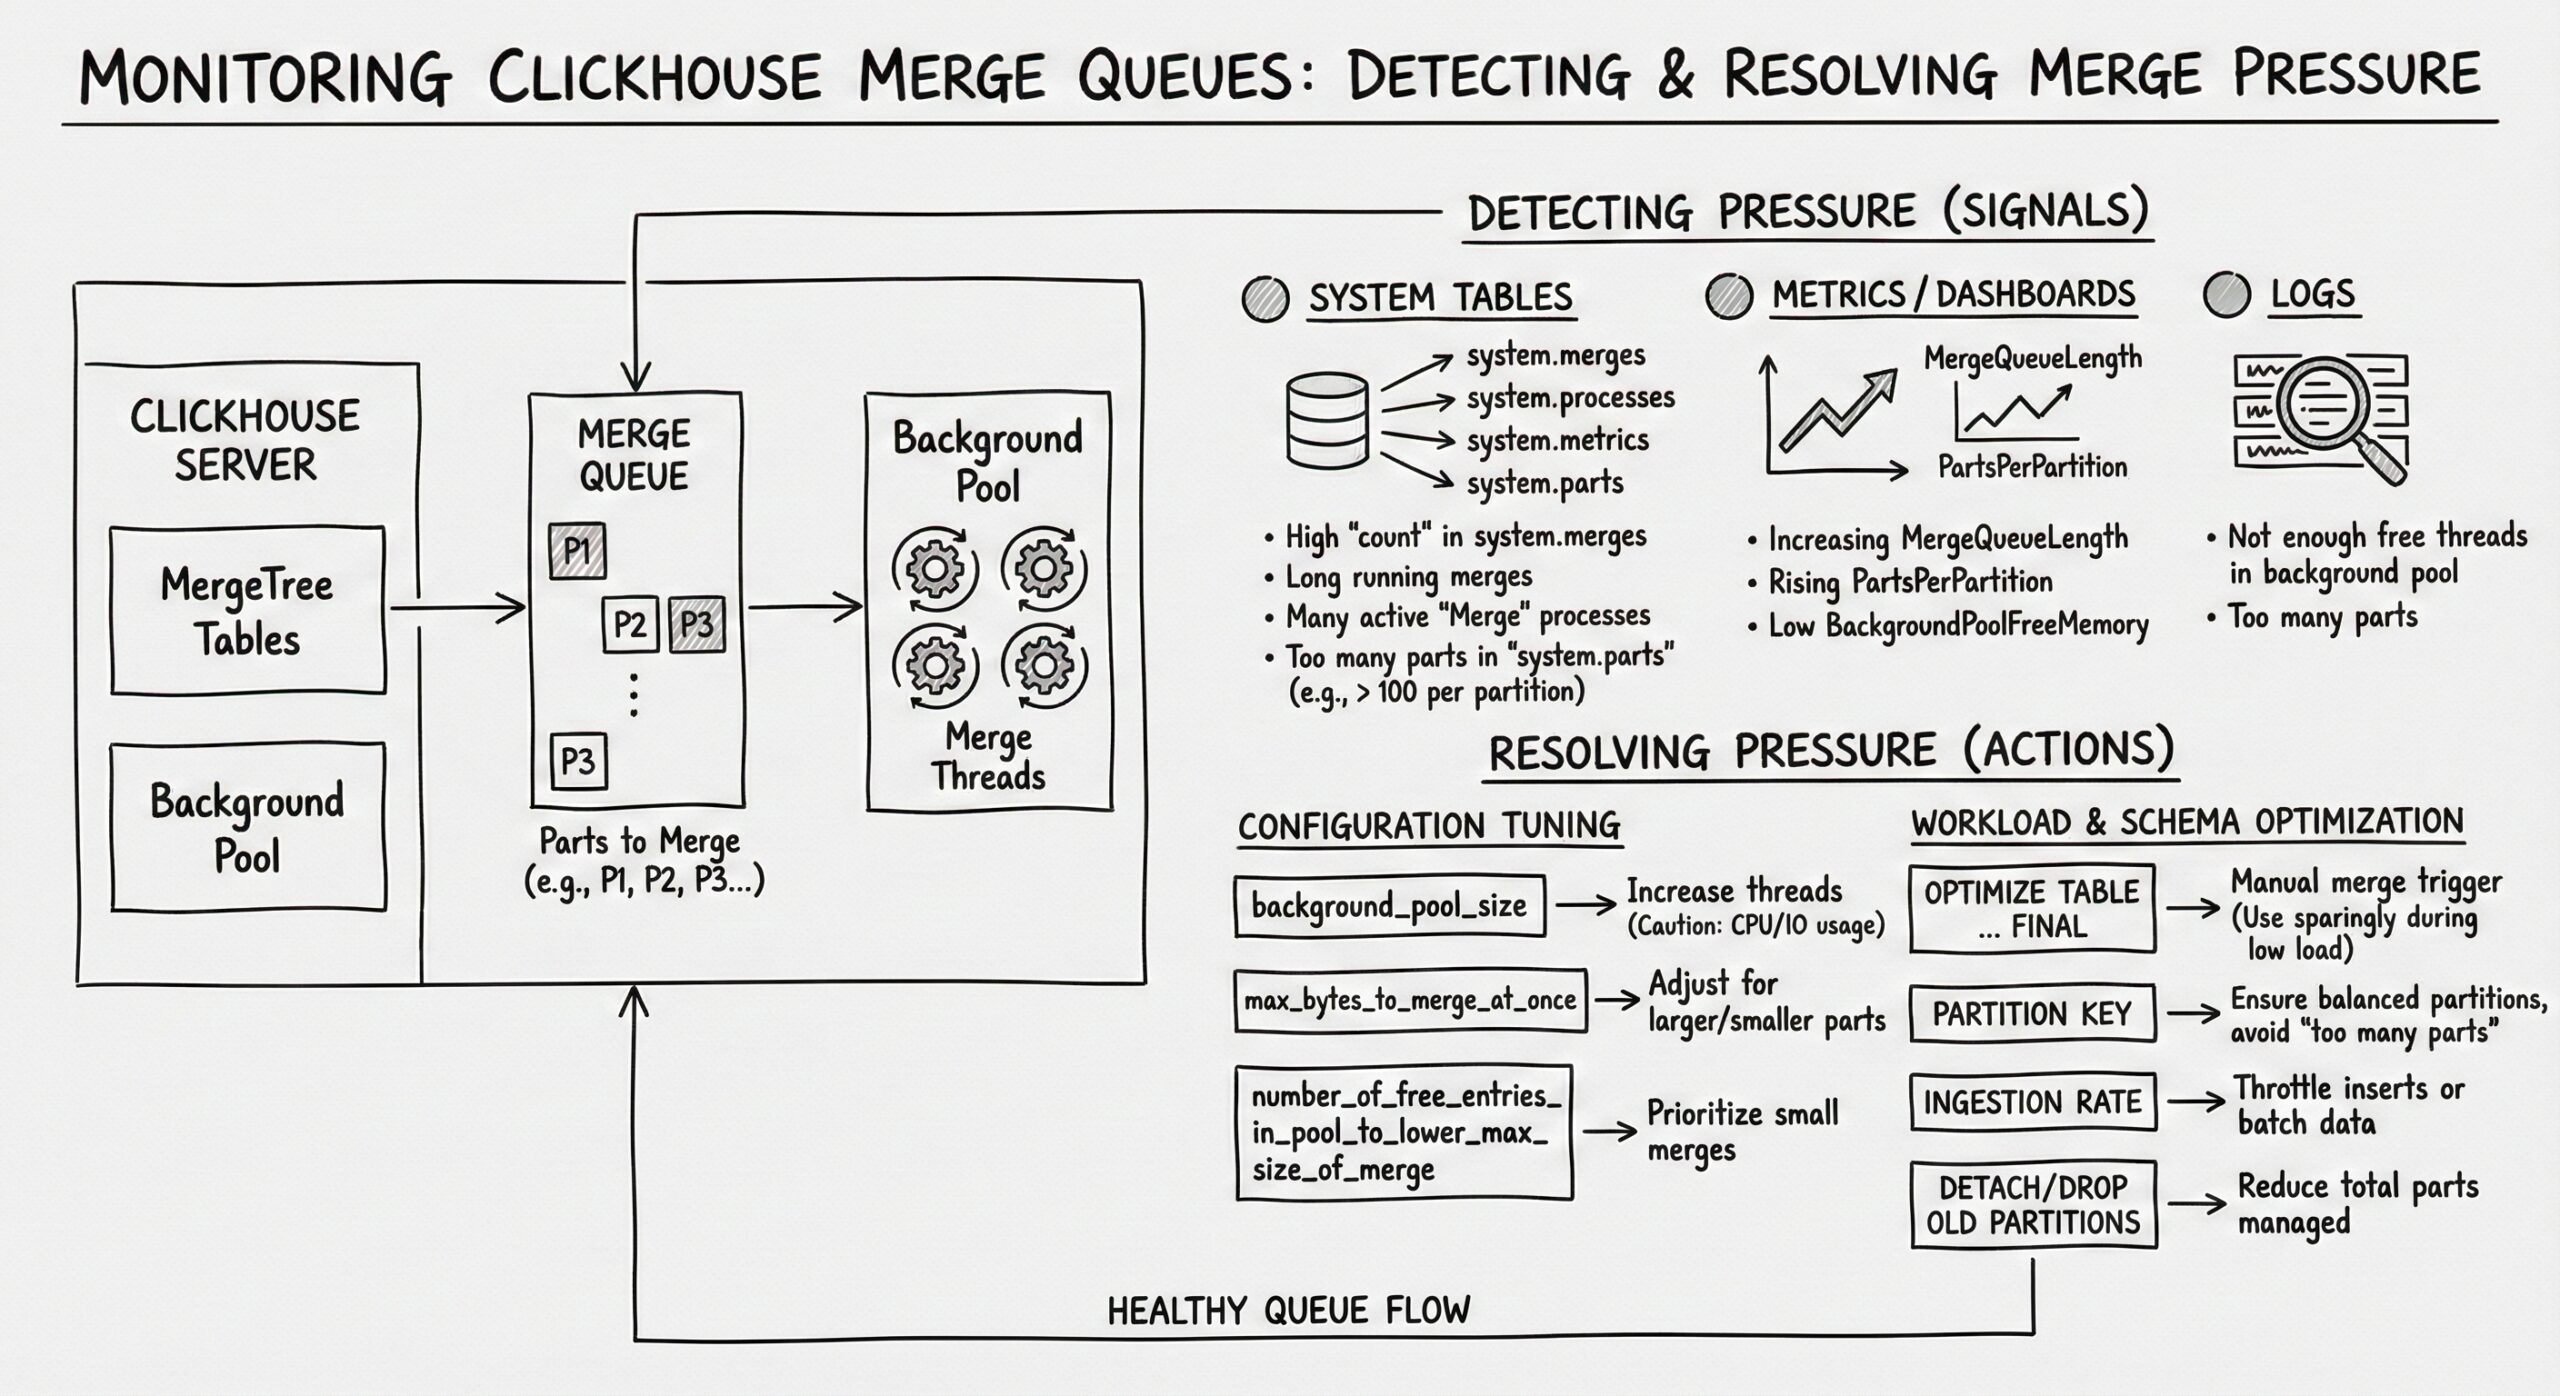
Monitoring Merge Queues: Leveraging System Tables
ClickHouse provides two primary system tables for monitoring the state of the merge process: system.parts and system.merges. These tables offer a real-time view into the health of the data parts and the ongoing merge operations, serving as the foundation for any monitoring strategy.
Querying system.parts for Part Health
The system.parts table contains a row for every data part in every table on the server. It is the most important source of information for detecting the early signs of merge pressure. The following query is a fundamental diagnostic tool:
SELECT
    database,
    table,
    count() AS active_parts,
    sum(rows) AS total_rows,
    formatReadableSize(sum(bytes_on_disk)) AS disk_size,
    min(min_date) AS oldest_part,
    max(max_date) AS newest_part
FROM system.parts
WHERE active = 1
GROUP BY database, table
ORDER BY active_parts DESC
LIMIT 10;
This query provides a high-level overview of the tables with the most active parts. The active_parts column is the key metric. A commonly cited threshold for concern is when a single table has more than 100 active parts. While this number is not a hard rule (it depends on the table’s size, query patterns, and hardware), it serves as a useful rule of thumb. A table with thousands of active parts is almost certainly under significant merge pressure.
To get a more granular view, you can drill down into a specific table:
SELECT
    name,
    rows,
    formatReadableSize(bytes_on_disk) AS size_on_disk,
    modification_time,
    partition_id,
    level
FROM system.parts
WHERE
    database = 'your_database' AND
    table = 'your_table' AND
    active = 1
ORDER BY bytes_on_disk ASC; -- Look for many small parts
This query lists all active parts for a given table, sorted by size. Under normal conditions, you should see a mix of part sizes, with a few very large parts and a smaller number of newer, smaller parts. Under merge pressure, you will see a long tail of very small parts (e.g., a few MB or less), indicating that the merge process is not keeping up. The level column indicates the “generation” of the part; higher levels generally mean the part has been merged more times and is larger.
Tracking Active Merges with system.merges
While system.parts tells you about the state of the data, system.merges provides a live view of the merge operations currently in progress. This table is essential for diagnosing what the system is doing right now and whether merges are progressing normally.
SELECT
    database,
    table,
    elapsed AS merge_duration_seconds,
    formatReadableSize(progress * total_size_bytes) AS processed_bytes,
    formatReadableSize(total_size_bytes) AS total_input_size,
    round(progress * 100, 2) AS progress_pct,
    formatReadableSize(memory_usage) AS memory_used,
    thread_id
FROM system.merges
ORDER BY total_size_bytes DESC;
This query shows all currently running merges, ordered by the total size of data they are processing. Key columns to monitor include:
- merge_duration_seconds: How long the merge has been running. A merge that has been running for hours or days is a red flag and may indicate a problem.
- progress_pct: The percentage of the merge that has been completed. A merge that is stuck at a low percentage for a long time might be I/O or CPU-bound.
- total_input_size: The combined size of all source parts. This indicates the scale of the merge operation. Large merges (e.g., hundreds of GB or TB) are normal for large tables but require significant resources.
- memory_used: The amount of RAM the merge process is consuming.
A healthy system will have a small number of merges running at any given time (dictated by the max_replicated_merges_in_queue and max_non_replicated_merges_in_queuesettings). If you see dozens of merges running simultaneously, it is a sign that the system is trying to catch up and is under significant load.
Setting Up Proactive Alerts for Unhealthy Thresholds
Reactive monitoring, where you investigate problems after users complain, is insufficient for maintaining a high-availability ClickHouse cluster. A robust monitoring strategy requires proactive alerts that notify administrators of potential issues before they impact performance. Based on the metrics from system.parts and system.merges, several key thresholds can be established.
Alert: High Active Part Count
The primary alert should be triggered when the number of active parts in a critical table exceeds a predefined threshold. As mentioned, a common starting point is 100 parts, but this should be tuned based on the specific table.
An alerting query might look like:
SELECT
    concat(database, '.', table) AS table_name,
    count() AS active_parts
FROM system.parts
WHERE
    active = 1 AND
    database NOT IN ('system')
GROUP BY database, table
HAVING active_parts > 100; -- Threshold
This query should be run at regular intervals (e.g., every minute) by a monitoring system like Prometheus (with ClickHouse Exporter), Zabbix, or Datadog. When the query returns results, an alert should be fired. For very large tables, the threshold might be set higher (e.g., 500 or 1000), while for smaller, latency-sensitive tables, a lower threshold (e.g., 50) might be appropriate.
Alert: Long-Running Merges
A merge operation that runs for an exceptionally long time can monopolize resources and block other merges from starting. An alert should be set for merges that exceed a reasonable duration.
SELECT
    concat(database, '.', table) AS table_name,
    merge_type,
    elapsed AS duration_seconds
FROM system.merges
WHERE elapsed > 3600; -- Alert if a merge runs longer than 1 hour
The threshold for “long-running” depends on the data size and hardware. On a system with fast NVMe storage, a 1TB merge might complete in under an hour. On a system with slower HDDs, even a 100GB merge might take hours. The threshold should be set based on historical performance data.
Alert: Stalled Merges
A merge that shows no progress over a significant period is effectively stalled. This can happen due to resource starvation, filesystem issues, or software bugs.
Monitoring for stalled merges is more complex, as it requires comparing the progressvalue over time. A monitoring system would need to store the progress of each merge (identified by a combination of database, table, and part_name or thread_id) and alert if the progress has not increased by a certain percentage (e.g., 1%) over a defined window (e.g., 10 minutes).
Alert: High Merge Queue Depth
ClickHouse maintains internal queues for merges that are scheduled but not yet running. A growing queue depth indicates that the system cannot start new merges as fast as they are being queued, a clear sign of merge pressure.
This information is available in the system.replication_queue table for replicated tables and can be inferred from the difference between the number of parts that need merging and the number of active merges for non-replicated tables. A direct query for replicated tables is:
SELECT
    database,
    table,
    count() AS queue_depth
FROM system.replication_queue
WHERE
    merge_type != '' AND
    create_time < now() - INTERVAL 5 MINUTE -- Ignore very recent items
GROUP BY database, table
HAVING queue_depth > 10; -- Alert if more than 10 merge tasks are queued
A queue depth of more than 10-20 items for a prolonged period warrants investigation.
Diagnosing the Root Causes of Merge Slowdowns
Detecting merge pressure is only half the battle. The next step is to diagnose why the merges are not keeping up. The causes can be broadly categorized into configuration issues, hardware bottlenecks, and data ingestion patterns.
Configuration Bottlenecks
ClickHouse’s merge process is governed by a series of settings that control concurrency, resource limits, and scheduling. Misconfigured settings are a common cause of merge slowdowns.
- max_replicated_merges_in_queue and max_non_replicated_merges_in_queue: These settings limit the number of merge tasks that can be in the queue. If these values are too low, merge tasks can be dropped, preventing necessary consolidations. The default values are usually sufficient, but in high-write environments, they may need to be increased.
- max_replicated_merges_to_execute and max_non_replicated_merges_to_execute: These control the maximum number of merge processes that can run simultaneously. If these are set too low, the system cannot utilize available CPU and I/O resources effectively. The optimal value is typically equal to the number of CPU cores, but it should be tuned based on the storage performance. For very fast NVMe arrays, a higher value might be beneficial.
- number_of_free_entries_in_pool_to_execute_mutation and number_of_free_entries_in_pool_to_execute_merges: These settings define the size of the thread pools used for merges and mutations. If these pools are too small, merge operations will be delayed waiting for a free thread. These should be set high enough to allow for the maximum number of concurrent merges.
- background_pool_size: This is a global setting that defines the size of the background processing pool, which handles merges, mutations, and other tasks. If this pool is undersized, all background operations will be throttled. It should be set to a value that reflects the total background workload (e.g., 16-32 for a large server).
- merge_tree_min_rows_for_wide_part and merge_tree_min_bytes_for_wide_part: These settings control when ClickHouse uses the “wide” part format (storing columns in a single file) versus the “compact” format (storing columns in separate files). The wide format is more efficient for large parts. If these thresholds are set too high, small parts may remain in the less efficient compact format longer than necessary.
Diagnosing configuration issues involves checking the current settings with SELECT * FROM system.settings WHERE name LIKE ‘%merge%’ and comparing them to the observed workload. If the number of active merges is consistently below the maximum allowed, and the system has spare CPU and I/O capacity, the concurrency limits are likely too low.
Hardware and Resource Bottlenecks
The most common cause of slow merges is a lack of sufficient hardware resources. Merges are demanding on CPU, disk I/O, and memory.
- CPU Bottleneck: If the system’s CPU is consistently at 90-100% utilization, and the load average is high, the merge process is likely CPU-bound. The sorting and compression steps are the primary consumers. To confirm, correlate high CPU usage with a high number of active merges. The solution is to either add more CPU cores, optimize the data for better compression (e.g., using a more efficient codec like ZSTD), or reduce the write load.
- Disk I/O Bottleneck: This is perhaps the most frequent bottleneck. Merges generate a massive amount of sequential read and write I/O. If the underlying storage cannot keep up, merges will slow down dramatically. This can be diagnosed using system tools like iostat or iotop. Look for high await (average wait time for I/O requests) or %util (device utilization) on the disk(s) where ClickHouse data is stored. If the disk is saturated, the solution is to upgrade to faster storage (e.g., NVMe SSDs), distribute the data across more disks, or reduce the overall I/O load by tuning the merge settings to run fewer, larger merges.
- Memory Bottleneck: While ClickHouse is designed to use memory efficiently, large merges can require significant RAM. If the system is swapping (using swap space on disk), performance will plummet. Monitor memory usage with free -h or htop. If memory is exhausted, consider adding more RAM, reducing the number of concurrent merges, or ensuring that the max_memory_usage settings are not too restrictive.
- Network Bottleneck (for Replicated Tables): In a replicated cluster, merges on one replica may require downloading parts from another replica. If the network bandwidth between servers is limited, this can slow down the merge process. This is less common but can be a factor in geographically distributed clusters.
Data Ingestion Patterns
The way data is written to ClickHouse can have a profound impact on merge pressure. Poor ingestion practices can create a flood of small parts that overwhelm the merge scheduler.
- Too Frequent Small Inserts: The most common culprit is an application that performs INSERTs for every single event or row. This creates one new part for every insert batch, leading to an explosion of parts. The solution is to batch inserts. Instead of sending 1000 individual INSERTs per second, batch them into larger transactions (e.g., 1000 rows per INSERT). This reduces the number of parts created by orders of magnitude.
- Unsorted Data Ingestion: If the data being inserted is not sorted according to the table’s primary key, the merge process has more work to do. When parts are created from sorted data, merging them is more efficient. If the data is highly disordered, the merge scheduler may create more intermediate, smaller merges to gradually sort the data, increasing the overall merge load.
- High Cardinality Partitioning: While partitioning is a powerful feature for managing data lifecycle and improving query performance, using a partitioning key with very high cardinality (e.g., partitioning by
event_id) can be disastrous. It can lead to thousands of partitions, each with its own set of small parts, making the merge process extremely inefficient. Partitioning should be done on coarse-grained keys like date or region.
Resolving Merge Pressure: Practical Strategies and Best Practices
Once the root cause of merge pressure has been identified, the next step is to implement corrective actions. The goal is to restore balance between the rate of part creation and the rate of part consolidation.
Immediate Mitigation: Manual Merges and Throttling
In an emergency situation where the system is severely degraded, immediate action may be required.
- Manual OPTIMIZE: The OPTIMIZE TABLE command can be used to force a merge of all parts in a table or a specific partition. For example, OPTIMIZE TABLE your_table FINAL; will attempt to merge all parts into a single part. This should be used with extreme caution, as it is a very resource-intensive operation that can lock the table and make it unavailable for queries. It is best used during a maintenance window or on a non-critical replica.
- Throttle Ingestion: If the write load is the primary driver of the problem, the most direct solution is to temporarily reduce the rate of data ingestion. This gives the merge process a chance to catch up. This can be done by pausing data pipelines, reducing the batch size of inserts, or implementing rate limiting in the application.
- Adjust Merge Concurrency: Temporarily increasing the max_replicated_merges_to_execute and related settings can allow the system to run more merges in parallel, helping it clear the backlog faster. This should only be done if the hardware can support the increased load, as it will consume more CPU and I/O.
Long-Term Optimization: Configuration and Architecture
For a sustainable solution, focus on long-term architectural and configuration improvements.
- Optimize Data Ingestion Pipeline: Ensure that all data is ingested in large, sorted batches. Use tools like Kafka Connect with ClickHouse sinks that support batching, or write custom ingestion scripts that buffer data in memory before sending it to ClickHouse in large chunks (e.g., 10,000 to 100,000 rows per INSERT).
- Right-Size Hardware: Invest in hardware that matches the workload. Fast, local NVMe SSDs are highly recommended for ClickHouse. Ensure there are sufficient CPU cores and ample RAM. Consider the storage’s sustained write bandwidth, not just its peak speed.
- Tune Merge Settings: Based on the hardware and workload, fine-tune the merge-related settings. A common starting point is to set max_replicated_merges_to_execute to the number of CPU cores and background_pool_size to 2-4 times that number. Monitor the system and adjust as needed.
- Use Appropriate Table Engines and Settings: Choose the right *MergeTree variant for the use case. For example, use SummingMergeTree or AggregatingMergeTree for pre-aggregated data, which reduces the amount of raw data that needs to be merged. Configure compression codecs appropriately; ZSTD often provides a better compression ratio than LZ4, at the cost of higher CPU usage.
- Implement Data TTL: Use TTL rules to automatically remove old, unused data. This reduces the total dataset size, which in turn reduces the scope and cost of merge operations.
- Regular Maintenance: Schedule regular maintenance windows to perform OPTIMIZE operations on heavily fragmented tables, especially if they are not write-heavy during certain periods.
Conclusion
Monitoring and managing merge queues is a critical aspect of maintaining a high-performance ClickHouse cluster. The LSM-Tree architecture, while enabling incredible write speeds, introduces the complex challenge of background data consolidation. By understanding the merge process, proactively monitoring key metrics like active part count and merge duration, setting up meaningful alerts, and diagnosing the root causes of slowdowns—whether they be configuration, hardware, or ingestion-related—database administrators can prevent merge pressure from degrading system performance. The strategies outlined in this guide, from optimizing data ingestion patterns to right-sizing hardware and tuning configuration settings, provide a comprehensive framework for ensuring that ClickHouse continues to deliver its renowned speed and efficiency, even under the most demanding workloads. A well-monitored merge system is not just a technical detail; it is the foundation of a reliable and performant data analytics platform.
Further Reading
- Setting Up ClickHouse Alerts: Detecting Performance Degradation Before It Impacts Users
- Troubleshooting Disk Space in ClickHouse
- Reduce Query Memory Usage in ClickHouse
- Building a Custom ETL Tool: Technical Implementation for PostgreSQL to ClickHouse Data Movement
- Understanding the OpenTelemetry Collector: A Comprehensive Guide to Modern Telemetry Management