Setting Up ClickHouse Alerts: Detecting Performance Degradation Before It Impacts Users
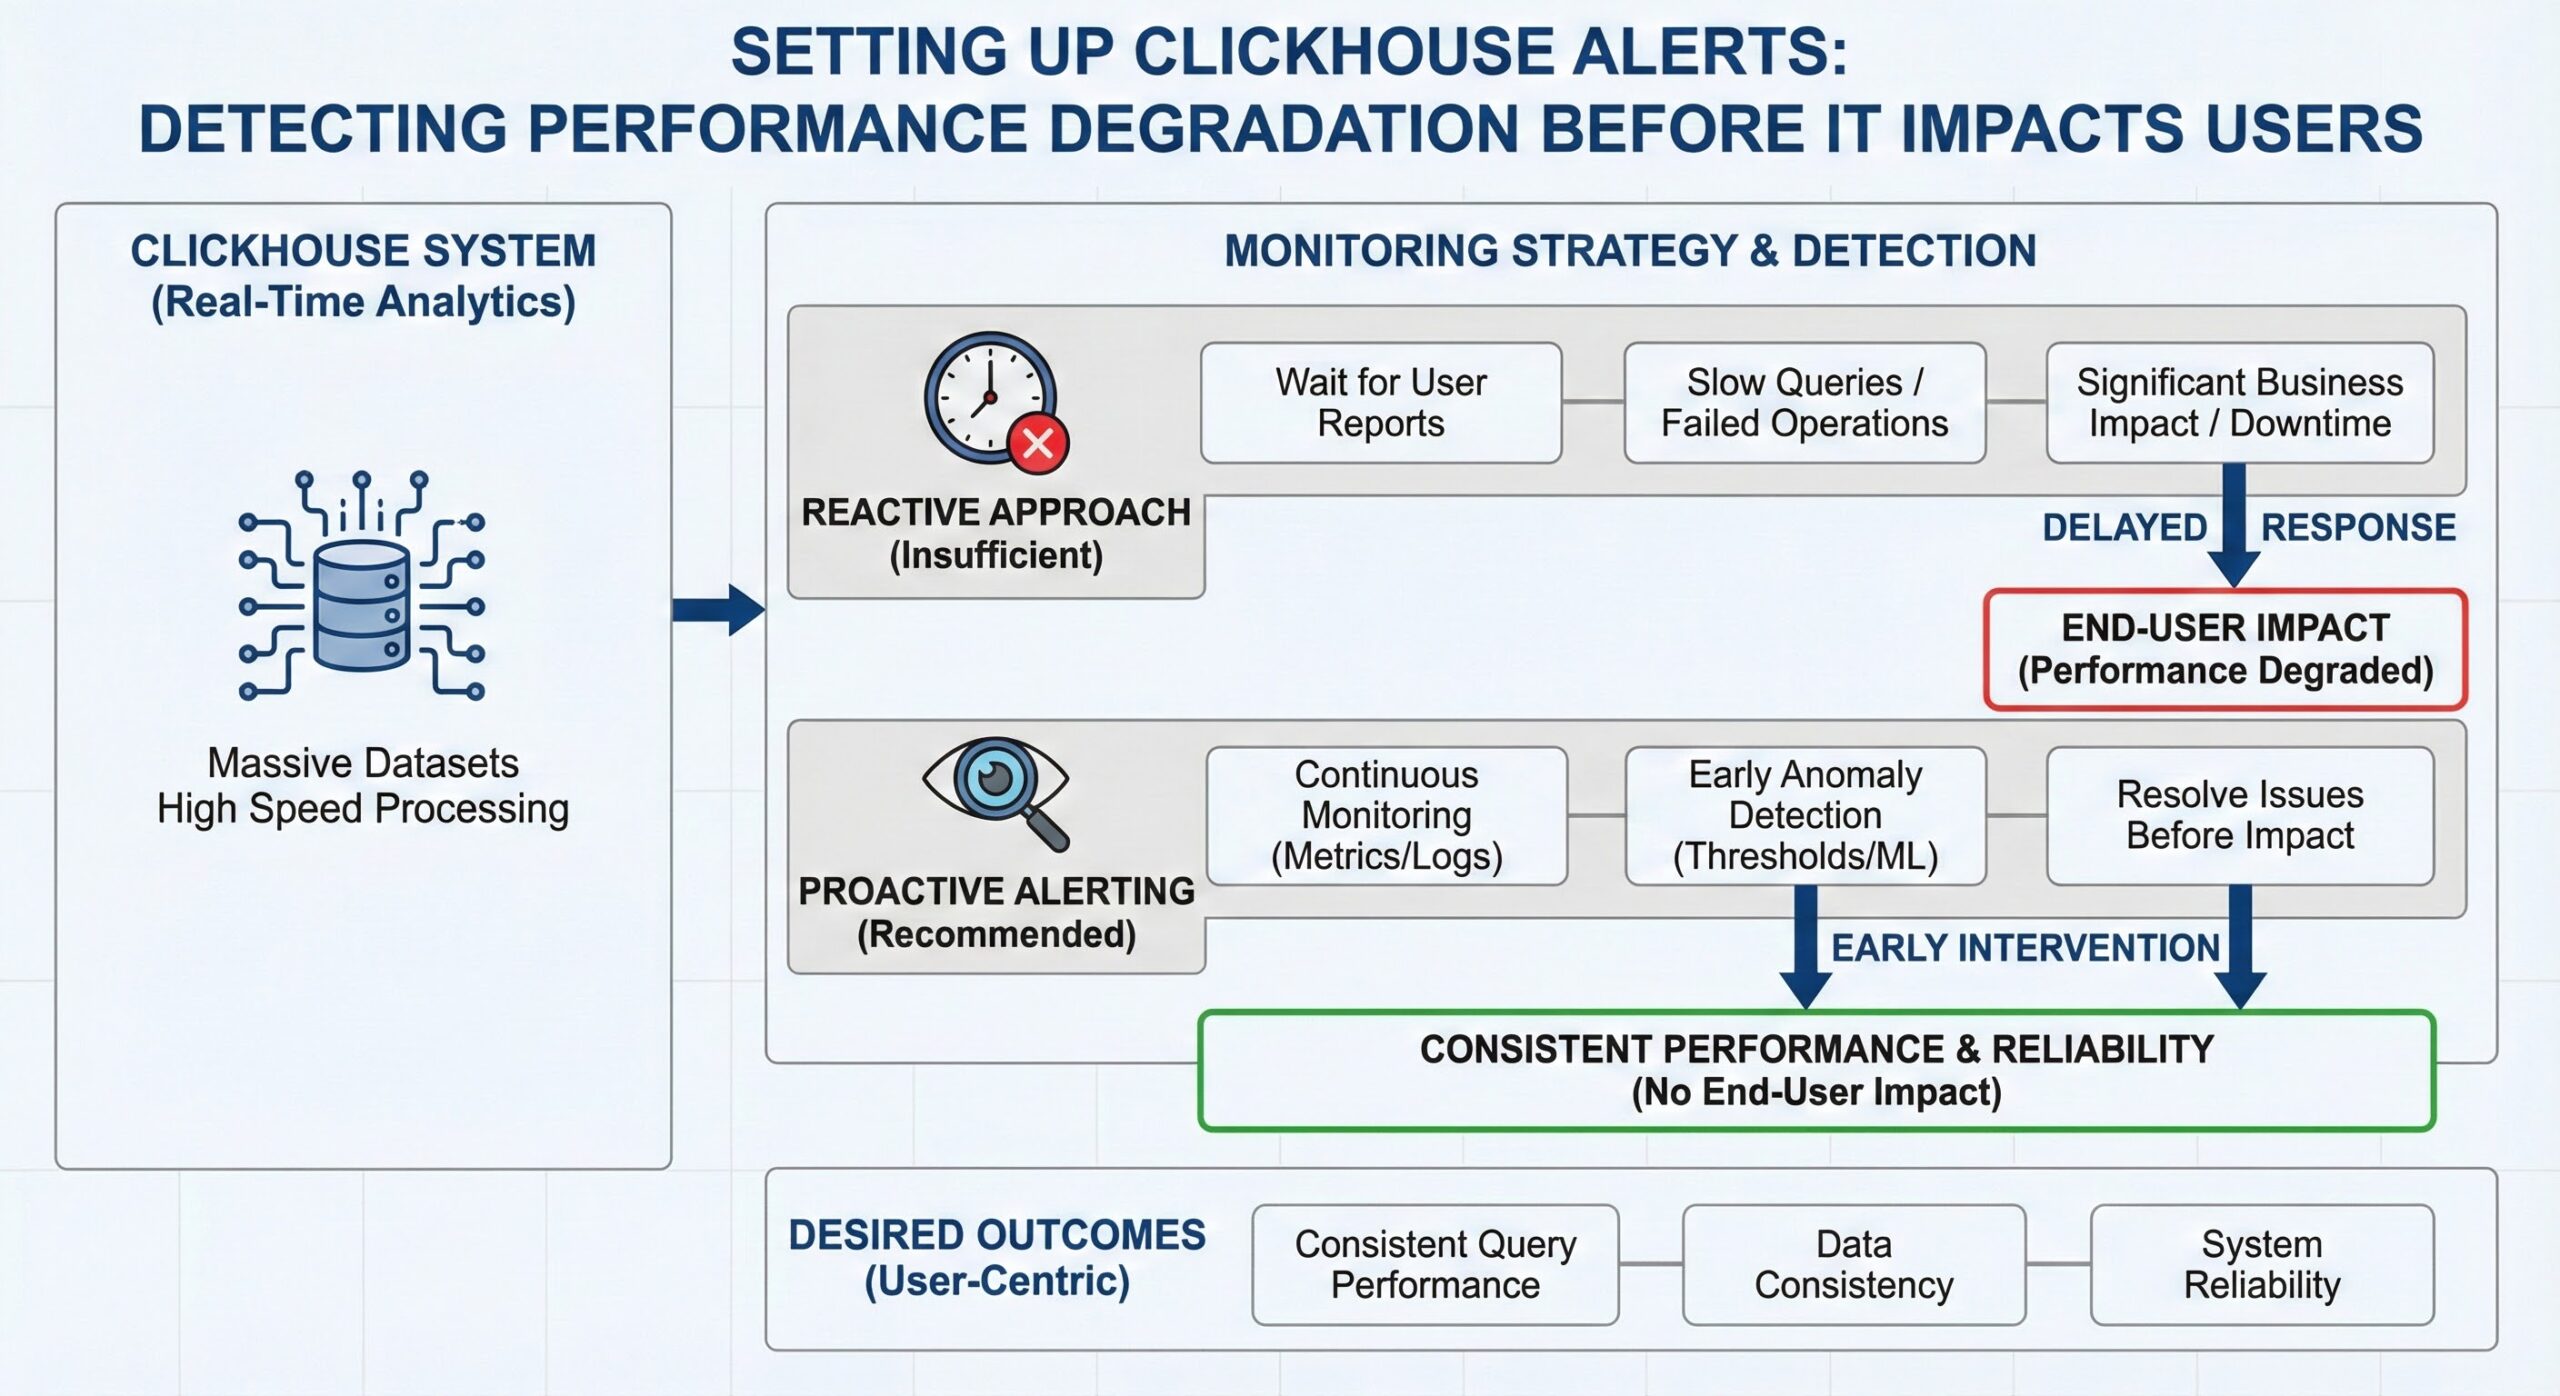
ClickHouse is a powerful column-oriented database management system designed for real-time analytical processing, capable of handling massive datasets with exceptional speed. However, like any high-performance system, maintaining optimal operation requires proactive monitoring and alerting. Reactive approaches—waiting for users to report slow queries or failed operations—are insufficient in production environments where downtime or degraded performance can have significant business impacts. Proactive alerting enables teams to detect and resolve issues before they affect end users, ensuring consistent query performance, data consistency, and system reliability.
This operational guide provides a comprehensive approach to setting up ClickHouse alerts for key performance indicators that signal potential degradation. We will cover monitoring high part counts (exceeding 100), replication lag beyond acceptable thresholds, query duration percentiles, memory usage approaching system limits, and merge queue depth. The guide includes integration examples with Prometheus and Grafana, two of the most widely used open-source monitoring tools, enabling you to build a robust observability stack around your ClickHouse deployment. By implementing these alerting strategies, you can shift from reactive firefighting to proactive system management, minimizing operational risk and maximizing database performance.
Understanding ClickHouse Performance Metrics
Before configuring alerts, it’s essential to understand the core performance metrics that indicate the health and efficiency of a ClickHouse cluster. Unlike traditional row-based databases, ClickHouse’s architecture—based on Log-Structured Merge (LSM) trees and MergeTree engines—introduces unique operational characteristics that require specific monitoring approaches. The system exposes a rich set of metrics through its internal system tables and Prometheus-compatible endpoints, allowing deep introspection into database behavior.
ClickHouse organizes data into immutable parts, which are periodically merged in the background to optimize storage and query performance. Each part corresponds to a segment of data, and excessive part counts can lead to increased disk I/O, higher memory usage, and longer query execution times due to the overhead of scanning multiple data files. Similarly, in replicated setups, maintaining low replication lag is critical for data consistency across replicas. Monitoring query execution patterns, including duration and resource consumption, helps identify inefficient queries that may degrade overall system performance. Memory usage must be tracked to prevent out-of-memory errors, especially under heavy query loads. Finally, the merge queue depth indicates how quickly ClickHouse is able to consolidate parts; a growing queue suggests that data ingestion is outpacing the system’s ability to optimize storage, which can lead to performance degradation over time.
These metrics form the foundation of an effective alerting strategy. By setting appropriate thresholds and monitoring trends, operators can detect anomalies early and take corrective action before users are impacted. The following sections detail how to monitor each of these key areas and configure actionable alerts using Prometheus and Grafana.
Monitoring High Part Counts
One of the most critical performance indicators in ClickHouse is the number of data parts per table or partition. ClickHouse stores data in immutable parts, and while this design enables fast inserts and efficient compression, an excessive number of parts can severely degrade query performance. When the number of parts grows beyond a reasonable threshold—typically considered to be over 100—query execution times increase significantly due to the overhead of scanning and merging multiple data files during read operations.
High part counts often arise from suboptimal partitioning strategies, high-frequency small inserts, or insufficient background merging activity. For example, partitioning by hour when data volume per hour is low can result in many small parts, while frequent INSERT operations without proper batching can generate numerous tiny parts that are not efficiently merged. This situation leads to increased disk I/O, higher memory usage during queries, and longer query latencies as ClickHouse must process more files to retrieve the requested data.
To monitor part counts effectively, administrators should query the system.parts table, which contains detailed information about all data parts in the system. A simple query can aggregate part counts by table or partition:
SELECT
    database,
    table,
    partition,
    count() as part_count
FROM system.parts
WHERE active = 1
GROUP BY database, table, partition
HAVING part_count > 100
ORDER BY part_count DESC
This query identifies partitions with more than 100 active parts, highlighting potential problem areas. For continuous monitoring, this metric should be exposed to Prometheus, either through ClickHouse’s built-in Prometheus exporter or a custom metrics collection agent. In Prometheus, an alert rule can be configured to trigger when part counts exceed the threshold:
- alert: ClickHouseHighPartCountInPartition
  expr: clickhouse_parts_count > 100
  for: 5m
  labels:
    severity: warning
  annotations:
    summary: "High part count detected in ClickHouse partition"
    description: "Partition {{ $labels.partition }} in table {{ $labels.table }} has {{ $value }} parts, which may degrade query performance."
Addressing high part counts typically involves optimizing the partitioning strategy, adjusting merge settings, or manually triggering merges. The system.merge_tree_settings table allows tuning parameters such as max_parts_in_total and max_parts_in_partition to control part growth. Additionally, administrators can force merges using the OPTIMIZE command, though this should be done during maintenance windows to avoid impacting production workloads. Regular monitoring and alerting on part counts enable proactive management of storage efficiency and query performance.
Detecting Replication Lag
In distributed ClickHouse deployments using replicated tables, maintaining low replication lag is essential for ensuring data consistency and high availability. Replication lag measures the delay between when data is written to the primary replica and when it is applied on secondary replicas. When this lag exceeds acceptable thresholds—typically 30 seconds—it can lead to stale reads, inconsistent query results, and potential data loss in the event of a failover.
The system.replicas table provides comprehensive information about the replication status of each replicated table on the local server, making it a primary source for monitoring replication health. Key columns include replica_delay, which indicates the current replication lag in seconds, and queue_size, which shows the number of entries waiting to be processed in the replication queue. A simple monitoring query can identify replicas with excessive lag:
SELECT
    database,
    table,
    replica_name,
    replica_delay,
    queue_size
FROM system.replicas
WHERE
    is_readonly OR
    is_session_expired OR
    replica_delay > 30 OR
    queue_size > 100
This query flags replicas that are in read-only mode, have expired sessions, exhibit high replication lag, or have large replication queues. For real-time alerting, these metrics should be exported to Prometheus. ClickHouse supports exporting replication metrics through its Prometheus-compatible endpoint, which can be enabled in the server configuration file.
A Prometheus alert rule can be configured to trigger when replication lag exceeds the threshold:
- alert: ClickHouseHighReplicaLag
  expr: clickhouse_replica_delay > 30
  for: 2m
  labels:
    severity: critical
  annotations:
    summary: "High replication lag detected in ClickHouse cluster"
    description: "Replica {{ $labels.replica }} of table {{ $labels.table }} has a lag of {{ $value }} seconds, risking data consistency."
Common causes of high replication lag include network latency, overloaded replica servers, misconfigured replication settings, or excessive write loads. Troubleshooting involves checking network connectivity, monitoring system resources on replica nodes, and reviewing the system.replication_queue table for blocked or stuck operations. In some cases, adjusting replication settings such as replication_alter_partitions_syncor increasing thread pool sizes can improve replication performance. Proactive monitoring and alerting on replication lag enable rapid detection and resolution of issues, ensuring consistent and reliable data access across the cluster.
Tracking Query Performance and Duration
Query performance is a direct reflection of user experience in ClickHouse-powered applications. Monitoring query duration, particularly at percentile levels such as p95 and p99, provides insights into tail latency and helps identify queries that may be degrading overall system performance. Long-running queries can consume excessive resources, block other operations, and lead to timeouts or failed requests from client applications.
ClickHouse provides detailed query execution data through the system.query_log table, which records information about all executed queries, including start and end times, duration, rows processed, bytes read, and memory usage. This table serves as the foundation for performance analysis and alerting. To identify slow queries, administrators can run queries like:
SELECT
    query,
    query_duration_ms,
    read_rows,
    read_bytes,
    memory_usage
FROM system.query_log
WHERE
    type = 'QueryFinish' AND
    query_duration_ms > 5000 AND
    event_date >= today() - 1
ORDER BY query_duration_ms DESC
LIMIT 20
This query retrieves the top 20 queries from the past day that took longer than 5 seconds to execute, helping pinpoint performance bottlenecks. For continuous monitoring, these metrics should be aggregated and exported to Prometheus. Custom metrics can be created to track query duration percentiles across different query types or user-defined categories.
In Prometheus, an alert rule can be configured to detect abnormal query latency:
- alert: ClickHouseHighQueryDuration
  expr: histogram_quantile(0.95, sum(rate(clickhouse_query_duration_bucket[5m])) by (le)) > 10000
  for: 10m
  labels:
    severity: warning
  annotations:
    summary: "High query duration detected in ClickHouse"
    description: "95th percentile query duration is {{ $value }}ms over the last 5 minutes, indicating potential performance degradation."
This rule triggers when the 95th percentile query duration exceeds 10 seconds for more than 10 minutes, signaling a systemic performance issue. Additional alerts can be set for high query failure rates, which may indicate resource exhaustion or configuration problems:
- alert: ClickHouseHighQueryFailureRate
  expr: rate(ClickHouseProfileEvents_FailedQuery[5m]) > 0.1
  for: 2m
  labels:
    severity: critical
  annotations:
    summary: "High query failure rate detected"
    description: "ClickHouse query failure rate is {{ $value }} per second."
Addressing performance issues often involves query optimization, such as improving filter conditions, adjusting JOIN algorithms, or revising table schemas. The system.processes table can be used to monitor currently running queries and their resource consumption, enabling real-time intervention when necessary. By establishing comprehensive query performance monitoring and alerting, teams can maintain consistent response times and quickly address emerging issues.
Monitoring Memory Usage and Preventing Exhaustion
Memory management is critical in ClickHouse, as the database is designed to leverage available RAM for high-speed query processing. However, uncontrolled memory usage can lead to out-of-memory (OOM) errors, query failures, and system instability. Monitoring memory consumption at both the system level and per-query level is essential for maintaining stability and performance.
ClickHouse exposes memory usage metrics through several system tables. The system.query_log table includes a memory_usage column that records the peak memory consumption of each query. This data can be used to identify memory-intensive queries that may be at risk of failure or causing resource contention. A diagnostic query can reveal the most memory-hungry queries:
SELECT
    query,
    memory_usage,
    query_duration_ms,
    read_rows
FROM system.query_log
WHERE
    type = 'QueryFinish' AND
    event_time >= now() - INTERVAL 1 DAY
ORDER BY memory_usage DESC
LIMIT 20
This query lists the top 20 queries from the past day sorted by memory usage, helping administrators identify potential optimization candidates. For real-time monitoring of currently running queries, the system.processes table provides live data on memory consumption:
SELECT
    query_id,
    query,
    elapsed,
    memory_usage
FROM system.processes
ORDER BY memory_usage DESC
To establish proactive alerting, memory usage metrics should be exported to Prometheus. ClickHouse’s built-in Prometheus exporter can expose system-wide memory metrics such as clickhouse_memory_usage and clickhouse_memory_available, as well as per-query memory consumption when properly instrumented.
A multi-tiered alerting strategy is recommended for memory monitoring:
- alert: ClickHouseHighMemoryUsage
  expr: clickhouse_memory_usage / clickhouse_memory_available > 0.8
  for: 5m
  labels:
    severity: warning
  annotations:
    summary: "High memory usage on ClickHouse server"
    description: "Memory usage is at {{ $value | printf "%.2f" }}% of available memory, increasing risk of OOM errors."

- alert: ClickHouseMemoryUsageCritical
  expr: clickhouse_memory_usage / clickhouse_memory_available > 0.95
  for: 2m
  labels:
    severity: critical
  annotations:
    summary: "Critical memory usage on ClickHouse server"
    description: "Memory usage is at {{ $value | printf "%.2f" }}% of available memory, immediate action required to prevent system failure."
These rules trigger warnings at 80% memory utilization and critical alerts at 95%, providing graduated response levels. When alerts fire, administrators should investigate running queries, consider limiting memory usage with settings like max_memory_usage, or optimize queries to reduce their footprint. Proactive memory monitoring prevents system crashes and ensures reliable query execution under varying workloads.
Managing Merge Queue Depth
Part merging is a fundamental process in ClickHouse that directly impacts storage efficiency and query performance. As data is inserted, it is written to new parts, which are later merged in the background to reduce the total number of parts and optimize data layout. The merge queue tracks pending merge operations, and monitoring its depth is crucial for detecting when the system is unable to keep up with data ingestion rates.
A growing merge queue indicates that new parts are being created faster than they can be merged, which can lead to excessive part counts and degraded query performance over time. The system.merges table provides real-time information about currently executing merges, while the system.replication_queue table (for replicated tables) shows pending merge tasks. Monitoring the size of these queues helps assess the system’s ability to maintain optimal data organization.
Key metrics to monitor include:
- merges_in_queue: The number of merges waiting to be processed
- future_parts: The number of parts that will be created after all queued operations are completed
- parts_to_check: The number of parts awaiting consistency checks
These metrics can be queried from the system.replication_queue table:
SELECT
    database,
    table,
    count() as queue_size,
    sum(parts_to_check) as parts_pending_check,
    sum(future_parts) as future_parts_count
FROM system.replication_queue
GROUP BY database, table
ORDER BY queue_size DESC
For continuous monitoring, these metrics should be exposed to Prometheus. ClickHouse’s Prometheus exporter can provide merge-related metrics that reflect the health of the background merging process. An alert rule can be configured to detect when the merge queue becomes excessive:
- alert: ClickHouseHighMergeQueueDepth
  expr: clickhouse_replication_queue_size > 100
  for: 10m
  labels:
    severity: warning
  annotations:
    summary: "High merge queue depth in ClickHouse"
    description: "Replication queue size is {{ $value }} for table {{ $labels.table }}, indicating merges are not keeping up with data ingestion."
This alert triggers when the replication queue size exceeds 100 for more than 10 minutes, signaling that the system may be struggling to maintain data organization. Causes of high merge queue depth include insufficient merge threads, I/O bottlenecks, or extremely high data ingestion rates. Administrators can address this by adjusting merge settings in system.merge_tree_settings, such as increasing number_of_free_entries_in_pool_to_lower_max_size_of_merge or max_replicated_merge_threads, or by optimizing data ingestion patterns to reduce part creation frequency.
Regular monitoring of merge queue depth enables proactive management of ClickHouse’s background processes, ensuring that data remains optimally organized and query performance stays consistent even under heavy write loads.
Integrating with Prometheus and Grafana
Prometheus and Grafana form a powerful combination for monitoring and alerting in ClickHouse deployments. Prometheus serves as the metrics collection and storage backend, while Grafana provides visualization and alerting capabilities. ClickHouse supports Prometheus integration through its built-in metrics exporter, which exposes a wide range of performance metrics in Prometheus format.
To set up Prometheus integration, enable the Prometheus endpoint in the ClickHouse server configuration file (config.xml):
<prometheus>
    <endpoint>/metrics</endpoint>
    <port>8001</port>
    <metrics>true</metrics>
    <events>true</events>
    <asynchronous_metrics>true</asynchronous_metrics>
    <status_info>true</status_info>
</prometheus>
Once enabled, Prometheus can scrape metrics from ClickHouse by configuring a job in prometheus.yml:
scrape_configs:
  - job_name: 'clickhouse'
    static_configs:
      - targets: ['clickhouse-server:8001']
With metrics flowing into Prometheus, Grafana can be configured as a data source to visualize ClickHouse performance. The ClickHouse data source plugin for Grafana enables direct querying of ClickHouse system tables, while the Prometheus data source allows visualization of collected metrics. This dual approach provides comprehensive monitoring capabilities—using Prometheus for time-series metrics and alerting, and ClickHouse itself for detailed system introspection.
Grafana dashboards can be created to display key performance indicators, including part counts, replication lag, query duration percentiles, memory usage, and merge queue depth. Pre-built dashboards are available as part of the ClickHouse Cloud Prometheus/Grafana mix-in, offering a quick-start approach for teams implementing monitoring. These dashboards can be customized to meet specific operational requirements and shared across teams.
Alerting in Grafana can be configured using the same PromQL expressions defined in Prometheus rules, providing a unified interface for managing alerts. Notifications can be sent to various channels, including Slack, PagerDuty, and email, ensuring that incidents are promptly addressed. The integration between ClickHouse, Prometheus, and Grafana creates a robust observability stack that enables proactive monitoring, rapid troubleshooting, and continuous performance optimization.
Conclusion
Proactive alerting is essential for maintaining high-performance ClickHouse deployments and preventing incidents that impact users. By monitoring key metrics such as part counts, replication lag, query duration, memory usage, and merge queue depth, operators can detect performance degradation early and take corrective action before issues escalate. The integration of ClickHouse with Prometheus and Grafana provides a comprehensive observability solution that combines real-time monitoring with actionable alerting.
Effective alerting requires more than just setting thresholds—it demands an understanding of normal system behavior, careful tuning of alert conditions, and regular review of alert effectiveness. Alerts should be actionable, with clear descriptions and appropriate severity levels to guide response efforts. By implementing the monitoring strategies outlined in this guide, organizations can ensure their ClickHouse deployments remain stable, performant, and reliable, even under demanding workloads. The result is a data infrastructure that supports business needs without unexpected disruptions, enabling teams to focus on innovation rather than incident response.
Further Reading:
- Setting up Alerts in ClickHouse for Performance Troubleshooting
- Troubleshooting Disk Space in ClickHouse
- Essential ClickHouse Metrics
- Boosting Materialized View Performance
- PREWHERE vs WHERE in ClickHouse Queries
You might also like:
- Comparing ClickHouse vs RocksDB for Real-time Analytics
- Real-time Analytics for Digital Transformation with ChistaDATA’s ClickHouse
- ClickHouse August 2022 Release – v22.8
- How to Setup a 6-Node Cluster in ClickHouse with Replication & Sharding
- Optimizing Non-SARGable Predicates in ClickHouse for Improved Query Performance