Introduction to ClickHouse Resource Governor
ClickHouse Resource Governor is a feature that allows DBAs to allocate system resources, such as CPU, memory, and I/O operations, to specific users or groups of users. The Resource Governor provides a way to prioritize and allocate resources to ensure that critical queries and users have access to the necessary resources.
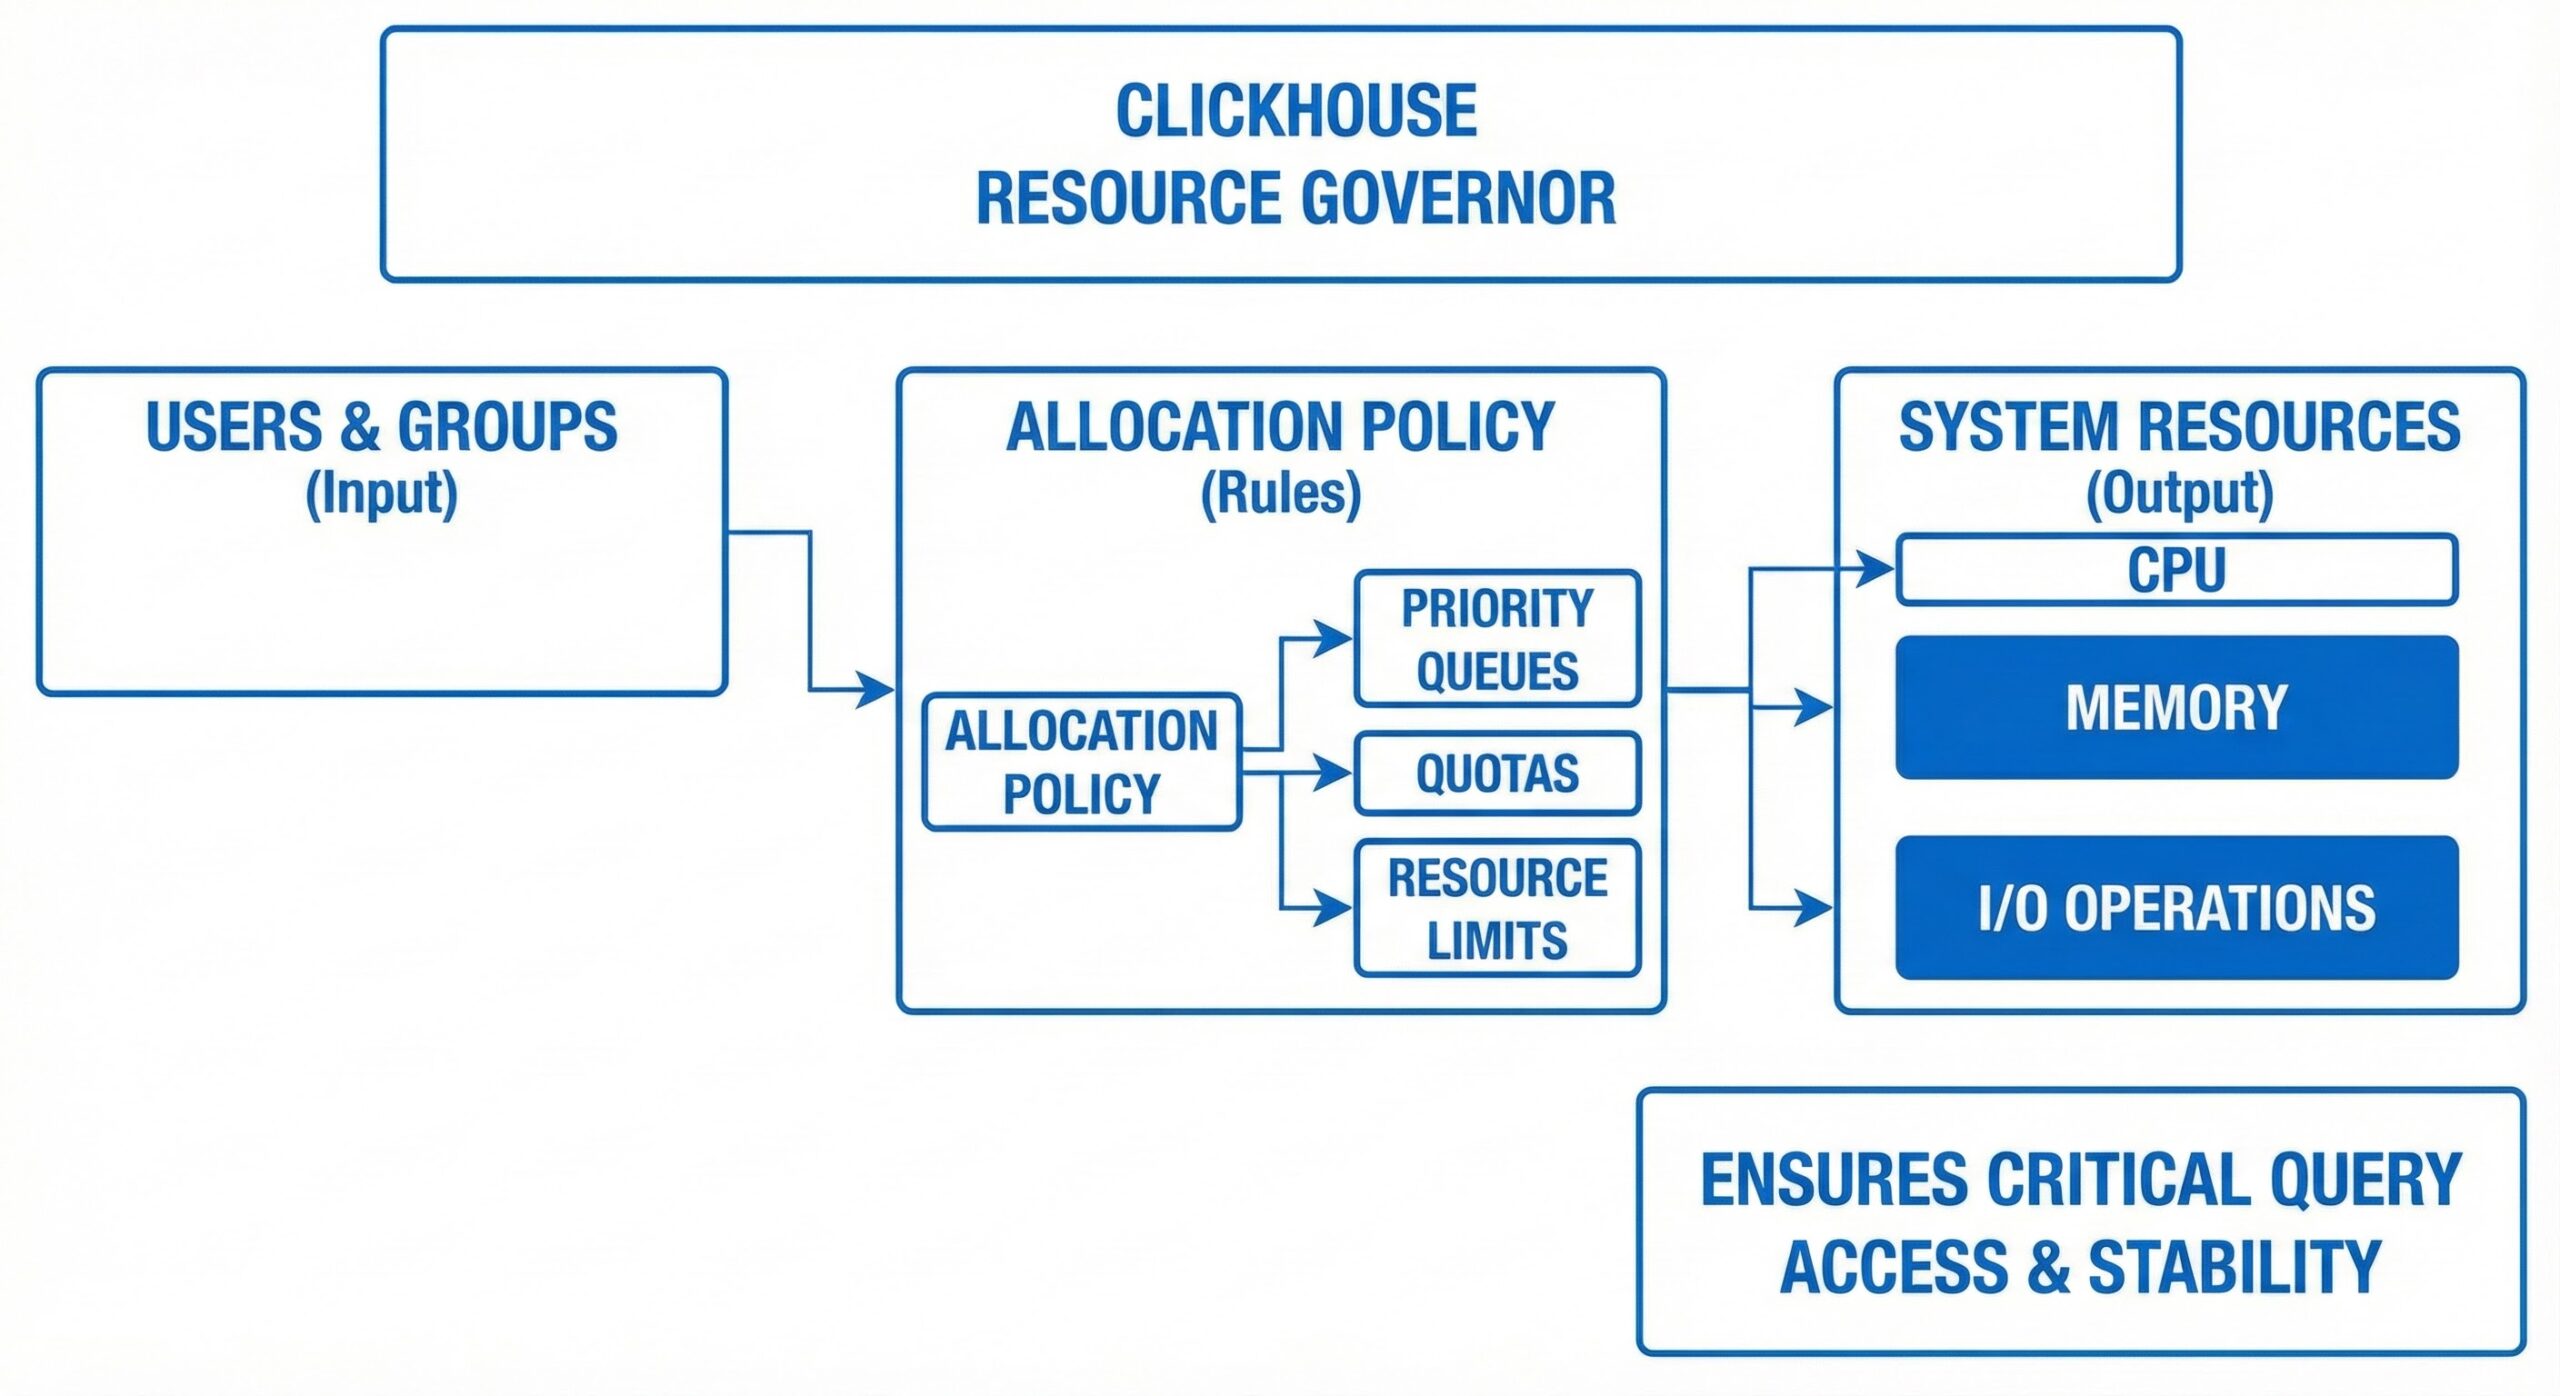
How ClickHouse Resource Governor Works
Configuration
The Resource Governor is a powerful feature designed to manage and control resource allocation in database systems, particularly in environments where multiple users or applications share the same server resources. Configuration of the Resource Governor is primarily performed through the config.xml file, which serves as the central repository for defining resource constraints and behavioral policies. This XML-based configuration allows administrators to fine-tune performance settings in a structured and version-controllable manner.
Key parameters defined in the config.xml file include max_threads and max_memory_usage. The max_threads parameter specifies the upper limit on the number of concurrent threads that can be utilized by a particular user or group. This ensures that no single user or application can monopolize CPU scheduling by spawning an excessive number of threads, which could lead to context-switching overhead and degraded system responsiveness. By capping thread usage, the system maintains predictable performance even under heavy load.
Similarly, the max_memory_usage parameter defines the maximum amount of memory (typically in megabytes or gigabytes) that a user or group can consume during query execution. Memory-intensive operations such as large sorts, hash joins, or bulk data processing are constrained by this limit, preventing out-of-memory conditions that could destabilize the server. These thresholds are applied at the resource pool level, allowing administrators to create isolated environments with guaranteed resource availability.
In addition to these core parameters, the configuration may also include settings for minimum resource guarantees, workload classification rules, and session-level controls, enabling granular management of system resources based on business priorities.
Resource Group Membership
Users are assigned to specific Resource Groups based on predefined criteria such as their roles within the organization, login identities, application names, or even client IP addresses. This classification is typically handled through a classifier function or rule set that evaluates incoming sessions and routes them to the appropriate resource pool. For example, a DBA might configure the system so that all connections from the “finance_app” are assigned to a high-priority resource group, while ad-hoc reporting tools used by analysts are placed in a lower-priority group with limited concurrency.
Each user session can belong to only one Resource Group at any given time, ensuring clear accountability and preventing resource leakage across different workloads. This one-to-one mapping simplifies administration and auditing, as it becomes straightforward to trace resource consumption back to specific user groups. Moreover, dynamic membership rules allow for flexible policies—for instance, time-based routing where batch jobs during off-peak hours receive higher resource allocations than during business hours.
Resource Allocation
Once Resource Groups are defined and users are classified accordingly, the Resource Governor begins allocating system resources—such as CPU time, memory, and I/O bandwidth—based on the configured policies. The allocation process is dynamic and adaptive, meaning that the Resource Governor continuously monitors the system load and adjusts resource distribution in real time to maintain service level agreements (SLAs).
For example, if a particular Resource Group has not reached its maximum threshold for CPU usage, the system may allow it to temporarily burst beyond its nominal allocation, provided that other groups are not contending for those resources. Conversely, when system demand increases, the Resource Governor enforces hard limits to ensure fair sharing. This dynamic behavior helps optimize overall throughput without compromising on stability.
Resource allocation extends beyond just computational power; it also governs access to disk I/O operations, network bandwidth (in some implementations), and parallelism settings. For instance, a resource group might be restricted from using parallel query execution, or limited to a certain degree of parallelism, to prevent it from overwhelming shared storage subsystems.
Resource Limit Enforcement
One of the primary functions of the Resource Governor is to enforce the resource limits defined in the configuration. This enforcement mechanism acts as a safeguard against runaway queries or poorly optimized applications that could otherwise degrade the performance of critical workloads.
When a user or group exceeds its allocated resource limits—such as surpassing the max_memory_usage threshold or initiating more threads than allowed—the Resource Governor intervenes by throttling the offending workload. Throttling may take various forms, including suspending query execution, reducing CPU scheduling priority, or terminating the session outright, depending on the severity and configuration.
This enforcement ensures that mission-critical queries, such as real-time transaction processing or executive dashboards, continue to receive the necessary resources to operate efficiently. It also promotes fairness in multi-tenant environments, where different departments or customers share the same infrastructure. By isolating resource consumption, the Resource Governor minimizes the “noisy neighbor” problem, where one user’s activity negatively impacts others.
Monitoring
To provide visibility into resource utilization and system health, the Resource Governor includes comprehensive monitoring capabilities. These tools enable database administrators to track how resources are being consumed across different groups, identify potential bottlenecks, and validate whether configured policies are achieving their intended effects.
Monitoring features typically include system views (e.g., sys.dm_resource_governor_resource_pools, sys.dm_resource_governor_workload_groups) that expose real-time metrics such as CPU usage, memory consumption, active sessions, and wait statistics for each resource pool and workload group. These dynamic management views (DMVs) can be queried using standard SQL, making it easy to integrate monitoring into existing dashboards or alerting systems.
Additionally, administrators can configure alerts or triggers that fire when a group approaches or exceeds its resource limits. For example, an alert might be sent via email or logged in a monitoring system when a particular workload group uses more than 90% of its allocated memory for a sustained period. This proactive notification allows for timely intervention, such as adjusting limits, optimizing queries, or scaling infrastructure.
Some advanced implementations also support historical logging and reporting, enabling trend analysis and capacity planning over time. Together, these monitoring tools empower administrators to maintain optimal performance, troubleshoot issues efficiently, and ensure compliance with service-level objectives.
By implementing the ClickHouse Resource Governor, DBAs can allocate resources based on the needs of the database and ensure that critical queries and users have access to the necessary resources. This can help to improve the overall performance and stability of the database.
SQL to monitor ClickHouse Resource Governor
To monitor the ClickHouse Resource Governor, you can use the following SQL queries:
- To view all defined resource groups:
SELECT * FROM system.query_log WHERE type = 'ResourceLimits';
This query will return a list of all defined resource groups, including their names, CPU limits, and memory limits.
- To view the current status of the Resource Governor:
SELECT * FROM system.query_log WHERE type = 'ResourceLimitsExceeded';
This query will return the current status of the Resource Governor, including the number of queries affected by resource constraints and the number of queries killed due to exceeding resource limits.
- To view the resource usage by each resource group:
SELECT * FROM system.runtime_limits;
This query will return the resource usage by each resource group, including CPU time, memory usage, and I/O operations.
- To view the active queries for a specific resource group:
SELECT * FROM system.processes WHERE user_name = 'resource_group_name';
This query will return the active queries for a specific resource group, where resource_group_name is the name of the resource group.
Conclusion
By using these queries, DBAs can monitor the ClickHouse Resource Governor and identify any performance issues related to resource allocation. They can also use this information to make adjustments
To read more about ClickHouse internals, do consider reading the below articles
- ClickHouse Data Types: LowCardinality for Query Performance Acceleration
- ClickHouse Performance: Implementing Bloom Filters in ClickHouse
- ClickHouse Proxy Server for Read-Write Splitting with Connection Pooling & Query Cache
- Introduction to Working Datasets in ClickHouse