ChistaDATA · Data Reliability Engineering for ClickHouse
Data SRE for ClickHouse: 7 Proven Reliability Practices We Run in Production
Data SRE is the discipline of running a database the way a site reliability team runs a service: with service level objectives, error budgets, alerting that pages only when users are affected, rehearsed recovery, and postmortems that change the system. ChistaDATA delivers Data SRE for ClickHouse estates as an engineering practice, not a monitoring subscription.
This page sets out the seven practices we apply, with the SQL, the alert rules and the runbook structure behind each one, so your team can judge the method before any conversation with us.
- What Data SRE means for ClickHouse
- The Data SRE operating loop
- Practice 1: indicators from query logs
- Practice 2: objectives and error budgets
- Practice 3: burn-rate alerting
- Practice 4: replication and Keeper health
- Practice 5: merge and mutation pressure
- Practice 6: restore drills
- Practice 7: capacity and change safety
- What a Data SRE engagement delivers
- Data SRE questions we are asked
Definition
What Data SRE means for a ClickHouse estate
Most ClickHouse clusters are monitored. Far fewer are operated against an explicit reliability target. The difference shows up during an incident: a monitored cluster produces forty alerts and no decision, while a cluster run under Data SRE produces one page that says which objective is at risk, how fast the error budget is burning, and which runbook applies.
Data SRE borrows its vocabulary from site reliability engineering and adapts it to stateful systems. A stateless service recovers by restarting. A database has to recover without losing acknowledged writes, without serving stale replicas as if they were current, and without a restore that has never been rehearsed. That is why the practice puts as much weight on replication state, ClickHouse Keeper quorum health and restore drills as it does on query latency.
The terms overlap, so it helps to fix them. Data reliability engineering is the broader discipline, ClickHouse SRE is what it looks like on one engine, and Data SRE is the name we use for the practice as a whole.
We treat three properties as the core of reliability for analytical databases:
- Availability: the share of valid queries and inserts that succeed.
- Latency: the share of queries that complete inside the threshold the product actually needs, measured at p95 and p99 rather than the average.
- Freshness and durability: how far replicas and downstream materialized views lag behind ingestion, and whether a backup can be restored inside the recovery time objective.
Release coverage: ChistaDATA delivers consulting, 24×7 support, managed services and remote DBA on ClickHouse 26.8 LTS (current long-term-support release, August 2026, supported to August 2027) and 26.3 LTS (supported to March 2027), plus every supported stable release between them, with upgrade engineering for 24.x and 25.x estates. Last verified September 2026.
Method
The Data SRE operating loop
Every engagement runs the same loop. Indicators are computed from ClickHouse telemetry, objectives are agreed per workload tier, the error budget is derived from the objective, and alerting is tied to the rate at which the budget is being spent. When an alert fires it lands on a runbook, the incident is handled under a severity matrix, and the postmortem feeds a reliability backlog that changes the indicators on the next pass.
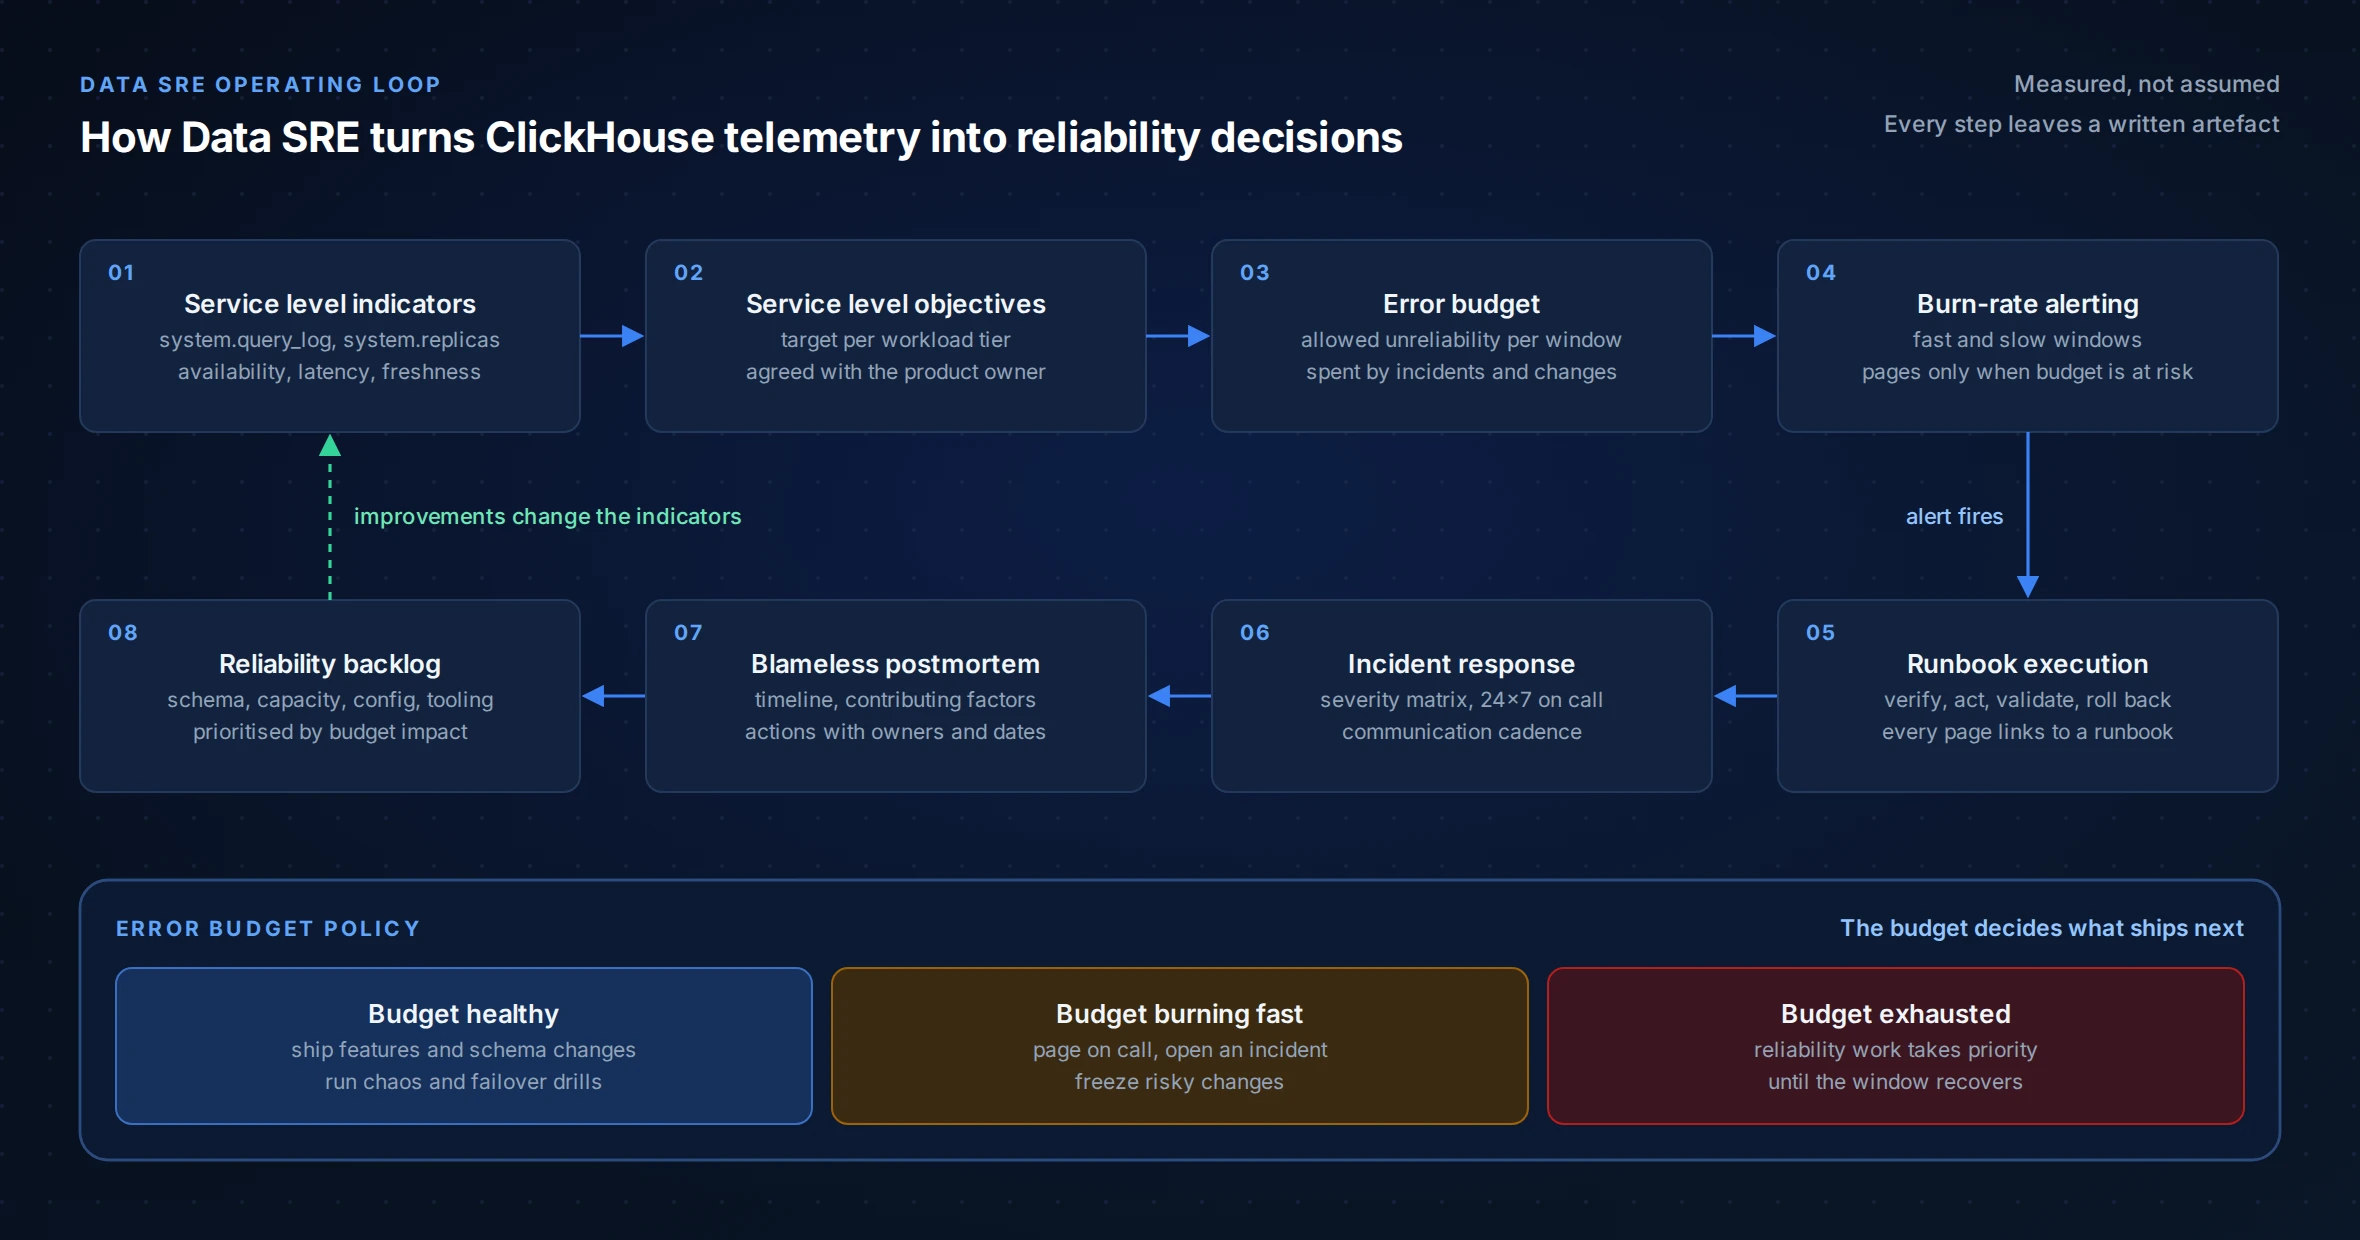
The loop matters more than any single tool in it. Teams that adopt dashboards without an error budget policy keep arguing about whether reliability work or feature work comes first. The policy settles that argument in advance, in writing, with the product owner in the room.
Practice 1
Compute service level indicators from system.query_log
ClickHouse already records what a Data SRE practice needs. system.query_log holds one row per query event with duration, exception code, memory and the initiating user. We compute availability and latency indicators directly from it, across every replica, rather than inferring them from host metrics.
-- Availability and latency SLIs per hour, last 24 hours, whole cluster.
-- Replace cluster_name with the name from system.clusters.
SELECT
    toStartOfHour(event_time) AS hour,
    countIf(type = 'QueryFinish') AS ok_queries,
    countIf(type = 'ExceptionWhileProcessing') AS failed_queries,
    round(ok_queries / (ok_queries + failed_queries), 5) AS availability_sli,
    quantileIf(0.95)(query_duration_ms, type = 'QueryFinish') AS p95_ms,
    quantileIf(0.99)(query_duration_ms, type = 'QueryFinish') AS p99_ms,
    round(countIf(type = 'QueryFinish' AND query_duration_ms <= 1000)
          / countIf(type = 'QueryFinish'), 5) AS latency_sli_1s
FROM clusterAllReplicas('cluster_name', system.query_log)
WHERE event_time >= now() - INTERVAL 24 HOUR
  AND is_initial_query = 1
  AND query_kind = 'Select'
  AND type IN ('QueryFinish', 'ExceptionWhileProcessing')
GROUP BY hour
ORDER BY hour;
Two details decide whether this indicator is trustworthy. First, is_initial_query = 1 keeps distributed sub-queries from being counted as separate user requests. Second, not every exception is the database’s fault. A syntax error or an unknown table is a client defect, so we classify exception codes into “counts against the budget” and “does not” before the number is shown to anyone.
-- Which errors are actually spending the budget?
SELECT
    exception_code,
    errorCodeToName(exception_code) AS error_name,
    count() AS occurrences,
    uniqExact(user) AS affected_users,
    any(substring(exception, 1, 120)) AS sample
FROM clusterAllReplicas('cluster_name', system.query_log)
WHERE event_time >= now() - INTERVAL 24 HOUR
  AND type = 'ExceptionWhileProcessing'
  AND is_initial_query = 1
GROUP BY exception_code
ORDER BY occurrences DESC
LIMIT 20;
Codes such as MEMORY_LIMIT_EXCEEDED, TOO_MANY_SIMULTANEOUS_QUERIES, TIMEOUT_EXCEEDED and TABLE_IS_READ_ONLY are reliability signals. SYNTAX_ERROR and UNKNOWN_TABLE usually are not. Check the retention of system.query_log before relying on it: the table has a TTL and is flushed on an interval, so a long-window SLO needs the log copied into a retained telemetry table.
Practice 2
Set Data SRE objectives per workload tier and derive the error budget
One objective for the whole cluster is almost always wrong. A customer-facing dashboard API and a nightly backfill share hardware but not expectations. We tier workloads by user, by log_comment, or by a settings profile, and agree an objective for each tier with the person who owns the product outcome.
| Workload tier | Indicator | Illustrative objective | Budget over 30 days |
|---|---|---|---|
| Customer-facing API | Valid queries that succeed | 99.9% | 0.1% of requests, about 43 minutes of full outage |
| Customer-facing API | Queries completing within 1 second | 99% | 1% of requests may be slower |
| Internal BI | Valid queries that succeed | 99.5% | 0.5% of requests |
| Ingestion | Replica delay under 60 seconds | 99% | 1% of measured intervals |
| Recovery | Restore drill inside the RTO | Every drill | None: a failed drill is an incident |
The error budget is simply one minus the objective, applied to the request volume in the window. It is the most useful number in Data SRE because it converts reliability from an opinion into a quantity that can be spent. A schema migration that risks a short read-only period is acceptable when the budget is healthy and deferred when it is not.
-- Error budget consumed so far in the current 30-day window (99.9% objective).
WITH 0.999 AS slo
SELECT
    countIf(type = 'QueryFinish') AS ok_queries,
    countIf(type = 'ExceptionWhileProcessing'
            AND exception_code NOT IN (62, 60, 47)) AS budget_errors,
    ok_queries + budget_errors AS valid_requests,
    round((1 - slo) * valid_requests) AS budget_total,
    round(100 * budget_errors / greatest(budget_total, 1), 1) AS budget_consumed_pct
FROM clusterAllReplicas('cluster_name', telemetry.query_log_retained)
WHERE event_time >= now() - INTERVAL 30 DAY
  AND is_initial_query = 1
  AND user = 'api_reader';
-- 62 = SYNTAX_ERROR, 60 = UNKNOWN_TABLE, 47 = UNKNOWN_IDENTIFIER (client defects)
Practice 3
Alert on burn rate, not on thresholds
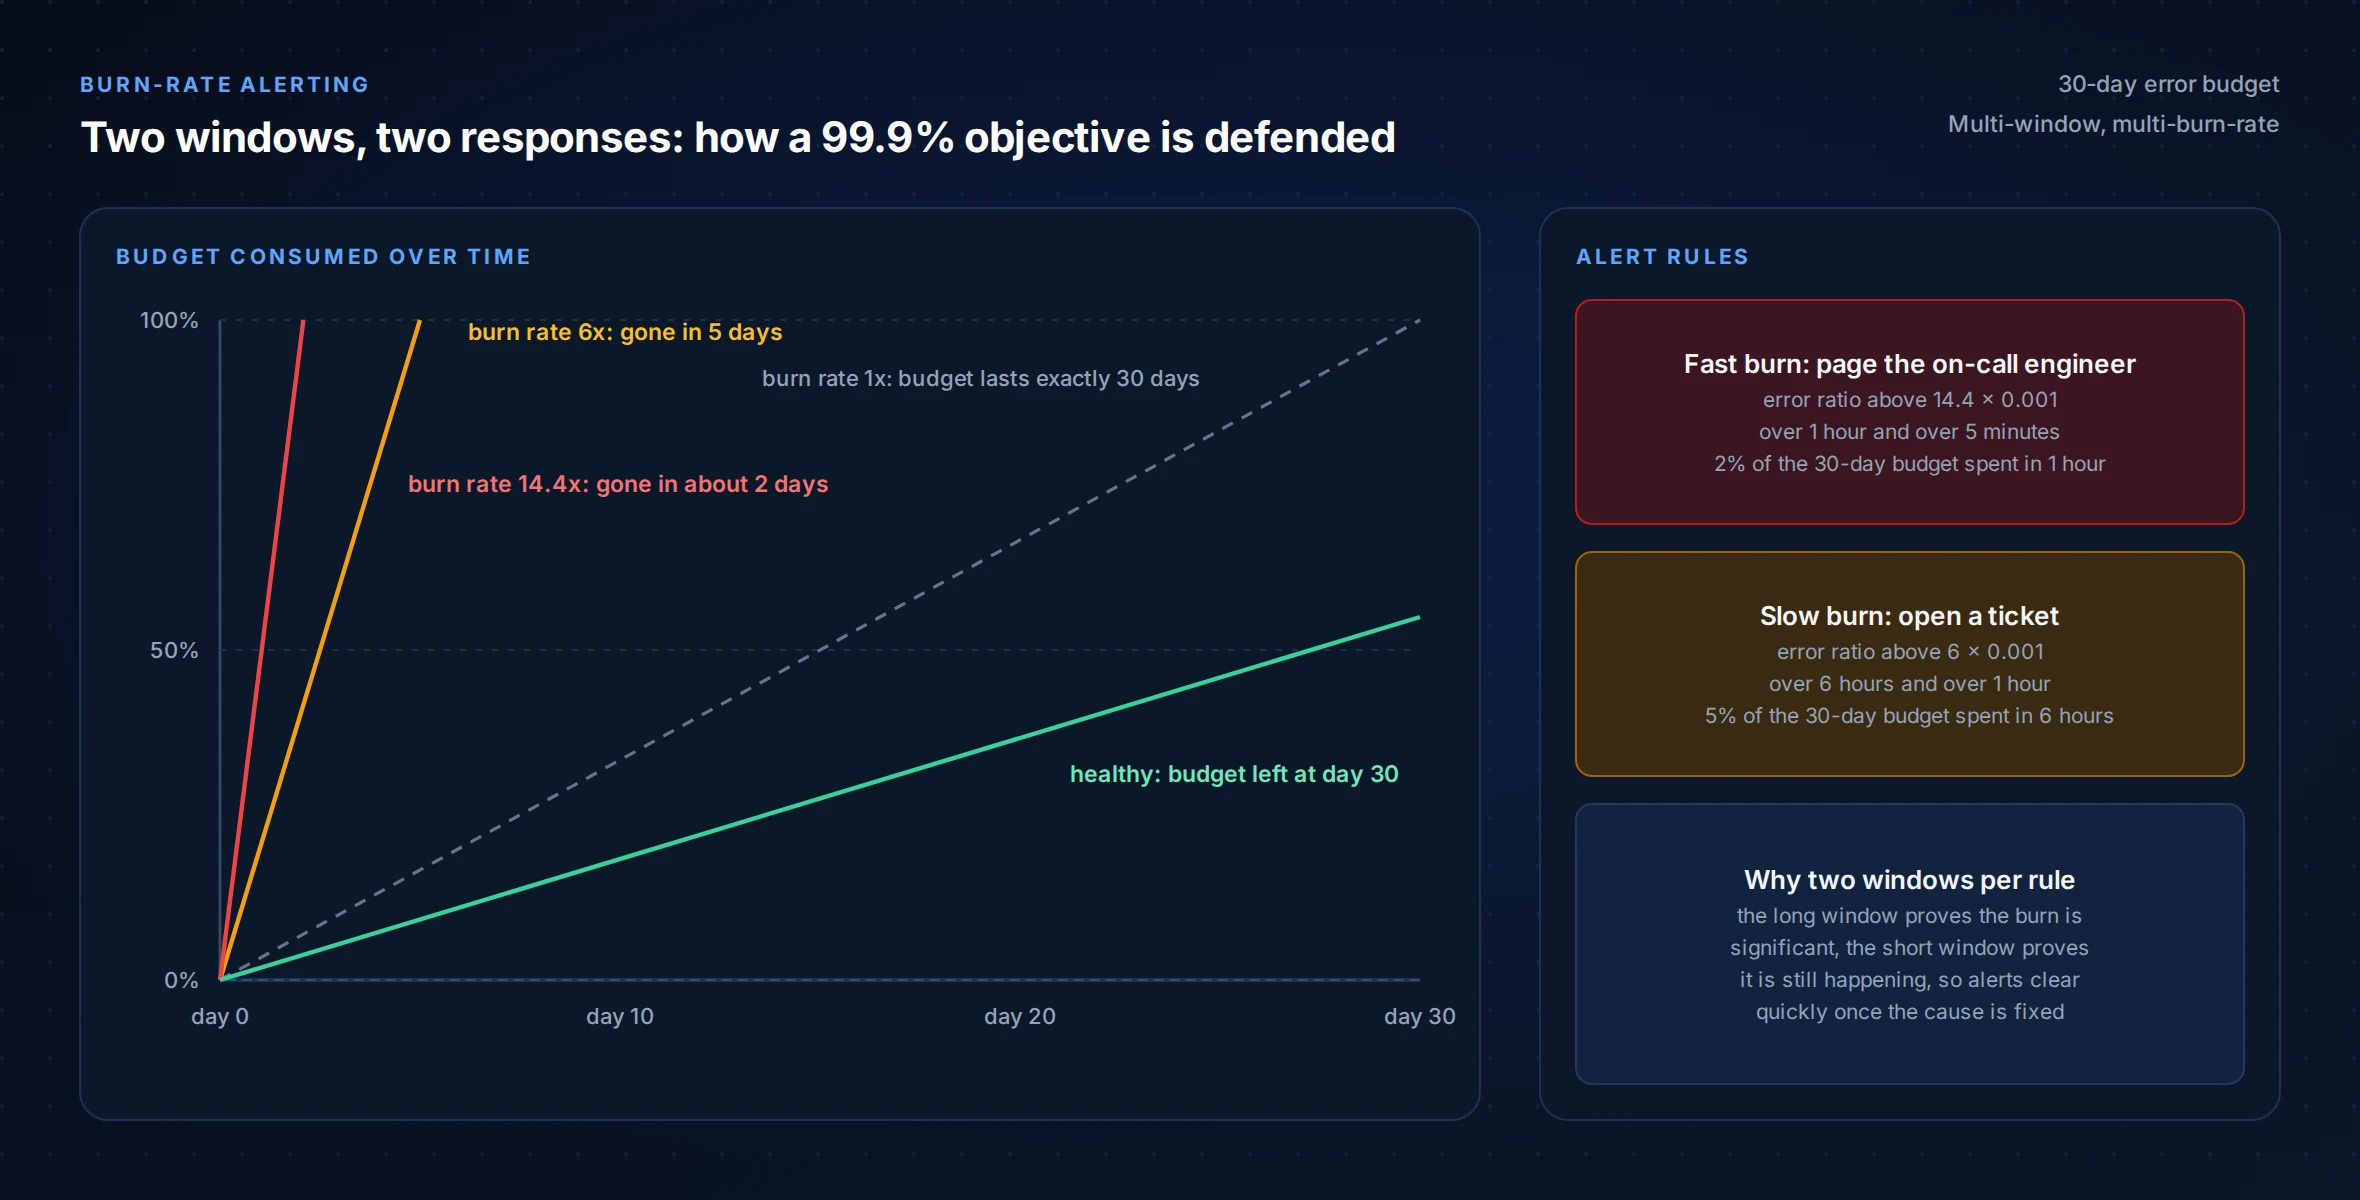
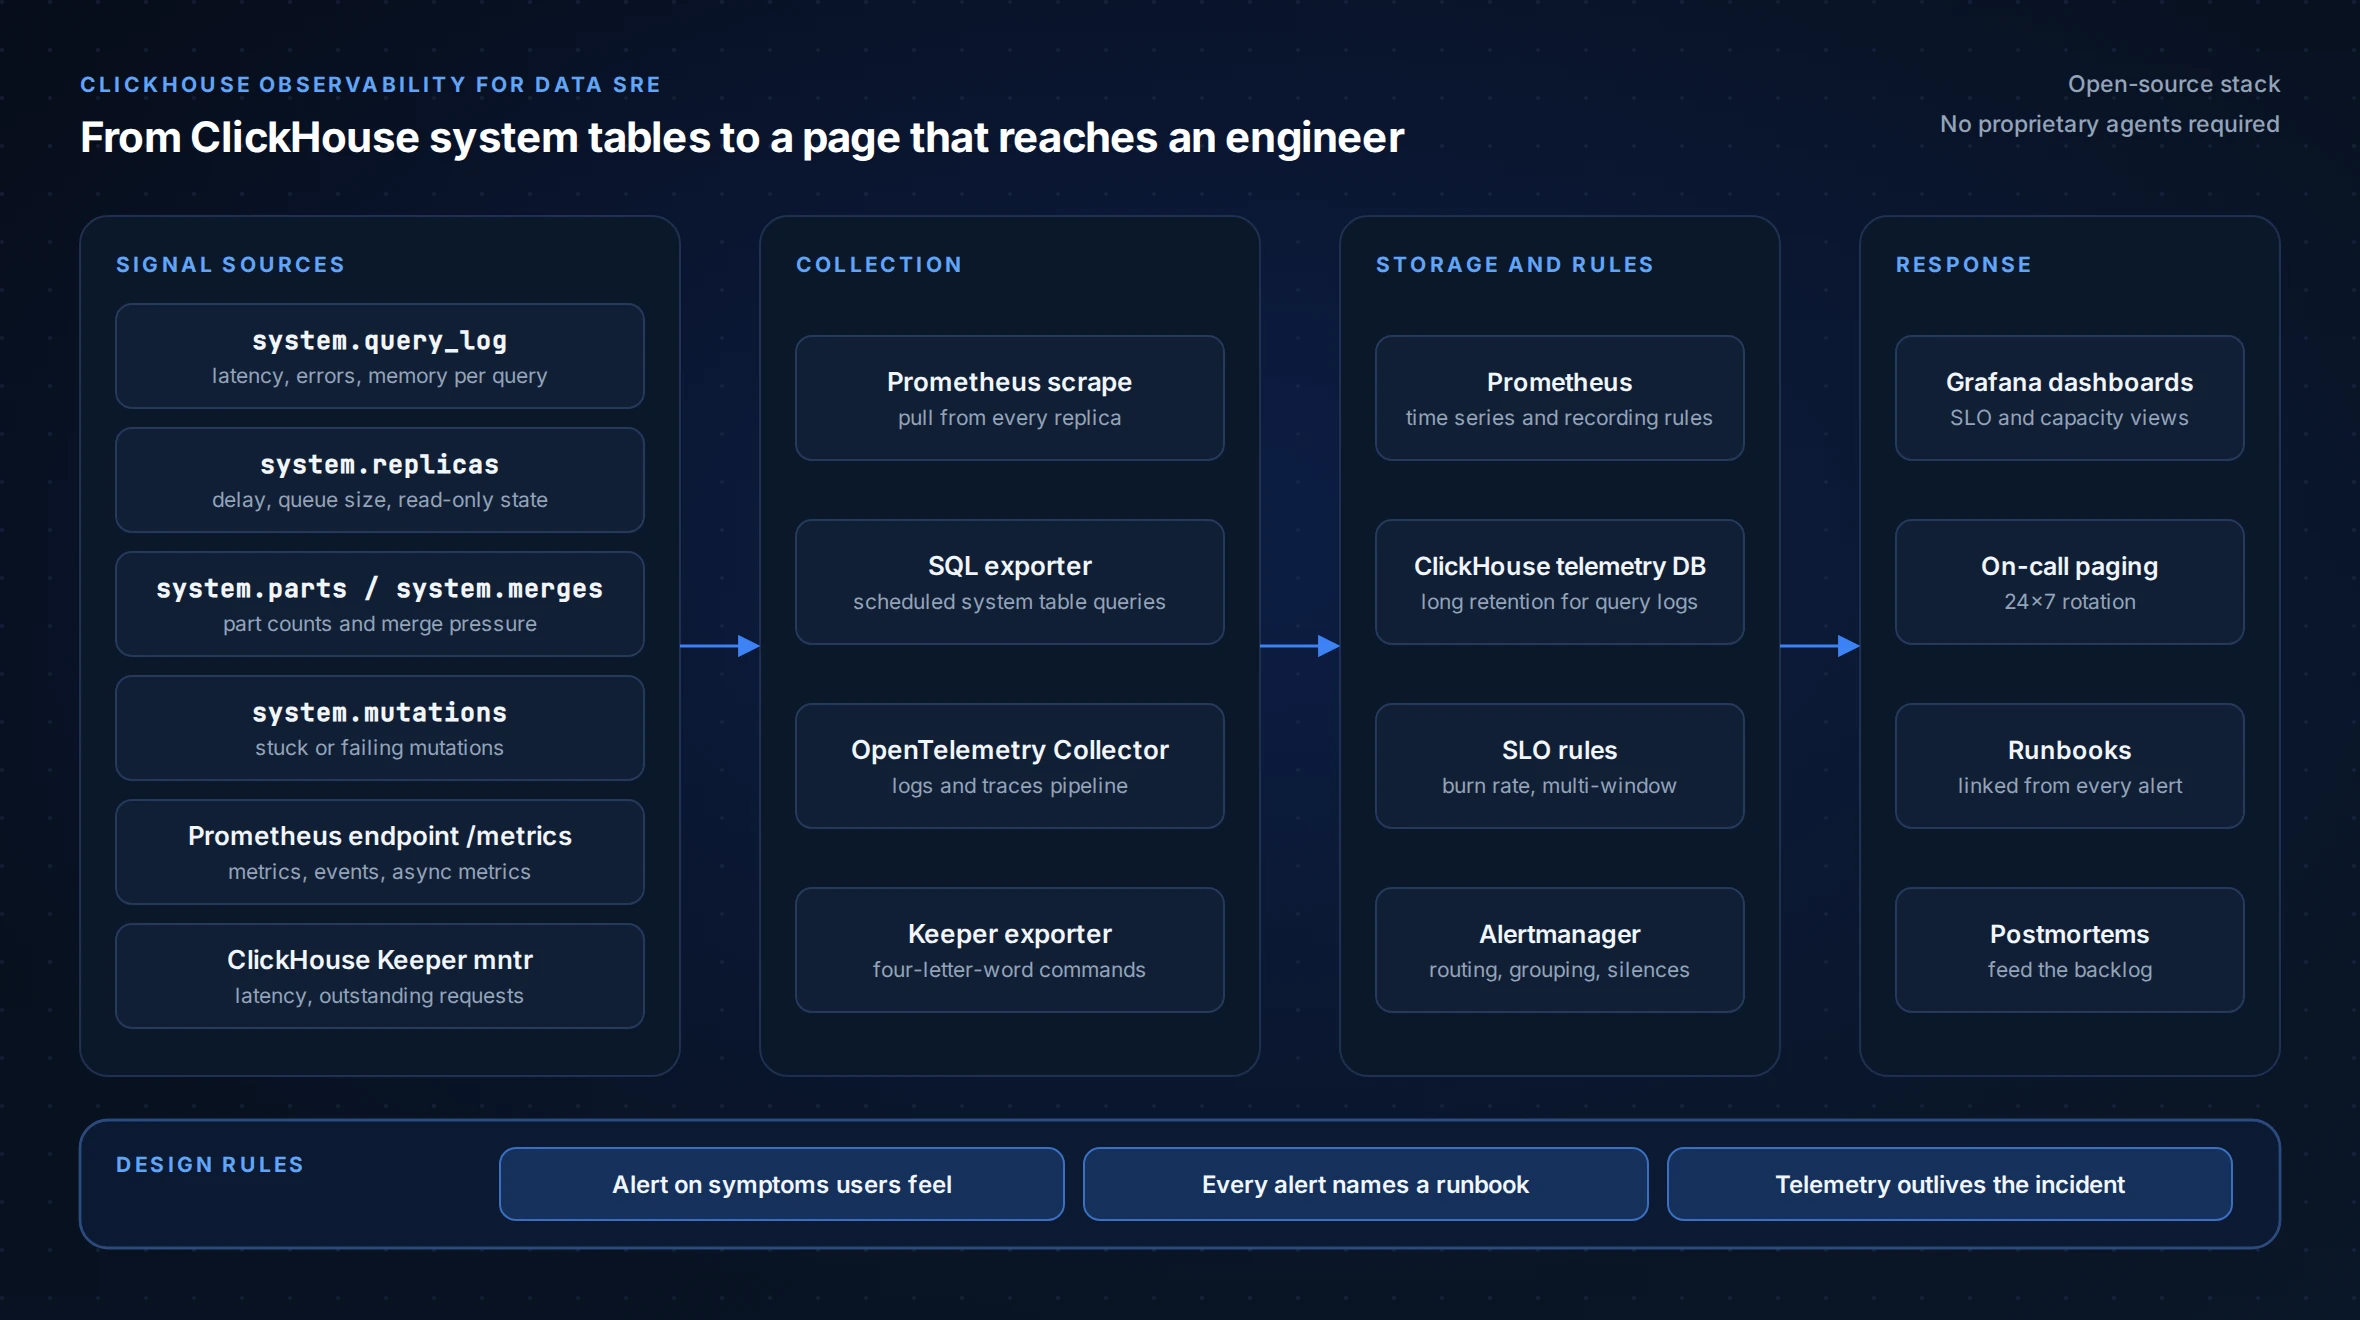
Threshold alerts (“CPU above 80%”) page people for conditions users never notice and stay silent during slow degradations. Burn-rate alerting asks a better question: at the current error rate, how quickly will the budget run out? We use the multi-window, multi-burn-rate pattern described in the Google SRE Workbook chapter on alerting on SLOs, fed by the Prometheus endpoint that ClickHouse exposes natively.
<!-- /etc/clickhouse-server/config.d/prometheus.xml
     New listener: requires a server restart. Restrict port 9363 to the
     monitoring network before enabling. -->
<clickhouse>
    <prometheus>
        <endpoint>/metrics</endpoint>
        <port>9363</port>
        <metrics>true</metrics>
        <events>true</events>
        <asynchronous_metrics>true</asynchronous_metrics>
    </prometheus>
</clickhouse>
# prometheus/rules/clickhouse-slo.yml (99.9% availability objective)
groups:
- name: clickhouse-slo-burn
rules:
- record: clickhouse:query_error_ratio:rate5m
expr: |
sum(rate(ClickHouseProfileEvents_FailedQuery[5m]))
/ sum(rate(ClickHouseProfileEvents_Query[5m]))
- record: clickhouse:query_error_ratio:rate1h
expr: |
sum(rate(ClickHouseProfileEvents_FailedQuery[1h]))
/ sum(rate(ClickHouseProfileEvents_Query[1h]))
- record: clickhouse:query_error_ratio:rate6h
expr: |
sum(rate(ClickHouseProfileEvents_FailedQuery[6h]))
/ sum(rate(ClickHouseProfileEvents_Query[6h]))
# Fast burn: 2% of a 30-day budget gone in one hour. Page.
- alert: ClickHouseErrorBudgetFastBurn
expr: |
clickhouse:query_error_ratio:rate1h > (14.4 * 0.001)
and clickhouse:query_error_ratio:rate5m > (14.4 * 0.001)
for: 2m
labels: {severity: page}
annotations:
summary: "ClickHouse availability budget burning at 14.4x"
runbook: "https://runbooks.example.internal/clickhouse/error-budget-fast-burn"
# Slow burn: 5% of the budget gone in six hours. Ticket.
- alert: ClickHouseErrorBudgetSlowBurn
expr: |
clickhouse:query_error_ratio:rate6h > (6 * 0.001)
and clickhouse:query_error_ratio:rate1h > (6 * 0.001)
for: 15m
labels: {severity: ticket}ClickHouseProfileEvents_FailedQuery counts every failed query, including client mistakes, so the Prometheus rule is the fast detector and the classified system.query_log figure from Practice 2 remains the number of record. Every paging alert carries a runbook link. An alert without a runbook is removed or demoted during the first month of an engagement. A Data SRE rotation should be paged rarely, and always for a reason a user would recognise.
Practice 4
Watch replication and ClickHouse Keeper as first-class signals
A ReplicatedMergeTree table can look healthy from the query side while one replica is read-only or an hour behind. In Data SRE the replication state is an indicator in its own right, because it decides whether a failover is safe and whether readers are seeing current data.
-- Replicas that need attention right now.
SELECT
    hostName() AS host,
    database,
    table,
    is_readonly,
    is_session_expired,
    absolute_delay,
    queue_size,
    inserts_in_queue,
    merges_in_queue,
    log_max_index - log_pointer AS log_entries_behind,
    active_replicas,
    total_replicas
FROM clusterAllReplicas('cluster_name', system.replicas)
WHERE is_readonly
   OR is_session_expired
   OR absolute_delay > 60
   OR queue_size > 100
   OR active_replicas < total_replicas
ORDER BY absolute_delay DESC;
When the queue is not draining, system.replication_queue says why. The columns that matter are num_tries, last_exception and postpone_reason.
SELECT
    database,
    table,
    type,
    create_time,
    num_tries,
    substring(last_exception, 1, 160) AS last_exception,
    postpone_reason
FROM system.replication_queue
WHERE num_tries > 10
ORDER BY create_time
LIMIT 50;
ClickHouse Keeper (or ZooKeeper on older estates) sits underneath all of this. A slow or partitioned quorum turns into read-only replicas within seconds. We scrape the four-letter-word interface and alert on latency, outstanding requests and follower sync.
# Keeper health, run against every quorum member (default client port 9181).
echo mntr | nc keeper-1.internal 9181 | egrep \
  'zk_server_state|zk_avg_latency|zk_max_latency|zk_outstanding_requests|zk_synced_followers|zk_znode_count'

# From ClickHouse: which Keeper node is this server connected to?
clickhouse-client --query "
SELECT name, host, port, connected_time, is_expired
FROM system.zookeeper_connection"
The thresholds we start from are conservative: page when any replica is read-only for more than two minutes, when zk_outstanding_requests stays above zero for a sustained period, or when the number of synced followers drops below quorum minus one. They are tuned per estate during the first weeks, from measured baselines rather than copied defaults.
Practice 5
Keep merge and mutation pressure inside safe limits
The most common ClickHouse outage we are called into is not a crash. It is ingestion rejecting inserts with TOO_MANY_PARTS because parts are being created faster than merges can consolidate them. The cause is nearly always upstream: inserts that are too small, a partition key that is too fine, or a mutation that has monopolised the merge pool. Data SRE catches it while it is still a trend.
-- Active parts per partition against the server's own limits.
WITH
    (SELECT toUInt64(value) FROM system.merge_tree_settings
      WHERE name = 'parts_to_delay_insert') AS delay_limit,
    (SELECT toUInt64(value) FROM system.merge_tree_settings
      WHERE name = 'parts_to_throw_insert') AS throw_limit
SELECT
    database,
    table,
    partition,
    count() AS active_parts,
    delay_limit,
    throw_limit,
    round(100 * active_parts / throw_limit, 1) AS pct_of_throw_limit,
    formatReadableSize(sum(bytes_on_disk)) AS size_on_disk
FROM system.parts
WHERE active
GROUP BY database, table, partition
HAVING active_parts > delay_limit * 0.5
ORDER BY active_parts DESC
LIMIT 25;
Reading the limits from system.merge_tree_settings matters because the defaults have changed between releases and many estates override them per table. The same view of the world applies to mutations. An ALTER TABLE ... UPDATE or DELETE that cannot complete will retry indefinitely and hold merge capacity while it does.
-- Mutations that are stuck or failing.
SELECT
    database,
    table,
    mutation_id,
    substring(command, 1, 100) AS command,
    create_time,
    parts_to_do,
    latest_fail_time,
    substring(latest_fail_reason, 1, 160) AS latest_fail_reason
FROM clusterAllReplicas('cluster_name', system.mutations)
WHERE NOT is_done
  AND create_time < now() - INTERVAL 30 MINUTE
ORDER BY create_time;KILL MUTATION is sometimes the right call and is never the first one. Our runbook requires the failure reason to be read and recorded, the affected parts to be listed, and a second engineer to confirm before the command is run on production. Test the procedure on a staging copy first.The durable fix is an engineering change: larger insert batches or asynchronous inserts, a coarser partition key, or replacing row-level mutations with a ReplacingMergeTree or lightweight-delete design. Those changes come out of the reliability backlog, and the MergeTree storage engine guide explains the mechanics behind them.
Practice 6
Prove recovery with scheduled restore drills
A backup that has never been restored is a hope, not a control. Under Data SRE the recovery time objective and recovery point objective are tested on a calendar, the result is recorded, and a failed drill is handled as an incident. Replication is not a backup: a dropped table or a bad mutation replicates faithfully to every replica.
-- 1. Take a backup to object storage. Credentials come from the
--    environment or a named collection, never from the statement text.
BACKUP DATABASE analytics
TO S3('https://${BACKUP_BUCKET}.s3.amazonaws.com/clickhouse/2026-09-20/',
      '${AWS_ACCESS_KEY_ID}', '${AWS_SECRET_ACCESS_KEY}');

-- 2. Confirm it finished and note the size and duration.
SELECT name, status, error, start_time, end_time,
       formatReadableSize(total_size) AS total_size, num_files
FROM system.backups
ORDER BY start_time DESC
LIMIT 5;

-- 3. Restore one table into a scratch database and time it.
CREATE DATABASE IF NOT EXISTS restore_drill;

RESTORE TABLE analytics.events AS restore_drill.events
FROM S3('https://${BACKUP_BUCKET}.s3.amazonaws.com/clickhouse/2026-09-20/',
        '${AWS_ACCESS_KEY_ID}', '${AWS_SECRET_ACCESS_KEY}');

-- 4. Validate: row counts and a checksum over a stable key range.
SELECT 'source' AS side, count() AS row_count, sum(cityHash64(event_id)) AS checksum
FROM analytics.events WHERE event_date < today()
UNION ALL
SELECT 'restored', count(), sum(cityHash64(event_id))
FROM restore_drill.events WHERE event_date < today();
The drill report records four numbers: backup duration, restore duration, data volume and the validation result. Those numbers are what make an RTO credible. The scratch database is removed afterwards through your normal change process, with the object name confirmed by a second person before anything is dropped. For estates on older releases or with very large tables we use clickhouse-backup or filesystem snapshots instead, and the drill discipline is the same.
Practice 7
Plan capacity from measured growth and make changes reversible
Capacity planning in Data SRE starts from telemetry rather than from a vendor sizing sheet. Disk growth per table, peak memory per query class and concurrent query counts are trended, and the forecast is stated with the date on which a limit will be reached if nothing changes.
-- New data written per table per day, last 30 days (inserts only, merges excluded).
-- Requires system.part_log, which is enabled in the default packaged configuration.
SELECT
    database,
    table,
    event_date,
    formatReadableSize(sum(size_in_bytes)) AS written,
    sum(rows) AS rows_written
FROM system.part_log
WHERE event_type = 'NewPart'
  AND event_date >= today() - 30
GROUP BY database, table, event_date
ORDER BY database, table, event_date;

-- Free space per disk, to set against the growth rate.
SELECT name, path,
       formatReadableSize(free_space) AS free,
       formatReadableSize(total_space) AS total,
       round(100 * free_space / total_space, 1) AS free_pct
FROM system.disks;
Change safety is the other half. Most reliability loss in a mature estate is self-inflicted: an upgrade, a schema change, a settings change. Every change we make follows the same shape, and the same shape is written into every runbook we hand over:
- State the blast radius and the rollback path before the change is approved.
- Run a verification query that captures the state before the change.
- Apply the change to one replica or one shard first where the topology allows it.
- Run a validation query and compare it with the verification result.
- Hold for an agreed soak period while watching the burn rate, then proceed or roll back.
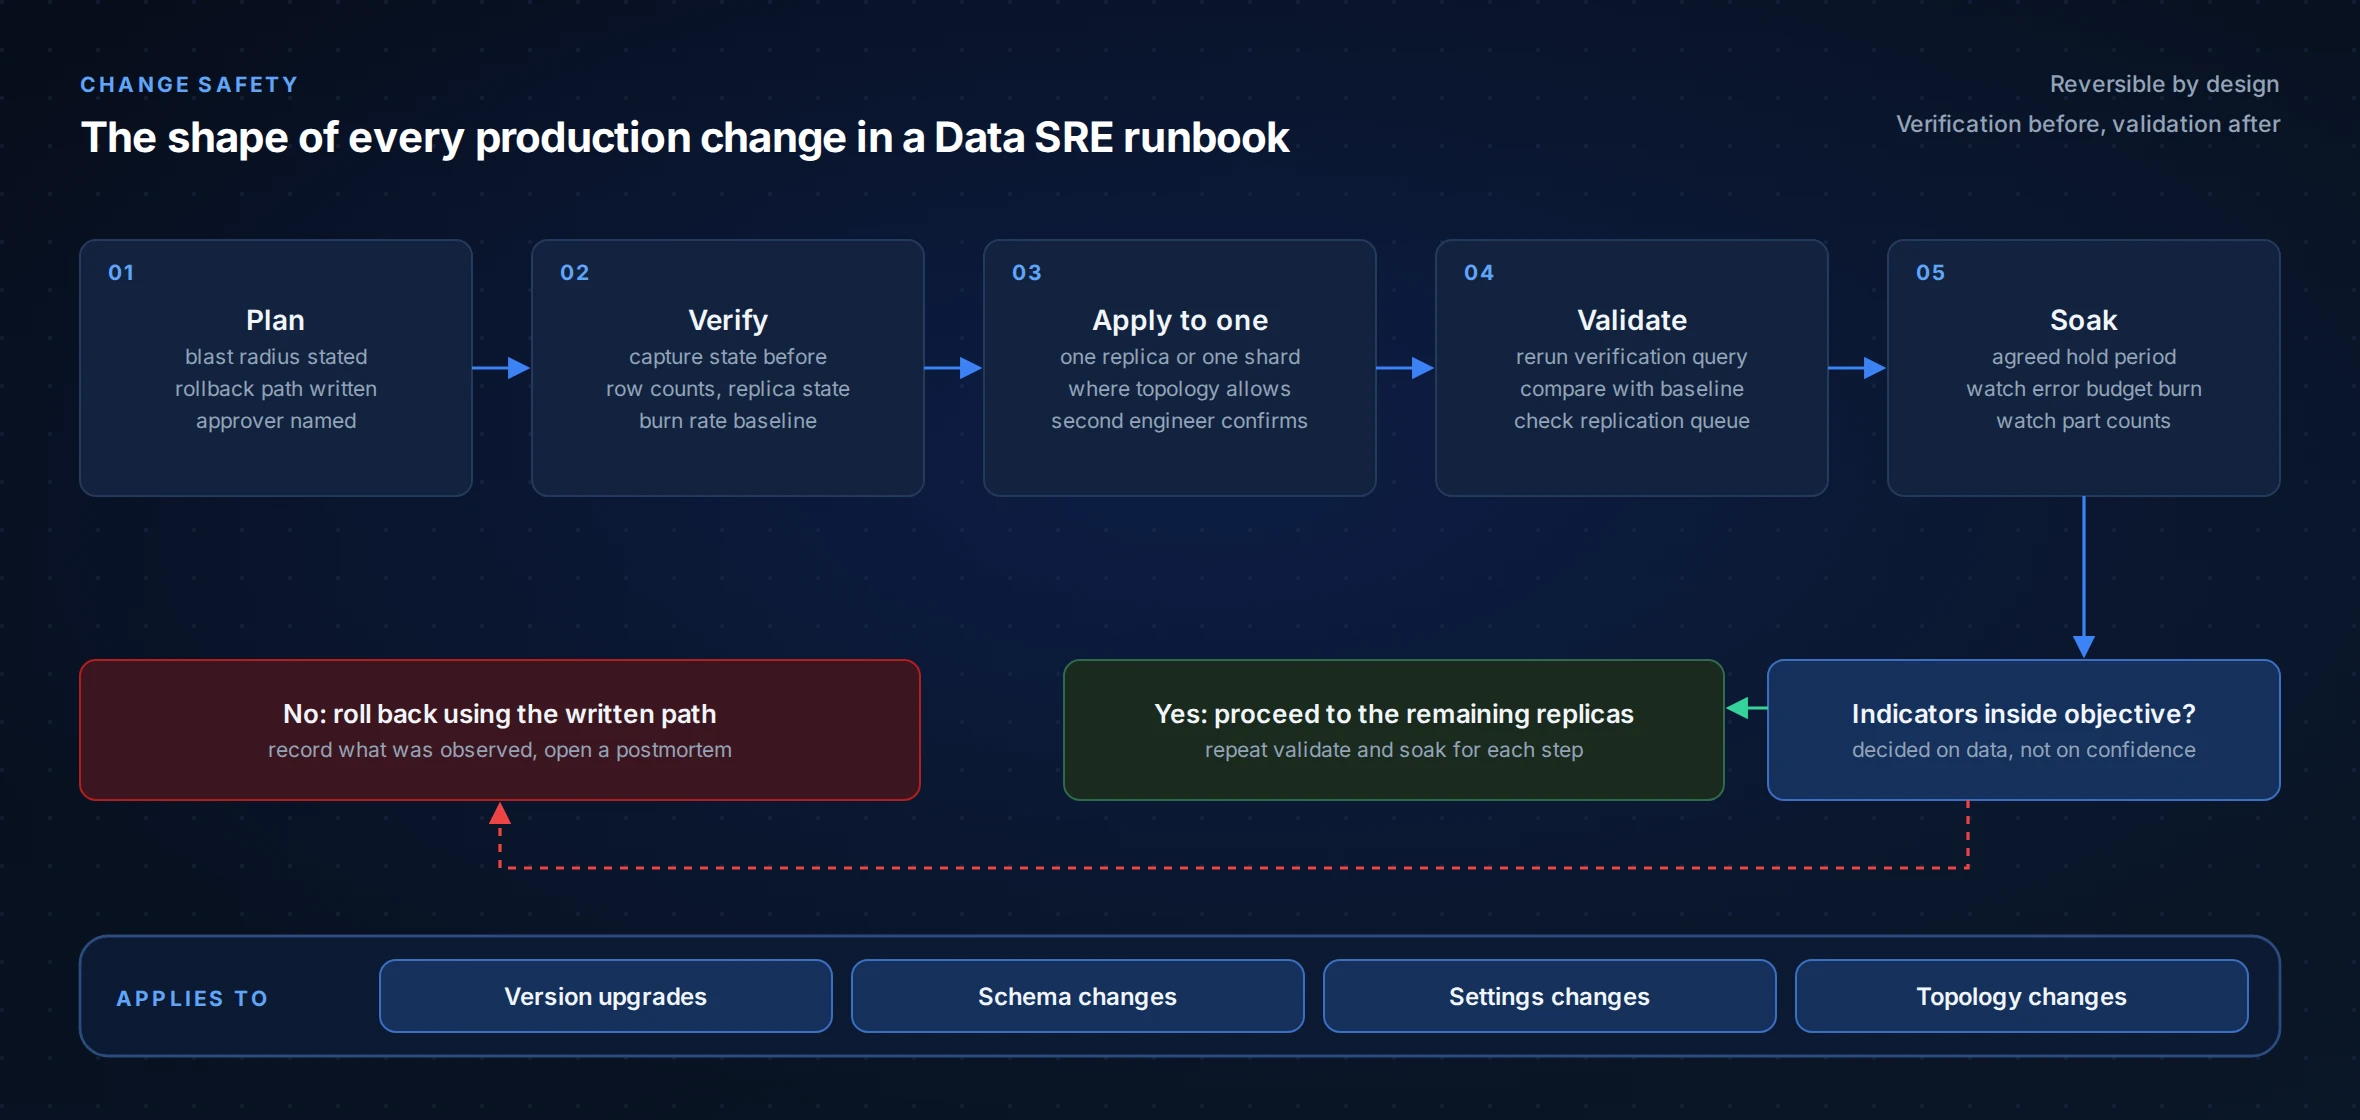
Upgrades follow the ClickHouse LTS calendar, one replica at a time, with the compatibility setting pinned until the whole cluster is on the new release. Schema changes on large tables are rehearsed on a restored copy from the most recent drill, which is one more reason the drills in Practice 6 pay for themselves.
Engagement
What a ChistaDATA Data SRE engagement delivers
Data SRE is delivered as part of ClickHouse managed services and 24×7 ClickHouse enterprise support, or as a fixed-scope reliability programme for teams that run their own on-call rotation. The engagement is led by a named principal engineer and every phase ends in a written deliverable your team keeps.
Weeks 1 to 2: reliability baseline
Telemetry review across system.query_log, system.replicas, system.parts and Keeper. Output: a baseline report with current indicators, the top reliability risks ranked by likelihood and impact, and proposed objectives per workload tier.
Weeks 3 to 6: instrumentation and runbooks
SLO recording rules, burn-rate alerts, Grafana views and a runbook for every paging alert, each with verification, action, validation and rollback steps. Output: the alert catalogue and the runbook set, in your repository.
Ongoing: operate and improve
On-call coverage under the published severity matrix, monthly error budget reviews, quarterly restore and failover drills, and blameless postmortems. Output: a reliability backlog that is reprioritised every month against budget impact.
Data SRE incident response under the enterprise SLA
| Severity | Definition | Response target |
|---|---|---|
| Severity 1 | Production down or data at risk | 15 minutes |
| Severity 2 | Production degraded, workaround exists | 12 hours |
| Severity 3 | Non-production or minor production issue | 24 hours |
| Severity 4 | Question, guidance or planned work | 48 hours |
Teams that need a point-in-time assessment before committing to a programme usually start with a ClickHouse performance audit, and architecture questions that come out of the baseline are handled through ClickHouse consulting. Data SRE is not the right first step for every team: a single-node cluster behind an internal dashboard rarely needs an error budget, and we will say so.
FAQ
Data SRE questions we are asked most often
How is Data SRE different from database monitoring?
Monitoring tells you what a system is doing. Data SRE defines what the system is supposed to do, measures the gap as an error budget, and uses that budget to decide when to page, when to freeze changes and what engineering work comes next. Monitoring is one input to the practice rather than the practice itself.
Does Data SRE replace our DBA or platform team?
No. Data SRE gives the team you already have a shared set of objectives, alerts that are worth waking up for, and rehearsed runbooks. Some customers hand on-call to us entirely, others keep first-line response and use our engineers as escalation. Both models work under the same objectives and runbooks.
Which ClickHouse deployments do you run Data SRE on?
Self-managed ClickHouse on bare metal, virtual machines and Kubernetes, and managed platforms including ClickHouse Cloud, Aiven and Altinity.Cloud. On managed platforms some signals, such as Keeper internals and host-level metrics, belong to the provider, so the indicator set is adapted to what the platform exposes.
What tooling do we need before an engagement starts?
Nothing proprietary. The reference stack is the ClickHouse Prometheus endpoint, Prometheus, Alertmanager and Grafana, with an optional retained telemetry database in ClickHouse for long-window objectives. If you already run Datadog, Grafana Cloud or another platform, the same rules and queries are implemented there.
How long before we see a measurable result?
The baseline report arrives in the first two weeks and usually surfaces risks that can be closed immediately, such as unmonitored read-only replicas or backups that have never been restored. Objectives and burn-rate alerting are typically live by week six. We do not quote improvement percentages in advance, because the honest answer depends on where your estate starts.
Can Data SRE work alongside our existing incident process?
Yes. We map our severity matrix to yours, join your incident channel and paging tool, and write postmortems in your template. The practice is deliberately tool-agnostic so that it strengthens the process you have instead of adding a second one.
Put your ClickHouse estate on a measured reliability footing
A fifteen-minute conversation with a ChistaDATA principal engineer is enough to establish whether Data SRE fits your estate and what the baseline would cover. Every recommendation we make should be tested in your own environment before it reaches production, and none of it removes the need for a rehearsed disaster recovery plan. Our ClickHouse SRE engineers and the wider data reliability engineering practice work as an extension of your team, not a replacement for it.