ClickHouse Performance Detective’s Toolkit: CLI Strategies for Common ClickHouse Bottlenecks
When your ClickHouse database starts showing signs of performance degradation, the command-line interface becomes your most powerful diagnostic tool. Unlike traditional databases that rely heavily on GUI monitoring solutions, ClickHouse’s CLI offers unparalleled visibility into system internals, query execution patterns, and resource utilization. This comprehensive guide explores the essential CLI strategies that database administrators and developers need to identify, diagnose, and resolve common ClickHouse performance bottlenecks.
Understanding ClickHouse Performance Challenges
ClickHouse’s columnar architecture and distributed nature create unique performance characteristics that require specialized diagnostic approaches. Common bottlenecks include unoptimized queries, resource contention, improper configuration, and data organization issues. The key to effective troubleshooting lies in understanding how to leverage ClickHouse’s extensive CLI toolkit and system tables to pinpoint the root cause of performance issues.
Modern ClickHouse deployments face several recurring challenges: queries that read excessive amounts of data, memory pressure from complex aggregations, inefficient data partitioning leading to too many small parts, and suboptimal primary key design. Each of these issues manifests differently in system metrics and requires targeted diagnostic strategies.
Essential CLI Commands for Performance Monitoring
Core Diagnostic Options
The ClickHouse client provides several built-in options specifically designed for performance analysis:
- –progress: Displays real-time query execution progress
- –progress-table: Shows detailed progress metrics with changing statistics
- –hardware-utilization: Prints hardware utilization within the progress bar
- –memory-usage: Outputs memory usage statistics to stderr
- –print-profile-events: Displays ProfileEvents packets for detailed performance insights
- –stacktrace: Prints stack traces when exceptions occur
- –time: Outputs query execution time for benchmarking purposes
These options transform the CLI from a simple query interface into a comprehensive performance monitoring tool. For example, running a complex analytical query with –memory-usage –progress-table –time provides immediate visibility into resource consumption patterns and execution bottlenecks.
Advanced Profiling with EXPLAIN
The EXPLAIN statement serves as the cornerstone of query performance analysis. It offers multiple analysis modes:
- EXPLAIN PLAN: Shows the query execution plan
- EXPLAIN PIPELINE: Reveals the processing pipeline structure
- EXPLAIN indexes: Displays used indexes and filtered parts/granules
- EXPLAIN projections: Shows projection analysis and filtering effects
When combined with CLI options, EXPLAIN provides deep insights into query optimization opportunities and execution bottlenecks.
System Tables: The Heart of Performance Monitoring
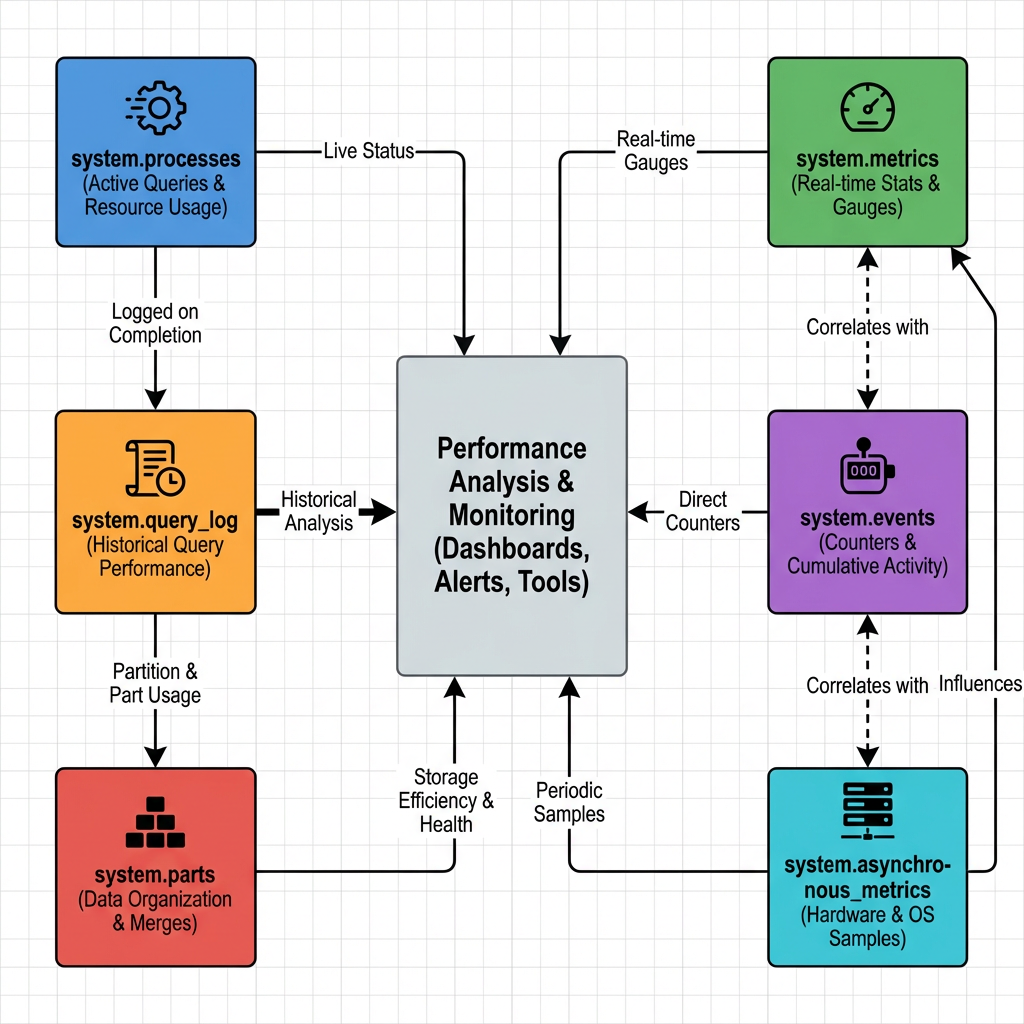
ClickHouse’s system tables form an interconnected monitoring ecosystem that provides comprehensive visibility into database performance. Understanding these relationships is crucial for effective troubleshooting.
Critical System Tables for Performance Analysis
- system.query_log serves as the primary source for query performance analysis. It captures detailed execution statistics, resource usage, and timing information for all queries. This table enables identification of slow queries, resource-intensive operations, and usage patterns across the organization.
- system.processes provides real-time visibility into currently executing queries. It’s essential for identifying long-running or stuck queries that may be consuming excessive resources.
- system.parts offers insights into data organization and storage efficiency. This table helps identify partitioning issues, compression problems, and primary key sizing concerns.
- system.metrics, system.events, and system.asynchronous_metrics provide real-time and historical performance counters 5. These tables capture hardware utilization, query execution statistics, and system-level performance indicators.
Diagnostic Workflow for Common Bottlenecks
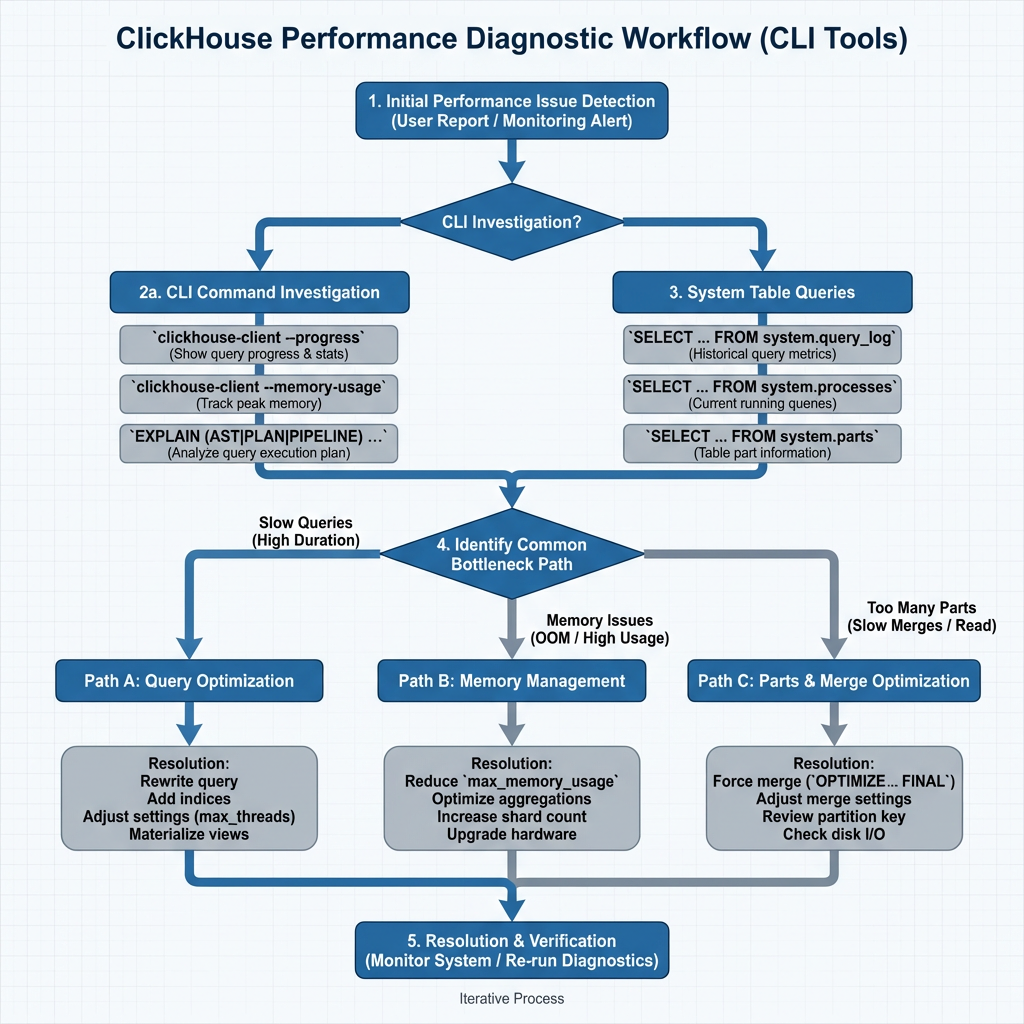
Step 1: Initial Performance Assessment
Begin every diagnostic session by establishing baseline performance metrics. Use the following CLI approach:
-- Identify recent slow queries
SELECT query_duration_ms, query, user, client_name
FROM system.query_log
WHERE event_time > now() - INTERVAL 1 HOUR
ORDER BY query_duration_ms DESC
LIMIT 10;
Step 2: Resource Utilization Analysis
Memory and CPU bottlenecks often manifest as the primary performance limiters. The CLI provides several diagnostic approaches:
-- Check current memory usage by query
SELECT query_id, memory_usage, peak_memory_usage, query
FROM system.processes
ORDER BY memory_usage DESC;
For historical analysis, examine the asynchronous metrics:
-- Hardware utilization trends
SELECT metric, value, event_time
FROM system.asynchronous_metric_log
WHERE metric IN ('MemoryResident', 'CPUUsage', 'DiskSpaceUsed')
AND event_time > now() - INTERVAL 1 DAY
ORDER BY event_time DESC;
Step 3: Data Organization Assessment
Poor data organization frequently causes performance degradation. Use these diagnostic queries to identify issues:
-- Table sizes and compression analysis
SELECT table,
    formatReadableSize(sum(bytes)) as size,
    sum(rows) as rows,
    formatReadableSize(sum(primary_key_bytes_in_memory)) as primary_key_size
FROM system.parts
WHERE active
GROUP BY table
ORDER BY sum(bytes) DESC;
Excessive parts per partition indicate suboptimal data organization:
-- Parts per partition analysis
SELECT concat(database, '.', table) as table_name,
    partition_id,
    count() as parts_count
FROM system.parts
WHERE active
GROUP BY database, table, partition_id
HAVING parts_count > 100
ORDER BY parts_count DESC;
Step 4: Query Pattern Analysis
Understanding query patterns helps identify optimization opportunities:
-- Query volume by client and type
SELECT client_name,
    count() as query_count,
    query_kind,
    toStartOfMinute(event_time) as time_bucket
FROM system.query_log
WHERE type = 'QueryStart'
AND event_time > now() - INTERVAL 10 MINUTE
GROUP BY time_bucket, client_name, query_kind
ORDER BY time_bucket DESC, query_count DESC;
Advanced Troubleshooting Techniques
Long-Running Query Analysis
When queries become stuck or run indefinitely, use the stack trace functionality for deep diagnosis:
-- First, identify the problematic query
SELECT elapsed, query_id, query, initial_user
FROM system.processes
ORDER BY elapsed DESC
LIMIT 1;

-- Then get the stack trace
SET allow_introspection_functions=1;
SELECT arrayStringConcat(
    arrayMap(x, y -> concat(x, ': ', y),
        arrayMap(x -> addressToLine(x), trace),
        arrayMap(x -> demangle(addressToSymbol(x)), trace)
    ), '\n'
) as stack_trace
FROM system.stack_trace
WHERE query_id = 'your-query-id-here';
Compression and Storage Optimization
Poor compression ratios indicate suboptimal column types or data patterns:
-- Detailed compression analysis
SELECT table,
    formatReadableSize(sum(data_uncompressed_bytes)) as uncompressed_size,
    formatReadableSize(sum(data_compressed_bytes)) as compressed_size,
    round(sum(data_compressed_bytes) / sum(data_uncompressed_bytes), 3) as compression_ratio,
    round(100 - ((sum(data_compressed_bytes) * 100) / sum(data_uncompressed_bytes)), 3) as compression_percentage
FROM system.columns
GROUP BY table
ORDER BY compression_ratio DESC;
Memory Pressure Diagnosis
Memory-related bottlenecks require careful analysis of allocation patterns and query resource usage:
-- Memory usage by database and table
SELECT database, table,
    formatReadableSize(sum(memory_usage)) as memory_used
FROM system.parts
WHERE active
GROUP BY database, table
ORDER BY sum(memory_usage) DESC;
Performance Optimization Best Practices
Query Optimization Principles
Effective ClickHouse performance tuning follows three core principles:
- Faster queries read less data: Optimize filtering conditions and column selection
- Avoid unnecessary work at query time: Leverage materialized views and pre-aggregations
- Filter first, then aggregate: Structure queries to minimize data processing
Monitoring and Alerting Strategy
Implement continuous monitoring using CLI-based scripts that query system tables regularly. Key metrics to track include:
- Query execution times exceeding baseline thresholds
- Memory usage approaching system limits
- Parts count per partition exceeding optimal ranges
- Primary key sizes growing beyond memory capacity
Configuration Optimization
Use CLI tools to validate configuration changes and their performance impact. The –hardware-utilization flag helps correlate configuration adjustments with resource utilization patterns.
Conclusion
Mastering ClickHouse performance troubleshooting requires a systematic approach that leverages the full power of CLI tools and system tables. The diagnostic workflow presented here provides a structured methodology for identifying and resolving common bottlenecks, from query optimization challenges to data organization issues.
The key to successful performance detective work lies in understanding the relationships between different system components and using the appropriate CLI tools for each diagnostic scenario. By combining real-time monitoring capabilities with historical analysis through system tables, database administrators can maintain optimal ClickHouse performance even as data volumes and query complexity continue to grow.
Regular application of these CLI strategies, combined with proactive monitoring and systematic optimization practices, ensures that ClickHouse deployments continue to deliver the high-performance analytics capabilities that make the platform so valuable for modern data-driven organizations. The investment in mastering these diagnostic techniques pays dividends in reduced troubleshooting time, improved system reliability, and enhanced overall database performance.
Further Reading
- Real-Time Analytics with ClickHouse
- ChistaDATA University
- ClickHouse Support
- Data Analytics on ClickHouse