ChistaDATA · DBaaS optimisation for RDS, Aurora, Cloud SQL, AlloyDB and Azure Database, with 24×7 support
DBaaS optimisation is the engineering discipline of reading a managed-database bill as a set of meters, tracing each meter back to the SQL statements and schema decisions that drive it, and changing those before touching the instance. ChistaDATA delivers it as an evidence-led assessment, hands-on engineering on your PostgreSQL and MySQL-family DBaaS, and 24×7 consultative support or managed services that keep the bill from drifting back.
This page sets out the method at engineering depth: the cost anatomy of a statement on RDS, Aurora, Cloud SQL and Azure Database; the catalog and provider telemetry the assessment is built from; the five levers applied in a fixed order; the architectural option of moving analytical reads to ClickHouse; and the FinOps cadence and guardrails that hold the result.
On this page
- Cost anatomy: what DBaaS optimisation is optimising
- The evidence pack: catalog and provider telemetry
- The DBaaS optimisation loop: measure, rank, engineer, verify, hold
- Lever 1: SQL and index engineering
- Lever 2: connections, pooling and memory
- Lever 3: storage class, instance class and commitments
- Lever 4: architecture, and when analytics leaves the DBaaS
- Lever 5: autoscaling and serverless governance
- The DBaaS optimisation cadence and guardrails
- How ChistaDATA delivers DBaaS optimisation
- DBaaS optimisation FAQ
Cost anatomy
What DBaaS optimisation is actually optimising: four meters and the statements behind them
A managed database moves the cost of inefficiency from a capital line to a monthly one. On a fixed on-premises server, a query that scans a table it should have indexed costs latency; on Amazon RDS, Aurora, Google Cloud SQL, AlloyDB or Azure Database for PostgreSQL and MySQL, the same query is metered. Every DBaaS bill, whatever the provider’s naming, reduces to four meters: compute (instance hours, vCores or Aurora Serverless v2 ACU-seconds), I/O (provisioned IOPS, io2 throughput, Aurora Standard I/O requests), storage and backup (GB-month for volumes, snapshots and log retention), and data transfer (cross-AZ replication, egress to clients, cross-region replicas).
Each of those meters is driven by a metric the engine already exposes. CPU is driven by execution time per statement fingerprint; I/O by buffer misses (shared_blks_read in PostgreSQL, Innodb_buffer_pool_reads in MySQL); storage by bloat, dead tuples, index bytes and WAL or binlog volume; transfer by result-set size and replica placement. DBaaS optimisation is the act of joining the two views and then working on the statements, because that is where the meter is actually set.
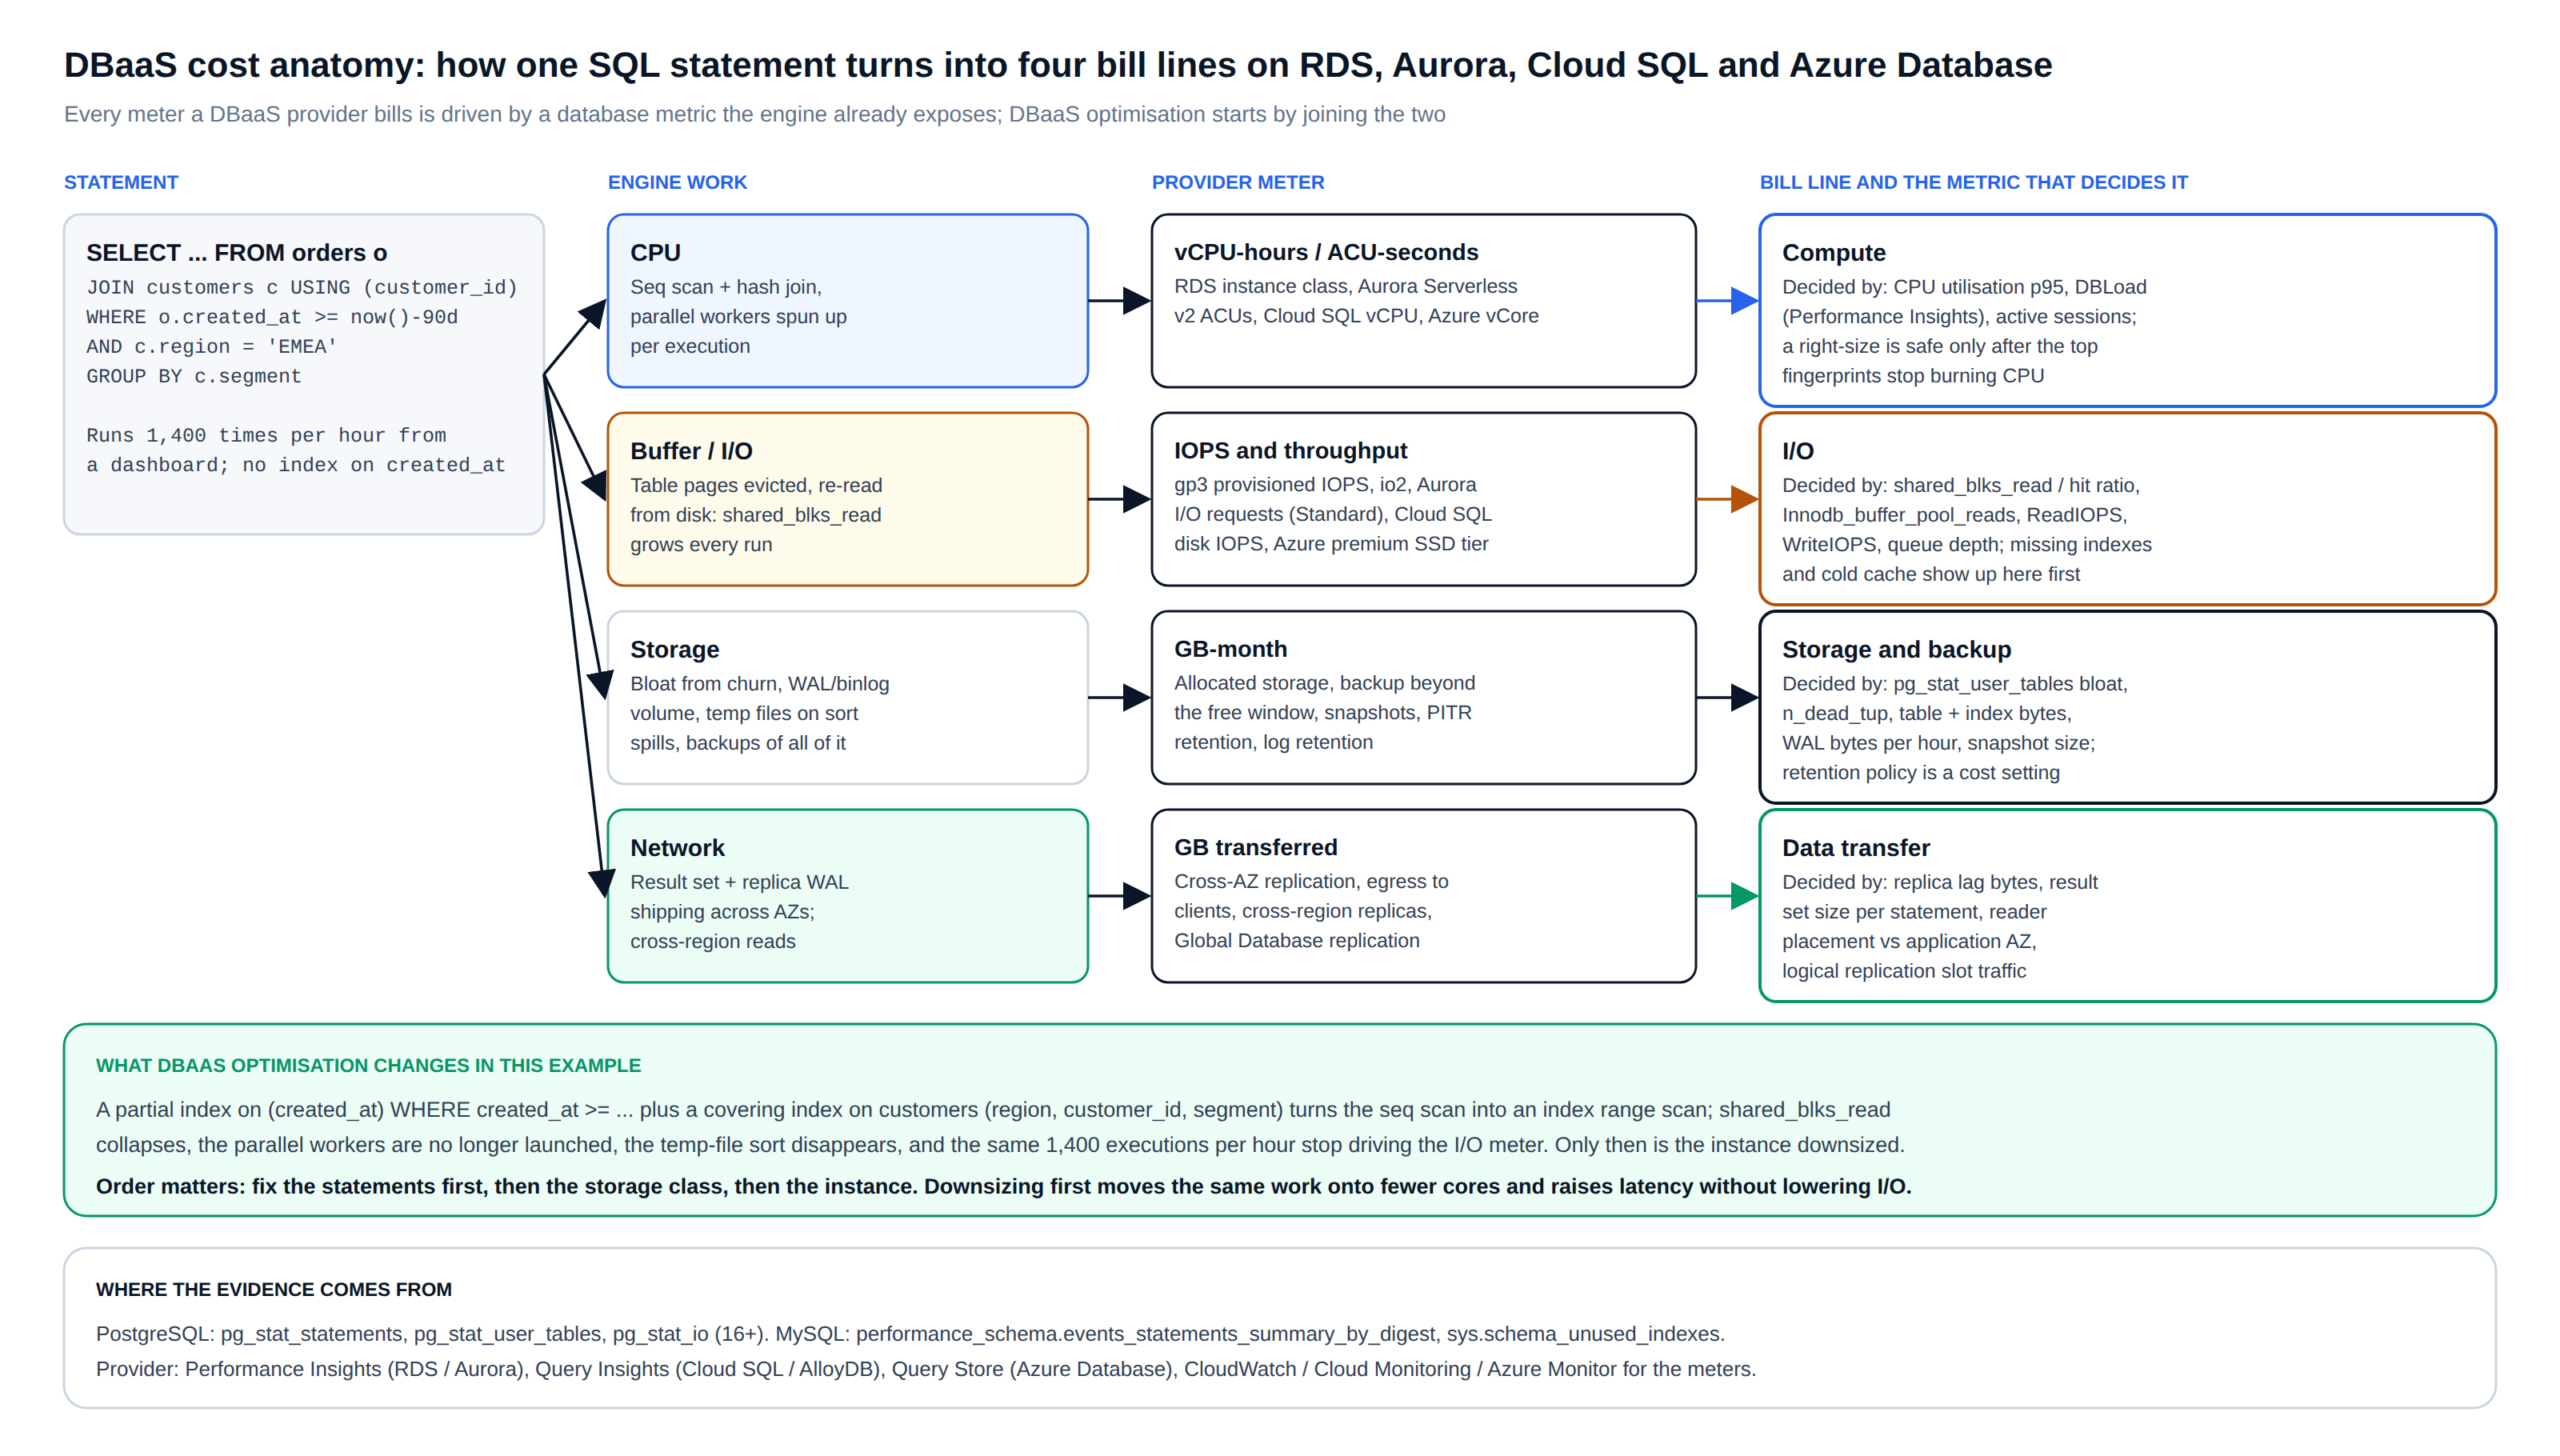
| Bill line | How the providers meter it | The engine metric that moves it |
|---|---|---|
| Compute | RDS and Cloud SQL instance class hours; Aurora Serverless v2 ACU-seconds; Azure vCore hours | total_exec_time per fingerprint, DBLoad (Performance Insights), CPU p95, parallel workers launched |
| I/O | gp3 and io2 provisioned IOPS and throughput; Aurora Standard I/O requests versus I/O-Optimized; Cloud SQL disk IOPS; Azure premium SSD tier | shared_blks_read, buffer hit ratio, Innodb_buffer_pool_reads, ReadIOPS, WriteIOPS, queue depth |
| Storage and backup | Allocated GB-month; automated backup beyond the free window; manual snapshots; PITR and log retention | Table and index bytes, n_dead_tup, bloat ratio, WAL bytes per hour, snapshot size, retention days |
| Data transfer | Cross-AZ replication and reader traffic; egress to clients; cross-region and Global Database replication | Result rows per statement, replica lag bytes, reader placement versus application AZ, logical slot traffic |
Evidence
The DBaaS optimisation evidence pack: catalog views and provider telemetry, read together
The assessment starts with seven days of engine telemetry placed next to seven days of bill lines. On PostgreSQL-family services the core source is pg_stat_statements, which RDS, Aurora, Cloud SQL and Azure all expose, joined to pg_stat_user_tables, pg_stat_user_indexes and, on PostgreSQL 16+, pg_stat_io. On MySQL-family services it is performance_schema.events_statements_summary_by_digest and the sys schema views. Provider layers add per-statement load over time: Performance Insights on RDS and Aurora, Query Insights on Cloud SQL and AlloyDB, Query Store on Azure Database for PostgreSQL.
-- DBaaS optimisation evidence, PostgreSQL 15+ (RDS, Aurora, Cloud SQL, AlloyDB, Azure): rank fingerprints by the meter they drive
SELECT queryid,
       calls,
       round(total_exec_time::numeric / 1000, 1)                       AS total_s,
       round(mean_exec_time::numeric, 2)                               AS mean_ms,
       shared_blks_read + shared_blks_written + temp_blks_written      AS io_blocks,
       round(100.0 * shared_blks_hit / greatest(shared_blks_hit + shared_blks_read, 1), 1) AS hit_pct,
       rows,
       left(query, 90)                                                 AS sample
FROM pg_stat_statements
WHERE dbid = (SELECT oid FROM pg_database WHERE datname = current_database())
ORDER BY io_blocks DESC          -- I/O meter first; re-run ORDER BY total_exec_time DESC for the compute meter
LIMIT 20;

-- Unused indexes: paid for on every write as WriteIOPS and WAL bytes, never read
SELECT schemaname, relname, indexrelname, idx_scan,
       pg_size_pretty(pg_relation_size(indexrelid)) AS index_size
FROM pg_stat_user_indexes
WHERE idx_scan = 0 AND indexrelname NOT LIKE '%_pkey'
ORDER BY pg_relation_size(indexrelid) DESC;
-- DBaaS optimisation evidence, MySQL 8.0 / 8.4 (RDS, Aurora MySQL, Cloud SQL, Azure Database for MySQL)
SELECT DIGEST_TEXT,
COUNT_STAR AS calls,
ROUND(SUM_TIMER_WAIT / 1e12, 1) AS total_s,
SUM_ROWS_EXAMINED / GREATEST(SUM_ROWS_SENT, 1) AS examined_per_row_sent,
SUM_NO_INDEX_USED,
SUM_CREATED_TMP_DISK_TABLES
FROM performance_schema.events_statements_summary_by_digest
ORDER BY SUM_ROWS_EXAMINED DESC
LIMIT 20;
SELECT * FROM sys.schema_unused_indexes;
SHOW GLOBAL STATUS LIKE 'Innodb_buffer_pool_read%'; -- reads vs read_requests: the I/O meter in two countersThe output of this phase is one ranked list of statement fingerprints, each tagged with the meter it drives and its share of that meter. That list is the artefact the whole DBaaS optimisation engagement is organised around: it decides what is engineered first, it is what the verification phase re-measures, and it is what the quarterly review carries forward.
Method
The DBaaS optimisation loop: measure, rank, engineer, verify, hold
The order of operations is the method. Instances are never downsized first, because the same work then lands on fewer cores, p95 rises, and either autoscaling or an incident restores the cost within a week. Statements are fixed first, storage class second, instance class and commitments last, and every step has an exit gate that is a measurement rather than an opinion.
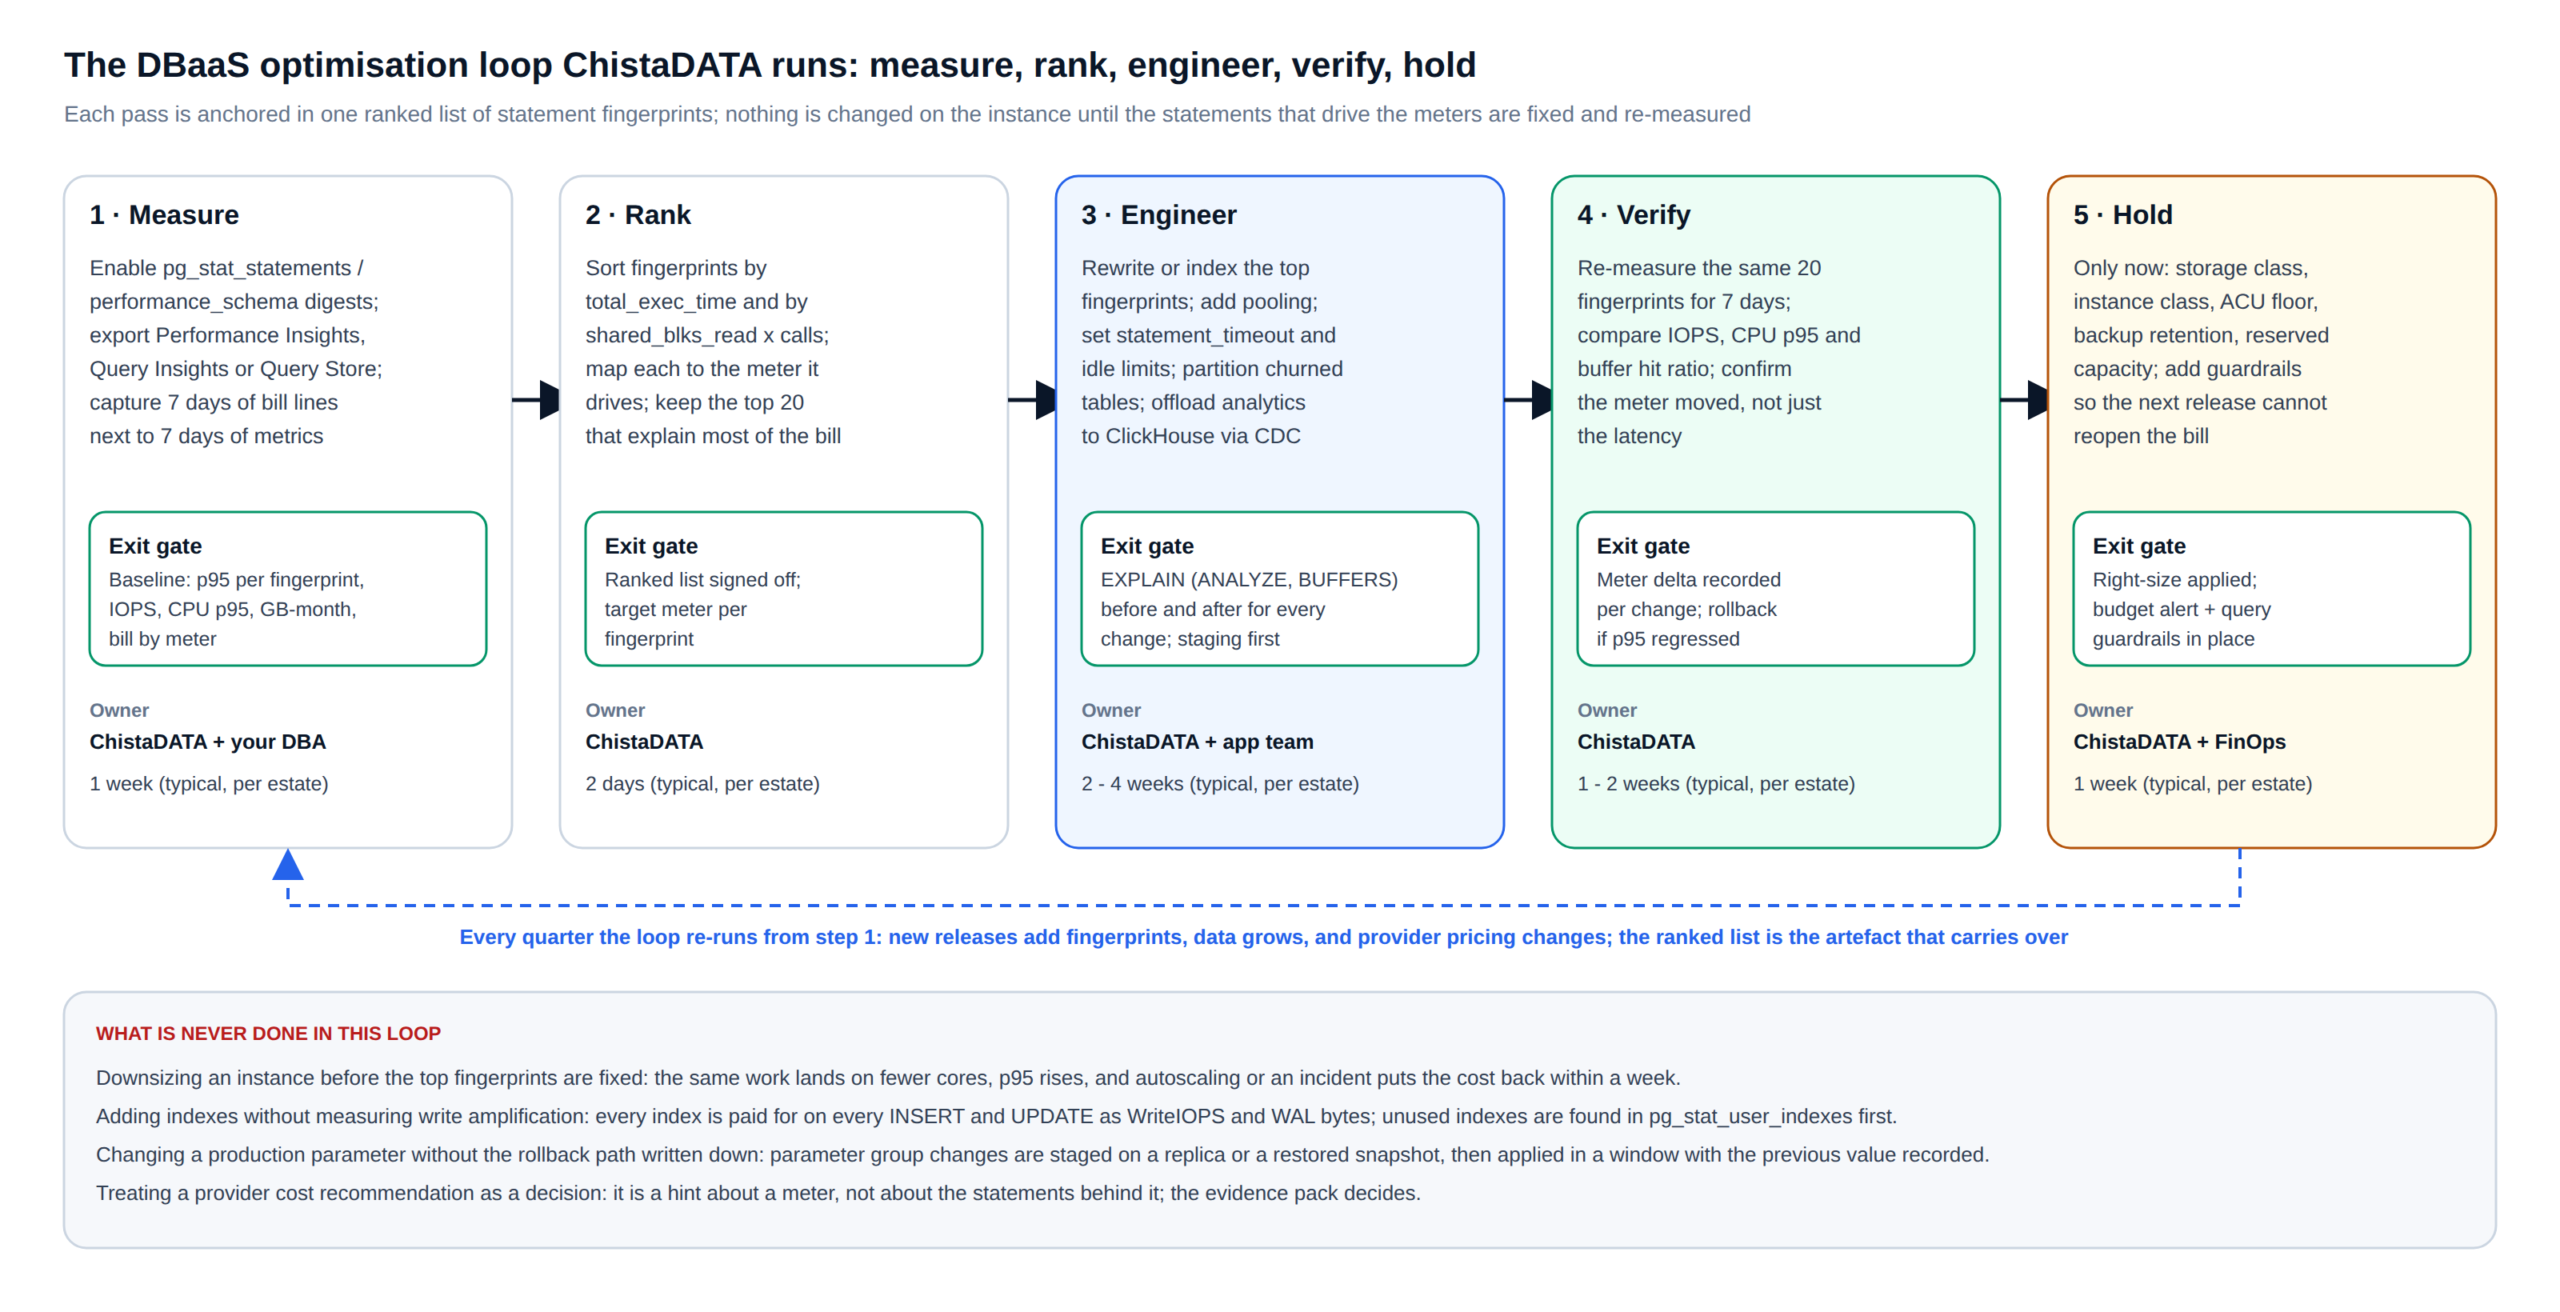
Two rules apply across all five steps. First, every change to a production database is staged on a replica or a restored snapshot, applied in a window, and recorded with its previous value and its rollback path, whether it is an index, a parameter-group change or an instance class. Second, the meter is what is verified, not the latency: a statement that got faster but still reads the same blocks has not reduced the I/O bill, and a right-size is approved only when the meter delta has held for seven days.
Lever 1
DBaaS optimisation at the statement: SQL rewrites and index engineering with plan evidence
Most of the compute and I/O meter is usually explained by a small number of fingerprints, and most of those are fixed by an index that matches the predicate and the sort, a rewrite that removes a correlated subquery or a SELECT *, or a partial or covering index that lets the executor answer from the index alone. The proof for every change is the plan with buffers, before and after, on a staging copy with production statistics.
-- Before: the Fig. 1 statement on a 400 GB orders table (illustrative), PostgreSQL 16 on Aurora
EXPLAIN (ANALYZE, BUFFERS, SETTINGS)
SELECT c.segment, count(*), sum(o.total)
FROM orders o JOIN customers c USING (customer_id)
WHERE o.created_at >= now() - INTERVAL '90 days' AND c.region = 'EMEA'
GROUP BY c.segment;
-- Parallel Seq Scan on orders ... Buffers: shared hit=212,410 read=3,948,117  (I/O meter: ~30 GB read per execution)

-- DBaaS optimisation change set (staged, then applied CONCURRENTLY in a window)
CREATE INDEX CONCURRENTLY idx_orders_created_at_recent
    ON orders (created_at) INCLUDE (customer_id, total)
    WHERE created_at >= DATE '2026-01-01';          -- partial: only the hot range is indexed and paid for
CREATE INDEX CONCURRENTLY idx_customers_region_segment
    ON customers (region, customer_id) INCLUDE (segment);

-- After: Index Only Scan using idx_orders_created_at_recent ... Buffers: shared hit=48,900 read=1,230
-- Validation: rerun EXPLAIN (ANALYZE, BUFFERS); compare shared read, temp written and execution time per call
-- Rollback: DROP INDEX CONCURRENTLY idx_orders_created_at_recent; (no data change, reversible in one statement)
Indexes are not free on a metered service: each one is written on every INSERT and UPDATE, which shows up as WriteIOPS and WAL or binlog bytes, and it adds to GB-month and to snapshot size. The unused-index query above is run before any index is added, duplicate and overlapping indexes are consolidated, and write amplification is measured on the staging copy using pg_stat_user_tables.n_tup_upd and WAL bytes per hour. Predicates that defeat indexes (functions on columns, implicit casts, leading wildcards) are rewritten in the application with the app team, with the fingerprint’s meter share as the priority.
Lever 2
Connections, pooling and memory: the DBaaS optimisation lever that changes the instance class you need
On PostgreSQL, every connection is a backend process with its own memory, and work_mem is allocated per sort or hash node per query, not per session. An application tier that opens 2,000 connections against an instance sized for 500 forces either an oversized instance class or a steady stream of memory pressure and connection errors. On MySQL, thread and buffer allocations behave similarly. Pooling is therefore a sizing lever, not just a stability one: with PgBouncer in transaction mode, RDS Proxy, Cloud SQL’s managed connection pooling or ProxySQL in front of MySQL, the instance is sized for active sessions rather than for open ones.
| Parameter | Typical DBaaS default | DBaaS optimisation posture | Reload or restart |
|---|---|---|---|
max_connections (PostgreSQL) | Derived from instance memory (RDS: DBInstanceClassMemory/9531392) | Cap at measured peak active sessions × 2 behind a pooler; never raise it to absorb application leaks | Restart |
work_mem | 4 MB | Set per role: higher for reporting roles with few sessions, lower for OLTP roles with many; watch temp_blks_written | Reload (per role: ALTER ROLE ... SET) |
idle_in_transaction_session_timeout | 0 (disabled) | 60 s to 5 min, so abandoned transactions stop holding locks and blocking vacuum | Reload |
statement_timeout | 0 (disabled) | Per role: seconds for OLTP roles, minutes for reporting; the single most effective cost guardrail | Reload |
innodb_buffer_pool_size (MySQL) | ~75% of instance memory | Keep; verify Innodb_buffer_pool_reads stays low before any downsize, since the pool shrinks with the class | Dynamic since 5.7 |
max_connections (MySQL) | Derived from memory | Bound by ProxySQL or the application pool; alert on Threads_running, not on Threads_connected | Dynamic |
Each parameter change is recorded as parameter, current value, proposed value, unit and whether it needs a reload or a restart, and is applied to a staging parameter group first. On Aurora and RDS a restart-class change is scheduled into the maintenance window with a failover to the reader where Multi-AZ allows it, so the application sees seconds rather than minutes.
Lever 3
Storage class, instance class and commitments: the DBaaS optimisation decisions made last, from evidence
Only after the top fingerprints are fixed and the meters have moved for seven days does the assessment turn to the instance. The storage decision comes first because it changes the I/O meter directly: gp3 with baseline IOPS versus provisioned IOPS, io2 for sustained write-heavy workloads, Aurora Standard versus I/O-Optimized (the break-even is a function of the I/O share of the bill, which the evidence pack already contains), Cloud SQL SSD versus Hyperdisk tiers, Azure premium SSD versus v2.
The instance decision follows, from CPU p95 and freeable memory after the change set, never from average CPU. Commitments (reserved instances, committed-use discounts, reserved capacity) are bought last, against the right-sized footprint, so that a one-year commitment is not made for a class the workload no longer needs.
# DBaaS optimisation right-size evidence, captured per instance for 7 days after the change set (illustrative)
instance:                 prod-orders-01 (Aurora PostgreSQL 16, db.r6g.4xlarge)
cpu_p95_before / after:   71% / 34%          # CloudWatch CPUUtilization, 1-minute
read_iops_p95:            18,400 / 2,900     # ReadIOPS; the Fig. 1 statement set is fixed
write_iops_p95:           4,100 / 3,700      # WriteIOPS; one unused index dropped
freeable_memory_min:      9.8 GB / 41 GB     # buffer cache no longer churned by scans
io_share_of_bill:         38% / 11%          # from Cost Explorer, Aurora Standard I/O line
top20_p95_ms:             640 / 95           # pg_stat_statements, same fingerprints
decision:                 db.r6g.2xlarge; stay on Aurora Standard (I/O-Optimized no longer breaks even)
rollback:                 modify-db-instance back to r6g.4xlarge; Multi-AZ failover, ~60 s
Backup and log retention are part of this lever: automated backup retention beyond the free window, manual snapshots that were never pruned, and long PITR windows are GB-month lines that grow with the database. They are set from the recovery objectives in your DR plan, which ChistaDATA reviews in the same assessment, and never silently reduced to save money.
Lever 4
Architectural DBaaS optimisation: caching, partitioning, replicas, and when analytics should leave the managed database
Some statements cannot be made cheap on a row store because they are the wrong shape for it. Dashboards that aggregate months of rows every minute, month-end reports, funnel and cohort queries, and analyst ad-hoc SQL all read wide ranges of a table that the OLTP engine stores row by row and that the provider bills per I/O request. The usual fixes inside the DBaaS (a reporting read replica, a larger instance) move the same work rather than removing it: the replica reads the same blocks and is billed for them, and the primary’s buffer cache is still churned by the scans.
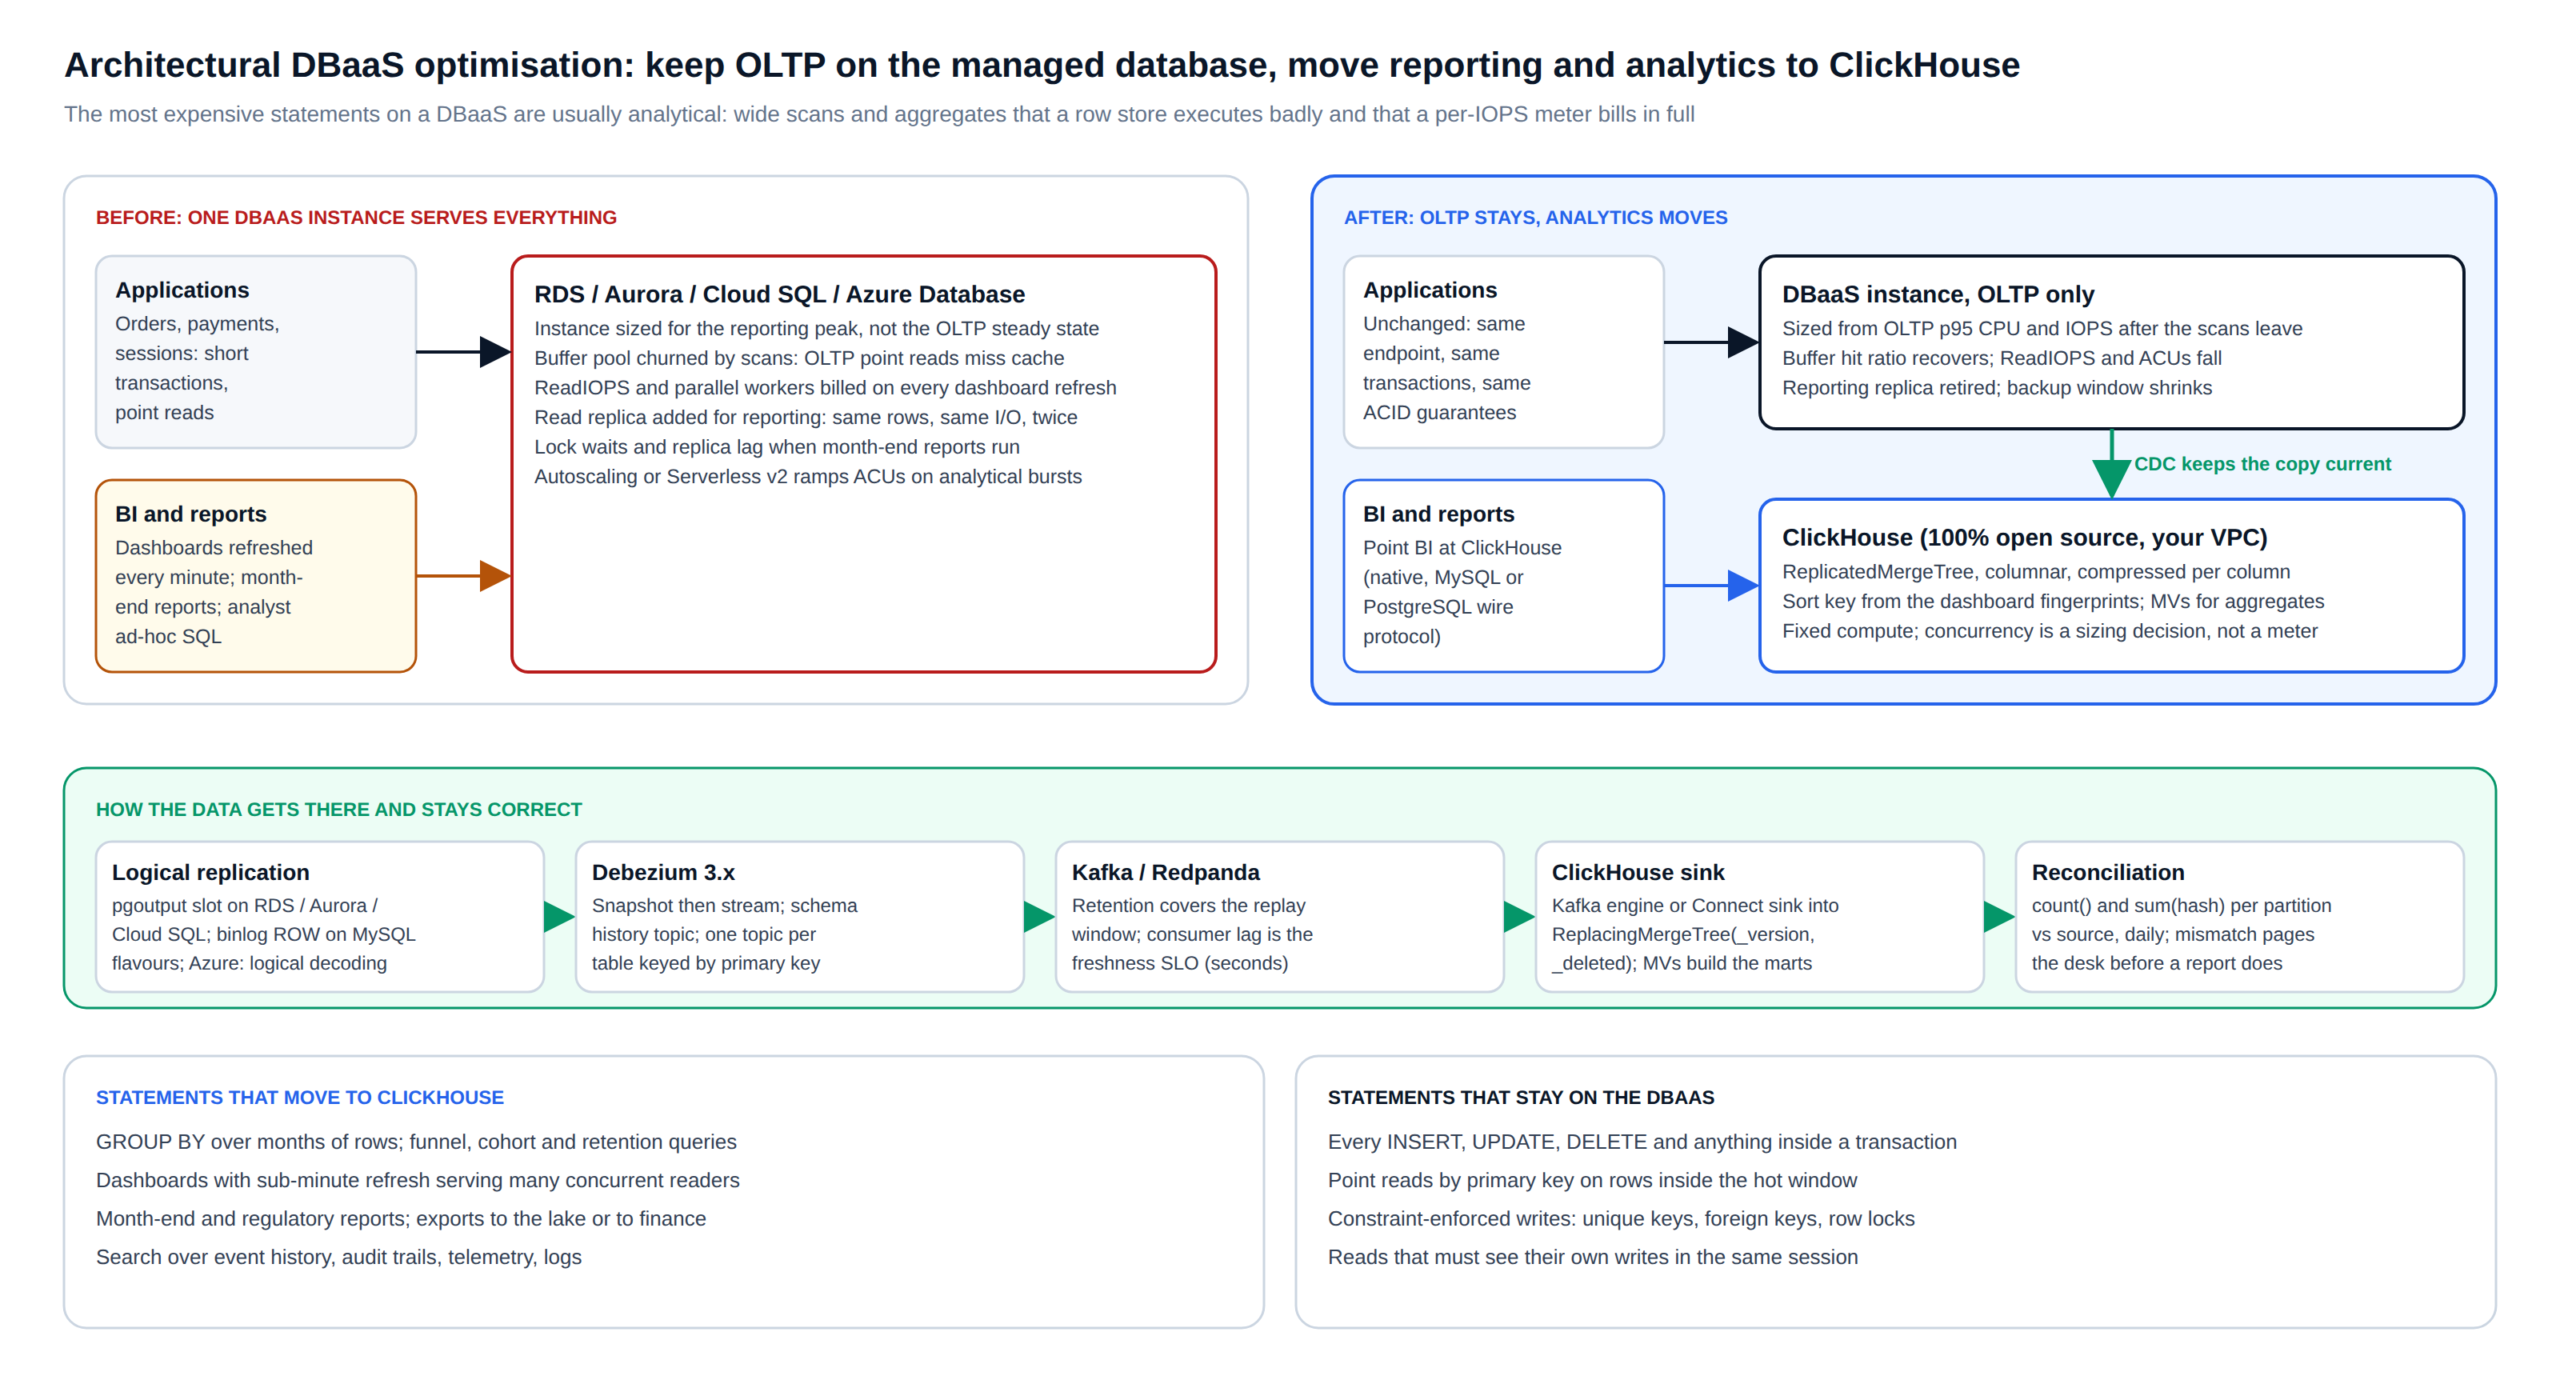
ChistaDATA’s architectural option is to keep OLTP where it is and move the analytical statements to 100% open-source ClickHouse in your own VPC, fed by logical replication through Debezium and Kafka into ReplacingMergeTree tables with materialized views for the aggregates. The application does not change; BI tools are pointed at ClickHouse over the native, MySQL or PostgreSQL wire protocol.
The DBaaS instance is then right-sized from its OLTP steady state, the reporting replica is retired, and the analytical workload runs on fixed compute where concurrency is a sizing decision rather than a meter. The full engineering of that path, including reconciliation and the gated purge of history from the row store, is described on the RDBMS archival and archiving data to ClickHouse pages.
-- ClickHouse 25.x / 26.x LTS target for the offloaded orders facts (explicit engine and parameters)
CREATE TABLE analytics.orders ON CLUSTER '{cluster}'
(
    order_id     UInt64,
    customer_id  UInt64,
    created_at   DateTime64(3, 'UTC') CODEC(DoubleDelta, ZSTD(3)),
    region       LowCardinality(String),
    segment      LowCardinality(String),
    total        Decimal(18, 2)       CODEC(ZSTD(3)),
    _version     UInt64,
    _deleted     UInt8
)
ENGINE = ReplicatedReplacingMergeTree('/clickhouse/tables/{shard}/analytics/orders', '{replica}', _version, _deleted)
PARTITION BY toYYYYMM(created_at)
ORDER BY (region, created_at, order_id)
SETTINGS index_granularity = 8192;

-- The Fig. 1 dashboard statement, now a sort-key-aligned range read on compressed columns
SELECT segment, count(), sum(total)
FROM analytics.orders FINAL
WHERE region = 'EMEA' AND created_at >= now() - INTERVAL 90 DAY
GROUP BY segment;
Inside the DBaaS, two more architectural levers apply before any offload. Partitioning by time on churned tables keeps autovacuum, index sizes and backups bounded and makes retention a DROP PARTITION rather than a metered DELETE. A cache (ElastiCache, Memorystore, Azure Cache) in front of read-heavy point lookups removes repeated reads from the I/O meter entirely; it is justified by the hit ratio the evidence pack predicts, not by habit.
Lever 5
Autoscaling and serverless governance: DBaaS optimisation for Aurora Serverless v2, read-replica autoscaling and storage autoscaling
Autoscaling converts inefficiency into spend without an alert. Aurora Serverless v2 scales ACUs on CPU and memory pressure, so an unindexed report ramps the instance and the bill together; read-replica autoscaling adds readers that execute the same scans; storage autoscaling grows volumes that bloat filled. Governance means bounding each of these from measured need: a minimum ACU that covers the OLTP steady state so cold starts do not hurt p95, a maximum ACU set from the highest legitimate peak in the evidence pack rather than the default, replica scaling policies keyed to DatabaseConnections and CPU on the readers, and storage autoscaling paired with bloat monitoring so growth is a signal, not a silent line.
| Service | What scales | What DBaaS optimisation bounds it with |
|---|---|---|
| Aurora Serverless v2 | ACUs per instance (0.5 to 256 in 0.5 steps) | Min ACU from OLTP steady-state memory; max ACU from measured peak; ServerlessDatabaseCapacity reviewed weekly against fingerprints |
| Aurora and RDS read replicas | Reader count via Application Auto Scaling | Scale on reader CPU p95, not on connections; alert when a scale-out coincides with a new fingerprint |
| RDS and Cloud SQL storage autoscaling | Volume size, upward only | Bloat and dead-tuple alerts before the threshold; retention by partition so growth is explained |
| Azure Database flexible server | Storage auto-grow; compute tier is manual | Tier changes from Query Store evidence in the maintenance window; auto-grow paired with growth alerts |
| Cloud SQL and AlloyDB | Read pool node count (AlloyDB), storage | Read pool sized from Query Insights per-node load; storage growth reconciled with table bytes monthly |
Every scaling event in the evidence window is matched to the fingerprints active at the time. A scale-out that coincides with a release is a regression to send back to the app team with the plan attached; one that coincides with a genuine traffic peak is a sizing input. This distinction is what keeps DBaaS optimisation from becoming a monthly argument about the bill.
Operating model
The DBaaS optimisation cadence: daily, weekly, monthly and quarterly, with guardrails inside the engine
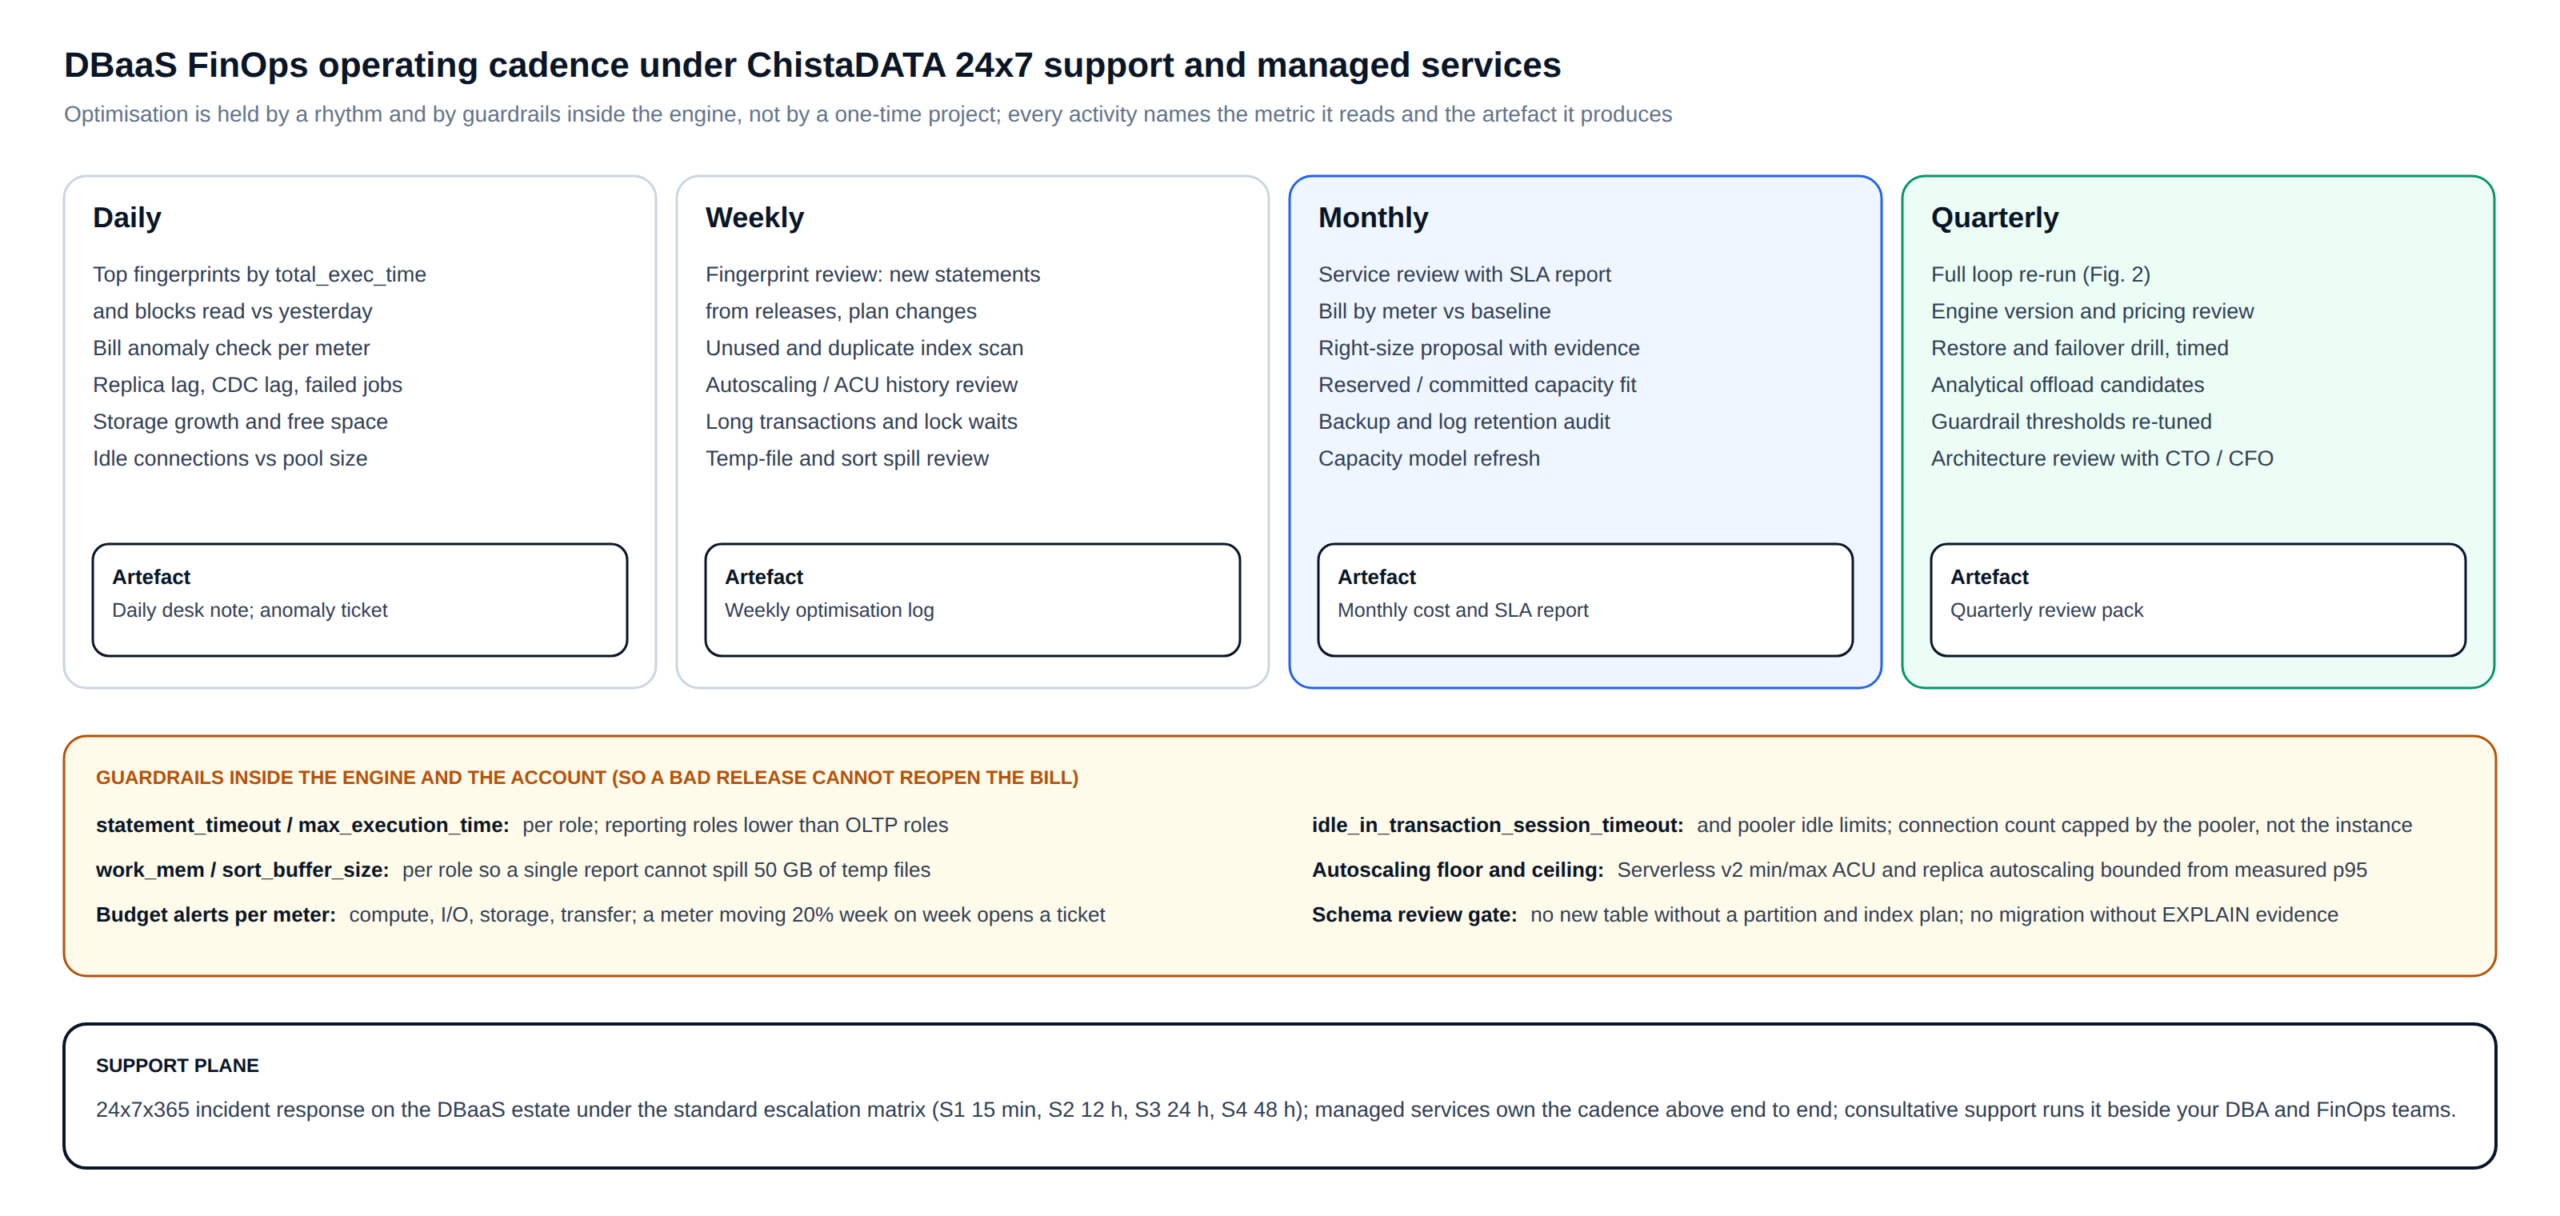
A one-time optimisation project decays: releases add statements, data grows, provider pricing changes, and within two quarters the bill is back. ChistaDATA holds the result with a cadence under 24×7 support or managed services and with guardrails that live inside the engine and the cloud account rather than in a document.
-- DBaaS optimisation guardrails applied per role (PostgreSQL 15+; reload, no restart)
ALTER ROLE app_oltp      SET statement_timeout = '5s';
ALTER ROLE app_oltp      SET idle_in_transaction_session_timeout = '60s';
ALTER ROLE app_reporting SET statement_timeout = '5min';
ALTER ROLE app_reporting SET work_mem = '256MB';          -- few sessions, large sorts
ALTER ROLE app_oltp      SET work_mem = '8MB';            -- many sessions, small sorts
-- Verification: SELECT rolname, rolconfig FROM pg_roles WHERE rolname LIKE 'app_%';

-- MySQL 8.0 / 8.4 equivalents
SET PERSIST max_execution_time = 5000;                    -- ms, SELECT only; per-session override for reporting users
CREATE USER 'app_reporting'@'%' WITH MAX_USER_CONNECTIONS 20 MAX_QUERIES_PER_HOUR 20000;
Budget alerts are set per meter, not per account, so that an I/O line moving 20% week on week opens a ticket while the total is still inside budget. The weekly fingerprint review compares the current top 20 with last week’s and attributes every newcomer to a release or a data change; the monthly service review presents the bill by meter against the baseline with the change log that explains each delta; the quarterly review re-runs the full loop, times a restore and failover drill, and re-examines which statements are now candidates for the ClickHouse offload.
Engagement
How ChistaDATA delivers DBaaS optimisation: assessment, engineering, and 24×7 support or managed services
DBaaS optimisation assessment
Read-only access to catalog views and provider telemetry, seven days of evidence next to the bill, the ranked fingerprint list with meter attribution, and a change set with plan evidence, staging plan and rollback for each item. Delivered as a versioned, branded document.
Engineering
The change set applied with your DBA and application teams: indexes and rewrites, pooling, parameter groups, partitioning, storage and instance changes, autoscaling bounds, and, where the evidence supports it, the ClickHouse offload built and reconciled.
24×7 support and managed services
The cadence above under the standard escalation matrix (S1 15 min, S2 12 h, S3 24 h, S4 48 h): consultative support beside your team, or managed services that own the estate, the cadence, the guardrails and the monthly cost and SLA report end to end.
Engagements cover Amazon RDS and Aurora (PostgreSQL and MySQL), Google Cloud SQL and AlloyDB, and Azure Database for PostgreSQL and MySQL; MariaDB-family services follow the MySQL method. Every engagement starts with the pre-engagement questionnaire so the first conversation is about your fingerprints and your meters rather than about generic best practice. Where the assessment finds that the workload is correctly sized and the bill is what the business genuinely needs, the report says so.
FAQ
DBaaS optimisation questions ChistaDATA is asked most often
How much can DBaaS optimisation save?
It depends entirely on how much of the bill the top fingerprints explain, which the evidence pack measures in the first week. ChistaDATA does not quote a percentage before seeing pg_stat_statements or the digest summary next to the bill; the assessment report states the expected delta per meter, per change, and the verification phase records what was actually achieved.
Why not just downsize the instance and see what happens?
Because the work does not go away. The same scans run on fewer cores and a smaller buffer cache, p95 rises, I/O increases as the cache hit ratio falls, and autoscaling or an incident restores the previous class. The DBaaS optimisation loop fixes statements first so that a downsize holds.
Does this require moving off the managed database?
No. Four of the five levers are applied inside the DBaaS. The ClickHouse offload is an architectural option for analytical statements that a row store cannot serve cheaply; it is recommended only when the evidence pack shows those statements dominate the I/O or compute meter, and the OLTP database stays exactly where it is.
Which services are covered?
Amazon RDS and Aurora for PostgreSQL and MySQL including Serverless v2, Google Cloud SQL and AlloyDB, and Azure Database for PostgreSQL and MySQL flexible servers. The method is the same for self-managed PostgreSQL and MySQL; only the provider telemetry and the metering differ.
How are production changes kept safe?
Every change is staged on a replica or a restored snapshot with production statistics, applied in a window with the previous value and the rollback path recorded, and verified against the meter for seven days. Index builds use CONCURRENTLY or online DDL, parameter changes are grouped by reload versus restart, and nothing that drops or truncates is executed without an explicit confirmation gate in the runbook.
Next step
Bring the bill and the query statistics; ChistaDATA brings the join between them
A DBaaS optimisation assessment from ChistaDATA takes seven days of catalog and provider telemetry next to seven days of bill lines and returns a ranked fingerprint list, a change set with plan evidence and rollback for each item, and a right-size decision that holds. The same engineers apply it with your team and keep it in place under 24×7 support or as the managed team.
Further reading: RDBMS archival with ChistaDATA Fabric · Archiving data to ClickHouse · Data infrastructure for CTOs · pg_stat_statements · MySQL statement digests · Aurora Serverless v2