Effortlessly Profile Events and Query Traces in a Single ClickHouse Query
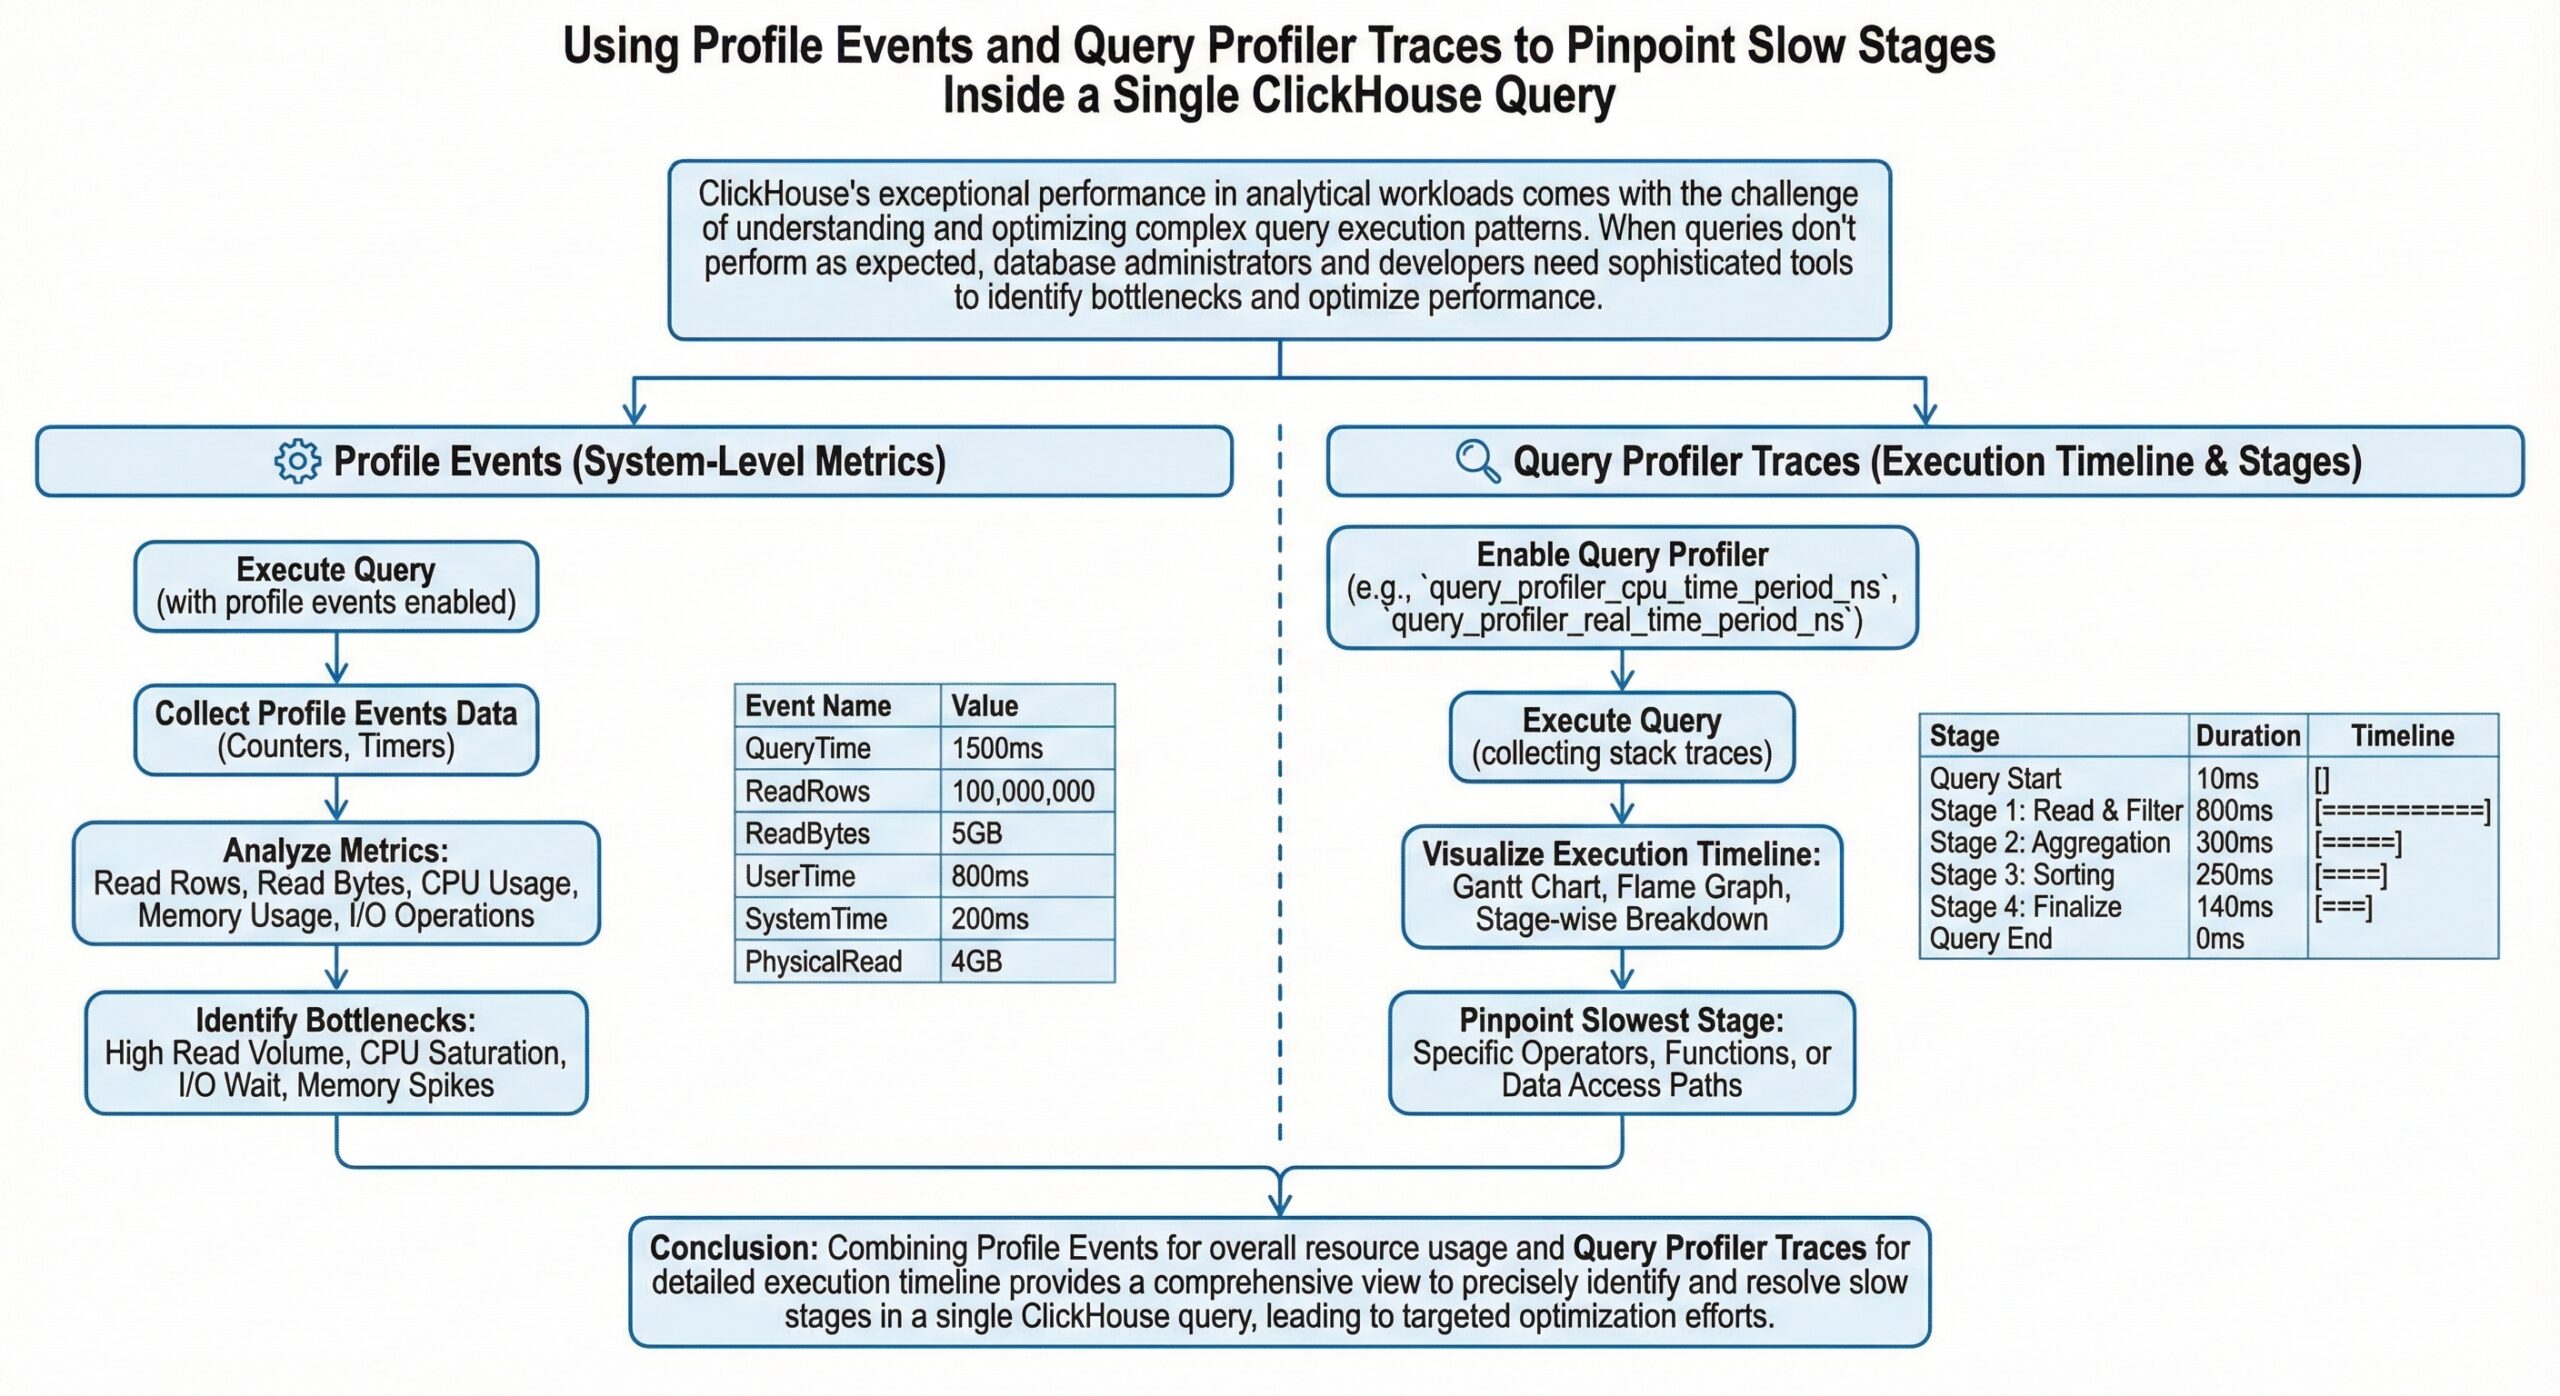
ClickHouse’s exceptional performance in analytical workloads comes with the challenge of understanding and optimizing complex query execution patterns. When queries don’t perform as expected, database administrators and developers need sophisticated tools to identify bottlenecks and optimize performance. ClickHouse provides powerful built-in profiling capabilities that allow you to dive deep into query execution, pinpointing exactly where time is being spent and resources are being consumed.
This comprehensive guide explores how to leverage ClickHouse’s profile events and query profiler traces to identify and resolve performance issues within individual queries. We’ll cover the essential tools, techniques, and best practices for query performance analysis using ClickHouse’s native profiling infrastructure to help you optimize ClickHouse Queries.
Understanding ClickHouse’s Profiling Architecture
ClickHouse offers multiple layers of profiling capabilities, each designed to provide different levels of insight into query execution:
Profile Events System
Profile events track all internal operations within ClickHouse, from detailed query execution metrics to system-level resource utilization. These events provide a comprehensive view of what’s happening inside the database engine during query execution.
Query Profiler Traces
The sampling query profiler analyzes query execution by collecting stack traces at regular intervals. This allows you to identify source code routines that consume the most CPU and wall-clock time, including idle time during query execution.
Processor-Level Profiling
ClickHouse’s processor-level profiling provides granular insights into individual processing stages within the query execution pipeline. This is particularly useful for understanding data flow and identifying bottlenecks between different query processing stages.
Deep Dive into system.trace_log and Sampling Query Profiler
Enabling and Configuring the Query Profiler
The query profiler is automatically enabled in ClickHouse Cloud, making it immediately available for performance analysis. For self-managed deployments, you need to configure the trace_log section in your server configuration.
The profiler operates using two key settings:
- query_profiler_cpu_time_period_ns: Controls CPU time sampling frequency
- query_profiler_real_time_period_ns: Controls wall-clock time sampling frequency
The default sampling frequency is one sample per second, which provides sufficient information for most analysis scenarios without impacting server performance1. For detailed analysis of individual queries, you can increase the sampling frequency.
Understanding system.trace_log Structure
The system.trace_log table contains comprehensive profiling data with the following key columns:
| Column | Type | Description |
|---|---|---|
| event_date | Date | Date of sampling moment |
| event_time | DateTime | Timestamp of sampling moment |
| trace_type | Enum8 | Type of trace (Real, CPU, Memory, ProfileEvent) |
| query_id | String | Query identifier for correlation |
| trace | Array(UInt64) | Stack trace at sampling moment |
| thread_id | UInt64 | Thread identifier |
| event | String | Profile event name (for ProfileEvent traces) |
| increment | UInt64 | Profile event increment amount |
Analyzing Query Performance with Trace Logs
To analyze a specific query’s performance, you can use the following approach
SELECT
    count(),
    arrayStringConcat(arrayMap(x -> concat(demangle(addressToSymbol(x)), '\n ', addressToLine(x)), trace), '\n') AS sym
FROM system.trace_log
WHERE query_id = 'your-query-id-here'
  AND trace_type = 'CPU'
  AND event_date = today()
GROUP BY trace
ORDER BY count() DESC
LIMIT 10
SETTINGS allow_introspection_functions = 1
This query provides:
- Function names and their corresponding source code locations
- Frequency of execution for each code path
- Identification of performance hotspots
For ClickHouse Cloud deployments, modify the query to use clusterAllReplicas(default, system.trace_log) to collect data from all cluster nodes.
Advanced Trace Analysis Techniques
Converting to Chrome Event Trace Format
For visual analysis, you can convert profiling data to Chrome’s Event Trace Format:
WITH traces AS (
    SELECT * FROM system.trace_log
    WHERE event_date >= today()
      AND trace_type = 'Instrumentation'
      AND handler = 'profile'
    ORDER BY event_time, entry_type
)
SELECT
    format(
        '{"traceEvents": [{}]}',
        arrayStringConcat(
            groupArray(
                format(
                    '{"name": "{}", "cat": "clickhouse", "ph": "{}", "ts": {}, "pid": 1, "tid": {}, "args": {"query_id": "{}", "cpu_id": {}, "stack": [{}]}}',
                    function_name,
                    if(entry_type = 0, 'B', 'E'),
                    timestamp_ns/1000,
                    toString(thread_id),
                    query_id,
                    cpu_id,
                    arrayStringConcat(arrayMap((x, y) -> concat('"', x, ': ', y, '"'), lines, symbols))
                )
            )
        )
    )
FROM traces;
Export this data to a JSON file for analysis with tools like Perfetto or speedscope.
Processor-Level Analysis with system.processors_profile_log
Understanding Processor Profiling
The system.processors_profile_log table provides detailed insights into individual processors within the query execution pipeline. This granular view helps identify bottlenecks at specific processing stages.
Key metrics include:
| Metric | Description |
|---|---|
| elapsed_us | Microseconds the processor was executing |
| input_wait_elapsed_us | Microseconds waiting for input data |
| output_wait_elapsed_us | Microseconds waiting due to full output port |
| input_rows/bytes | Data consumed by the processor |
| output_rows/bytes | Data generated by the processor |
Enabling Processor Profiling
Enable processor profiling for your query using:
SELECT your_query_here
SETTINGS log_processors_profiles = 1
Analyzing Processor Performance
After executing your query, analyze the processor performance:
SELECT
    name,
    elapsed_us,
    input_wait_elapsed_us,
    output_wait_elapsed_us,
    input_rows,
    output_rows
FROM system.processors_profile_log
WHERE query_id = 'your-query-id'
ORDER BY elapsed_us DESC
This analysis reveals:
- Which processors consume the most execution time
- Where data flow bottlenecks occur
- Processors waiting for input or output operations
Interpreting Processor Metrics
Consider this example analysis:
- High elapsed_us: Indicates processors doing significant work
- High input_wait_elapsed_us: Suggests upstream bottlenecks
- High output_wait_elapsed_us: Indicates downstream processing delays
Profile Events and Internal Metrics
Understanding Profile Events
Profile events provide detailed metrics about internal ClickHouse operations. These events track everything from disk I/O operations to memory allocations, providing comprehensive insight into resource utilization during query execution.
Key Profile Event Categories
| Category | Examples | Use Case |
|---|---|---|
| Disk Operations | DiskReadElapsedMicroseconds | I/O performance analysis |
| Memory Operations | MemoryAllocatorPurge | Memory usage optimization |
| Network Operations | NetworkReceiveElapsedMicroseconds | Distributed query analysis |
| Query Processing | SelectedRows, SelectedBytes | Data processing efficiency |
Monitoring Profile Events
Query the system.events table to access current profile event counters:
SELECT event, value, description
FROM system.events
WHERE event LIKE '%Read%' OR event LIKE '%Write%'
ORDER BY value DESC
For query-specific analysis, profile events are also captured in trace logs with trace_type = ‘ProfileEvent’.
Practical Performance Analysis Workflow
Step 1: Initial Query Analysis
Begin with basic query performance metrics:
SELECT
    query_id,
    query_duration_ms,
    read_rows,
    read_bytes,
    memory_usage
FROM system.query_log
WHERE query LIKE '%your_query_pattern%'
  AND event_date = today()
ORDER BY query_duration_ms DESC
Step 2: Enable Comprehensive Profiling
Execute your query with full profiling enabled:
SET query_profiler_cpu_time_period_ns = 10000000;  -- 100 samples per second
SET query_profiler_real_time_period_ns = 10000000;
SET log_processors_profiles = 1;

-- Your query here
SELECT ...
SETTINGS allow_introspection_functions = 1
Step 3: Analyze Execution Patterns
Examine CPU usage patterns:
SELECT
    trace_type,
    count() as samples,
    count() * 100.0 / (SELECT count() FROM system.trace_log WHERE query_id = 'your-query-id') as percentage
FROM system.trace_log
WHERE query_id = 'your-query-id'
GROUP BY trace_type
ORDER BY samples DESC
Step 4: Identify Bottleneck Functions
Find the most time-consuming functions:
SELECT
    arrayStringConcat(arrayMap(x -> demangle(addressToSymbol(x)), trace), ' -> ') as call_stack,
    count() as samples
FROM system.trace_log
WHERE query_id = 'your-query-id'
  AND trace_type = 'CPU'
GROUP BY trace
ORDER BY samples DESC
LIMIT 20
SETTINGS allow_introspection_functions = 1
Step 5: Processor Pipeline Analysis
Examine the processing pipeline:
SELECT
    name,
    elapsed_us,
    input_wait_elapsed_us / elapsed_us as input_wait_ratio,
    output_wait_elapsed_us / elapsed_us as output_wait_ratio,
    input_rows,
    output_rows
FROM system.processors_profile_log
WHERE query_id = 'your-query-id'
ORDER BY elapsed_us DESC
Advanced Optimization Techniques
Memory Profiling
For memory-intensive queries, enable memory profiling:
SET memory_profiler_step = 1048576;  -- 1MB steps
SET memory_profiler_sample_probability = 0.1;

-- Analyze memory allocation patterns
SELECT
    trace_type,
    sum(size) as total_allocated
FROM system.trace_log
WHERE query_id = 'your-query-id'
  AND trace_type IN ('Memory', 'MemorySample')
GROUP BY trace_type
I/O Performance Analysis
Monitor disk I/O patterns using profile events:
SELECT
    event,
    increment
FROM system.trace_log
WHERE query_id = 'your-query-id'
  AND trace_type = 'ProfileEvent'
  AND event LIKE '%Disk%'
ORDER BY increment DESC
Network Performance in Distributed Queries
For distributed queries, analyze network overhead:
SELECT
    event,
    sum(increment) as total_value
FROM system.trace_log
WHERE query_id = 'your-query-id'
  AND trace_type = 'ProfileEvent'
  AND event LIKE '%Network%'
GROUP BY event
ORDER BY total_value DESC
Common Performance Bottlenecks and Solutions
High CPU Usage in Specific Functions
Symptoms: Concentrated CPU samples in particular functions
Analysis: Use stack trace analysis to identify hot code paths
Solutions:
- Optimize query structure
- Consider different algorithms or data types
- Evaluate index usage
Memory Allocation Bottlenecks
Symptoms: High memory allocation events, frequent garbage collection
Analysis: Monitor memory profiling traces
Solutions:
- Reduce memory usage through query optimization
- Adjust memory limits and settings
- Consider data compression options
I/O Wait Times
Symptoms: High input_wait_elapsed_us in processor profiling
Analysis: Examine disk I/O profile events
Solutions:
- Optimize storage configuration
- Consider data partitioning strategies
- Evaluate compression settings
Pipeline Stalls
Symptoms: High output_wait_elapsed_us values
Analysis: Identify processors causing downstream delays
Solutions:
- Reorder query operations
- Adjust parallelism settings
- Optimize data flow patterns
Best Practices for Query Profiling
1. Systematic Approach
Always follow a structured profiling workflow:
- Establish baseline performance metrics
- Enable appropriate profiling levels
- Analyze results systematically
- Implement and validate optimizations
2. Profiling Overhead Management
Balance profiling detail with performance impact:
- Use default sampling rates for production analysis
- Increase sampling frequency only for detailed investigation
- Disable profiling after analysis completion
3. Correlation Analysis
Combine multiple profiling sources:
- Cross-reference trace logs with processor profiling
- Correlate profile events with execution patterns
- Use query logs for context and comparison
4. Documentation and Monitoring
Maintain profiling practices:
- Document optimization decisions and results
- Establish monitoring for key performance metrics
- Create alerts for performance regressions
Conclusion
ClickHouse’s comprehensive profiling capabilities provide powerful tools for understanding and optimizing query performance. By leveraging profile events, query profiler traces, and processor-level analysis, you can identify performance bottlenecks with precision and implement targeted optimizations.
The key to successful query optimization lies in systematic analysis using these tools. Start with broad performance metrics, drill down into specific bottlenecks using trace analysis, and validate improvements through continued monitoring. With these techniques, you can ensure your ClickHouse queries perform optimally, even as data volumes and complexity grow.
Remember that query optimization is an iterative process. Regular profiling and analysis help maintain optimal performance as your data and query patterns evolve. By mastering these profiling tools, you’ll be equipped to handle even the most challenging ClickHouse performance scenarios.