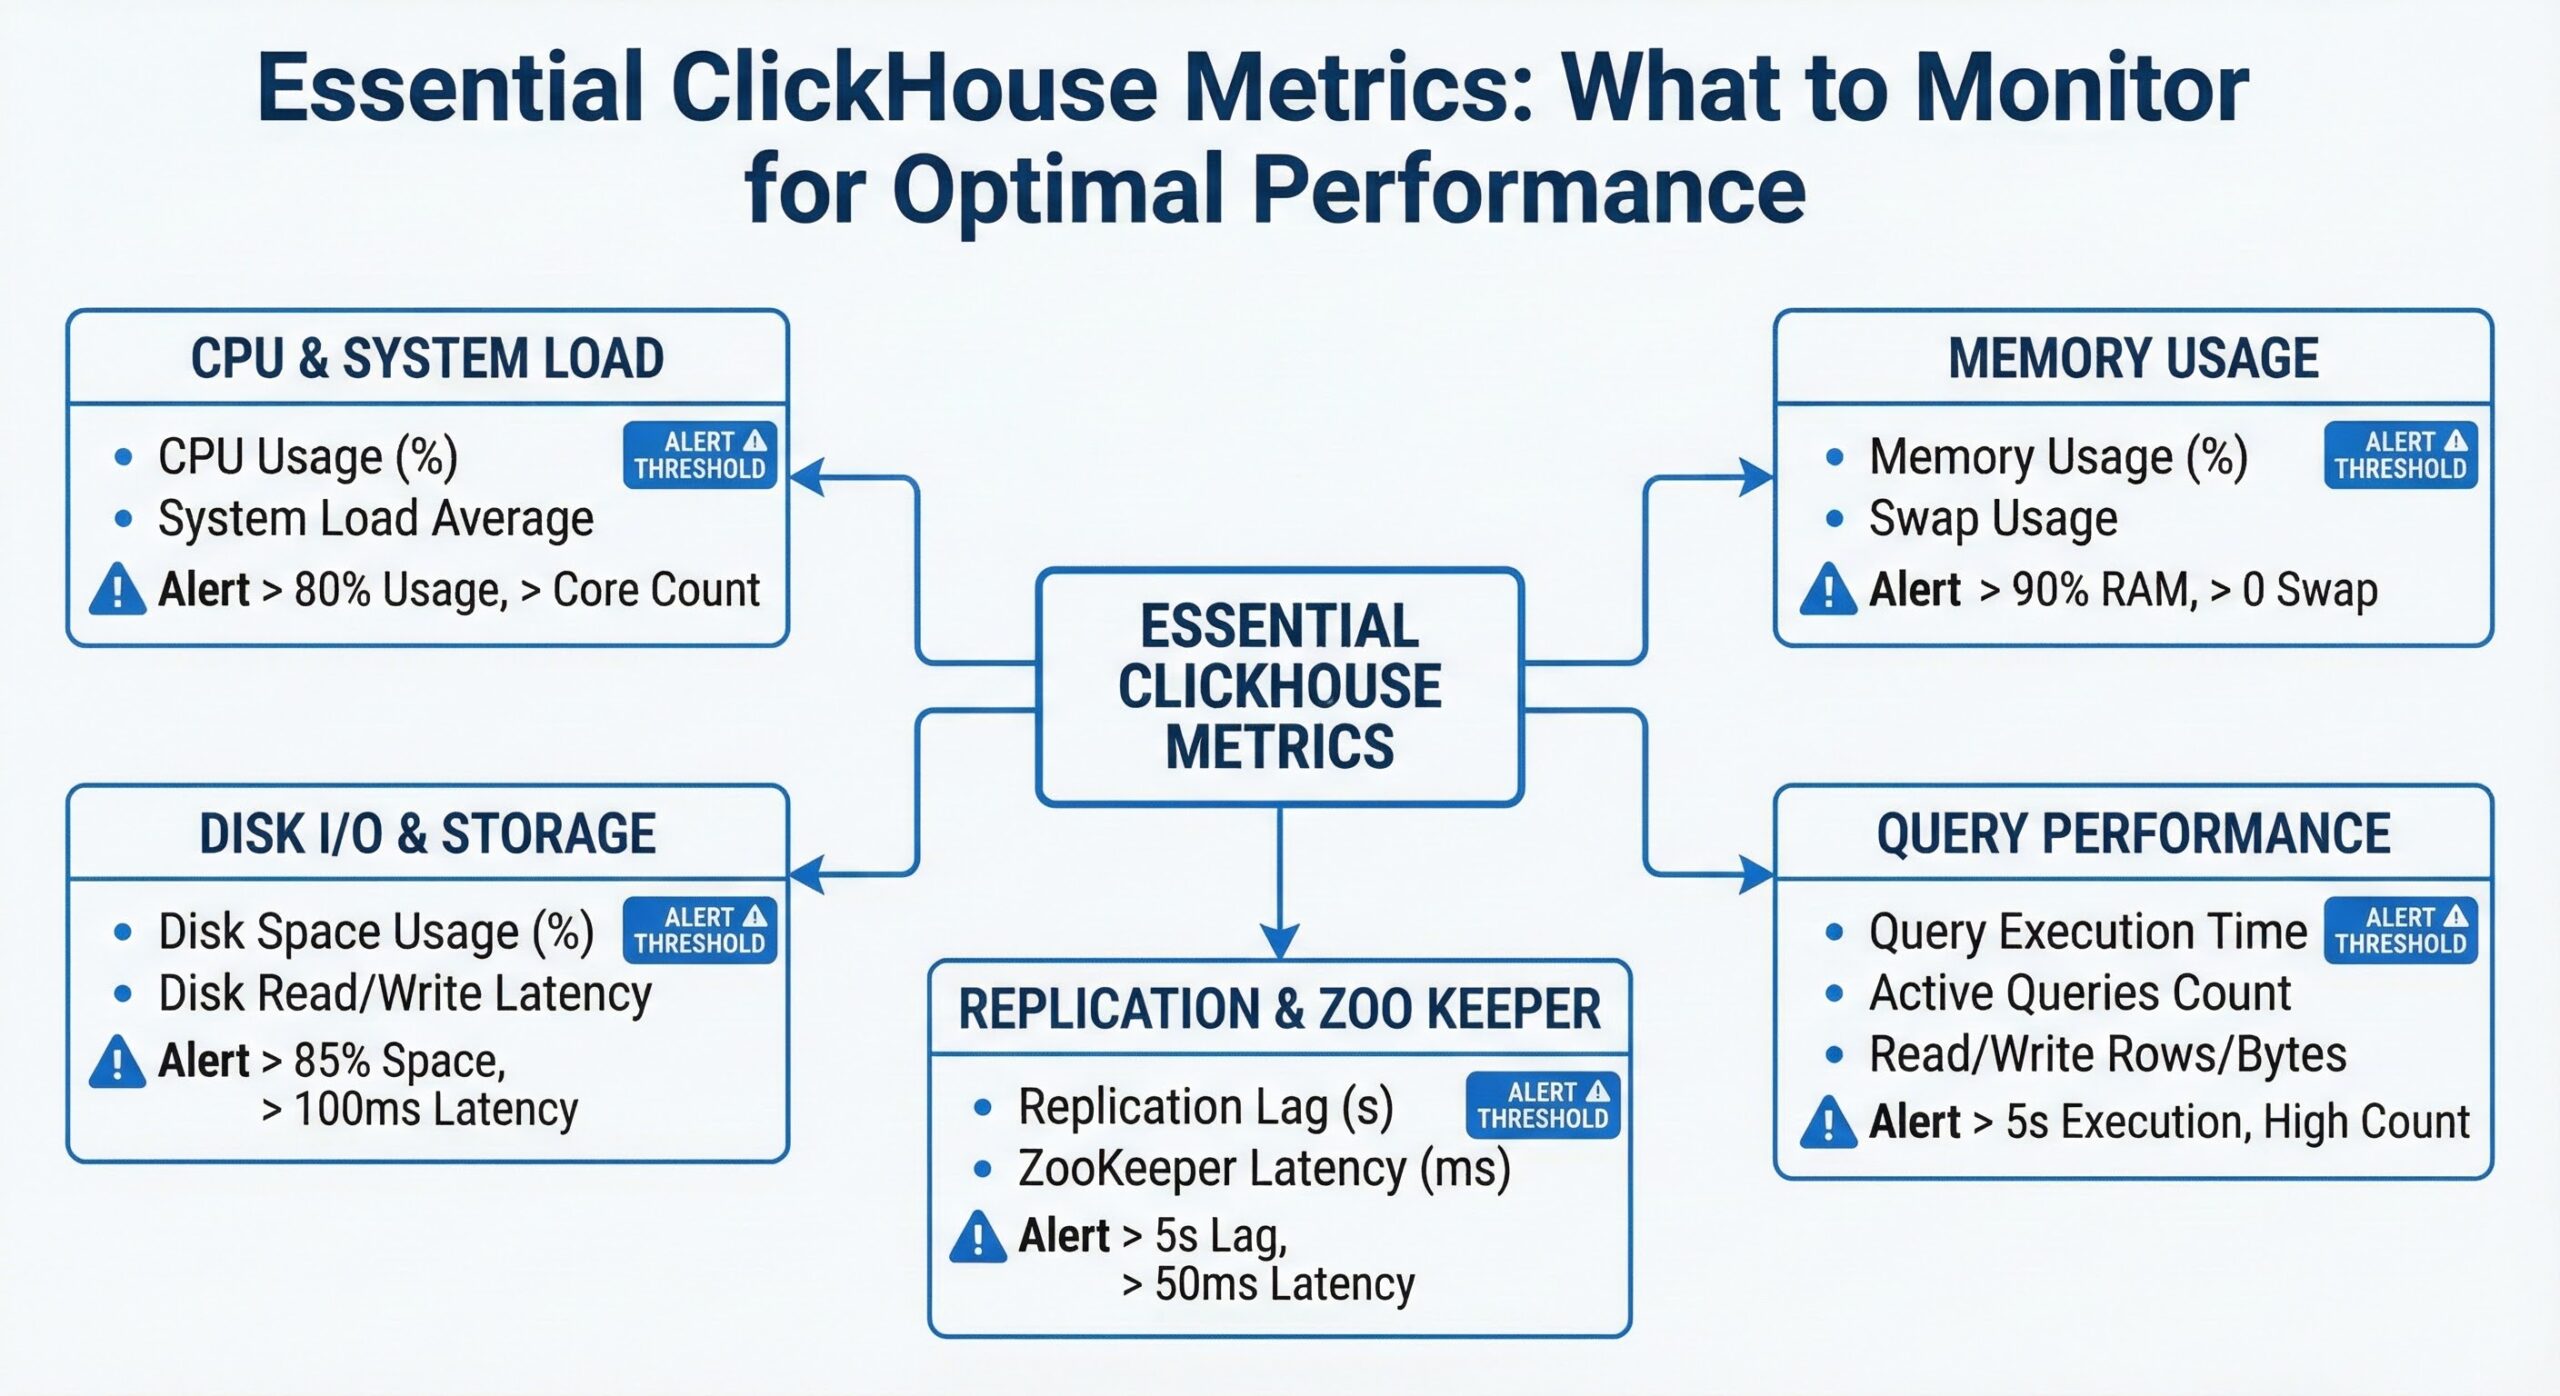
Essential ClickHouse Metrics: What to Monitor for Optimal Performance
ClickHouse, the high-performance columnar database management system, exposes over 1,000 metrics for monitoring and observability 5. With such an extensive array of available metrics, selecting the most critical ones becomes essential for maintaining optimal performance and system reliability. This guide identifies the key ClickHouse metrics you should monitor, along with recommended alert thresholds to help you maintain a healthy, responsive database environment.
Why Monitoring Matters in ClickHouse
ClickHouse is designed for lightning-fast analytical queries on massive datasets, making it a popular choice for real-time analytics, monitoring systems, and data warehousing. However, its high-performance nature means that issues can escalate quickly if not caught early. As noted in ClickHouse documentation, the server has embedded instruments for self-state monitoring, and tracking server events through logs is crucial for maintaining system health 1.
Given that ClickHouse offers more than 1,000 metrics, choosing the right ones for effective monitoring can be challenging 5. Effective monitoring not only helps detect anomalies and recognize performance patterns but also enables teams to evaluate appropriate alert thresholds 7.
The Essential ClickHouse Metrics to Monitor
1. Query Performance Metrics
Query Count and Throughput
Monitoring the number of queries processed per second helps you understand your workload patterns and identify unusual spikes or drops in activity. Sudden increases could indicate inefficient queries or potential abuse, while sustained high query rates may necessitate scaling.
Query Processing Threads
Keep an eye on the number of active query processing threads. If this number consistently approaches the maximum configured threads, it could indicate that queries are queuing up, leading to increased latency.
Query Duration
Track both average and percentile-based query durations (P95, P99). As mentioned in ClickHouse’s monitoring guide for INSERT queries, defining a service level agreement (SLA) for query duration and setting alerts when it’s breached is crucial for maintaining performance standards 3.
Recommended Alert Thresholds:
- Alert when average query duration exceeds 5 seconds
- Alert when P95 query duration exceeds 10 seconds
- Alert when query throughput drops by more than 50% from baseline
2. Memory Usage
Memory consumption is a critical metric for ClickHouse performance. Monitor both server-wide memory usage and per-query memory allocation.
Recommended Alert Thresholds:
- Warning at 70% memory usage
- Critical alert at 85% memory usage 2
Sustained high memory usage can lead to swapping, which dramatically impacts performance. As one case study demonstrated, systems can appear healthy with 65% memory usage while hiding critical issues like queued mutations 2.
3. Storage and Part Management
Part Counts
ClickHouse stores data in immutable parts, and excessive part counts can degrade query performance. Monitor the number of parts per table and per partition.
Merge Queue Size
The merge process combines smaller parts into larger ones. A consistently growing merge queue indicates that merges aren’t keeping up with data ingestion.
Recommended Alert Thresholds:
- Alert when merge queue size exceeds 100 entries
- Alert when a single table has more than 1,000 parts
4. Replication Metrics
For replicated setups, monitoring replication lag is essential to ensure data consistency across replicas.
Recommended Alert Thresholds:
- Warning when replication lag exceeds 30 seconds
- Critical alert when lag exceeds 5 minutes
5. System Resources
CPU Usage
While ClickHouse is designed to utilize CPU efficiently, sustained high CPU usage can indicate query optimization opportunities or the need for scaling.
Network Connections
Monitor the number of active connections to identify potential connection leaks or unexpected client behavior.
6. Specialized Metrics
Mutation Queue
As highlighted in a case study, mutations (background data modifications) can queue up and cause issues even when other metrics appear healthy 2. Monitor the number of queued mutations and their age.
INSERT Performance
For workloads with significant data ingestion, monitor INSERT query duration, batch sizes, and failure rates 3.
Setting Effective Alerts
When configuring alerts, base your rules on trends rather than isolated spikes to avoid alert noise and improve the signal-to-noise ratio 4. ClickHouse supports user-defined metrics and alert thresholds, which can be integrated with visualization and alerting tools like Grafana 4.
Grafana’s alerting system can be configured to monitor these metrics and trigger alerts based on predefined thresholds, ensuring timely responses to critical issues 8. ClickHouse comes with predefined monitoring dashboards that provide deep insights into system performance and help identify bottlenecks before they impact operations 6.
Implementation Best Practices
- Start with the basics: Focus on query performance, memory usage, and storage metrics before expanding to more specialized indicators.
- Establish baselines: Understand your normal workload patterns before setting alert thresholds.
- Use visualization tools: Implement dashboards that correlate multiple metrics to provide context for performance issues.
- Monitor trends, not just values: Look for sustained deviations from normal patterns rather than transient spikes.
- Regularly review and adjust: As your workload evolves, revisit your monitoring strategy and alert thresholds.
Conclusion
With over 1,000 metrics available, effective ClickHouse monitoring requires careful selection of the most impactful indicators. By focusing on query performance, memory usage, storage management, replication status, and system resources, you can maintain optimal performance and quickly identify potential issues. Remember to set meaningful alert thresholds based on your specific workload patterns, and leverage ClickHouse’s built-in monitoring capabilities and integration options to create a comprehensive observability strategy.
The key is not to monitor everything, but to monitor the right things that directly impact your application’s performance and reliability.