Understanding ClickHouse Wait Events: A Comprehensive Troubleshooting Guide
Introduction
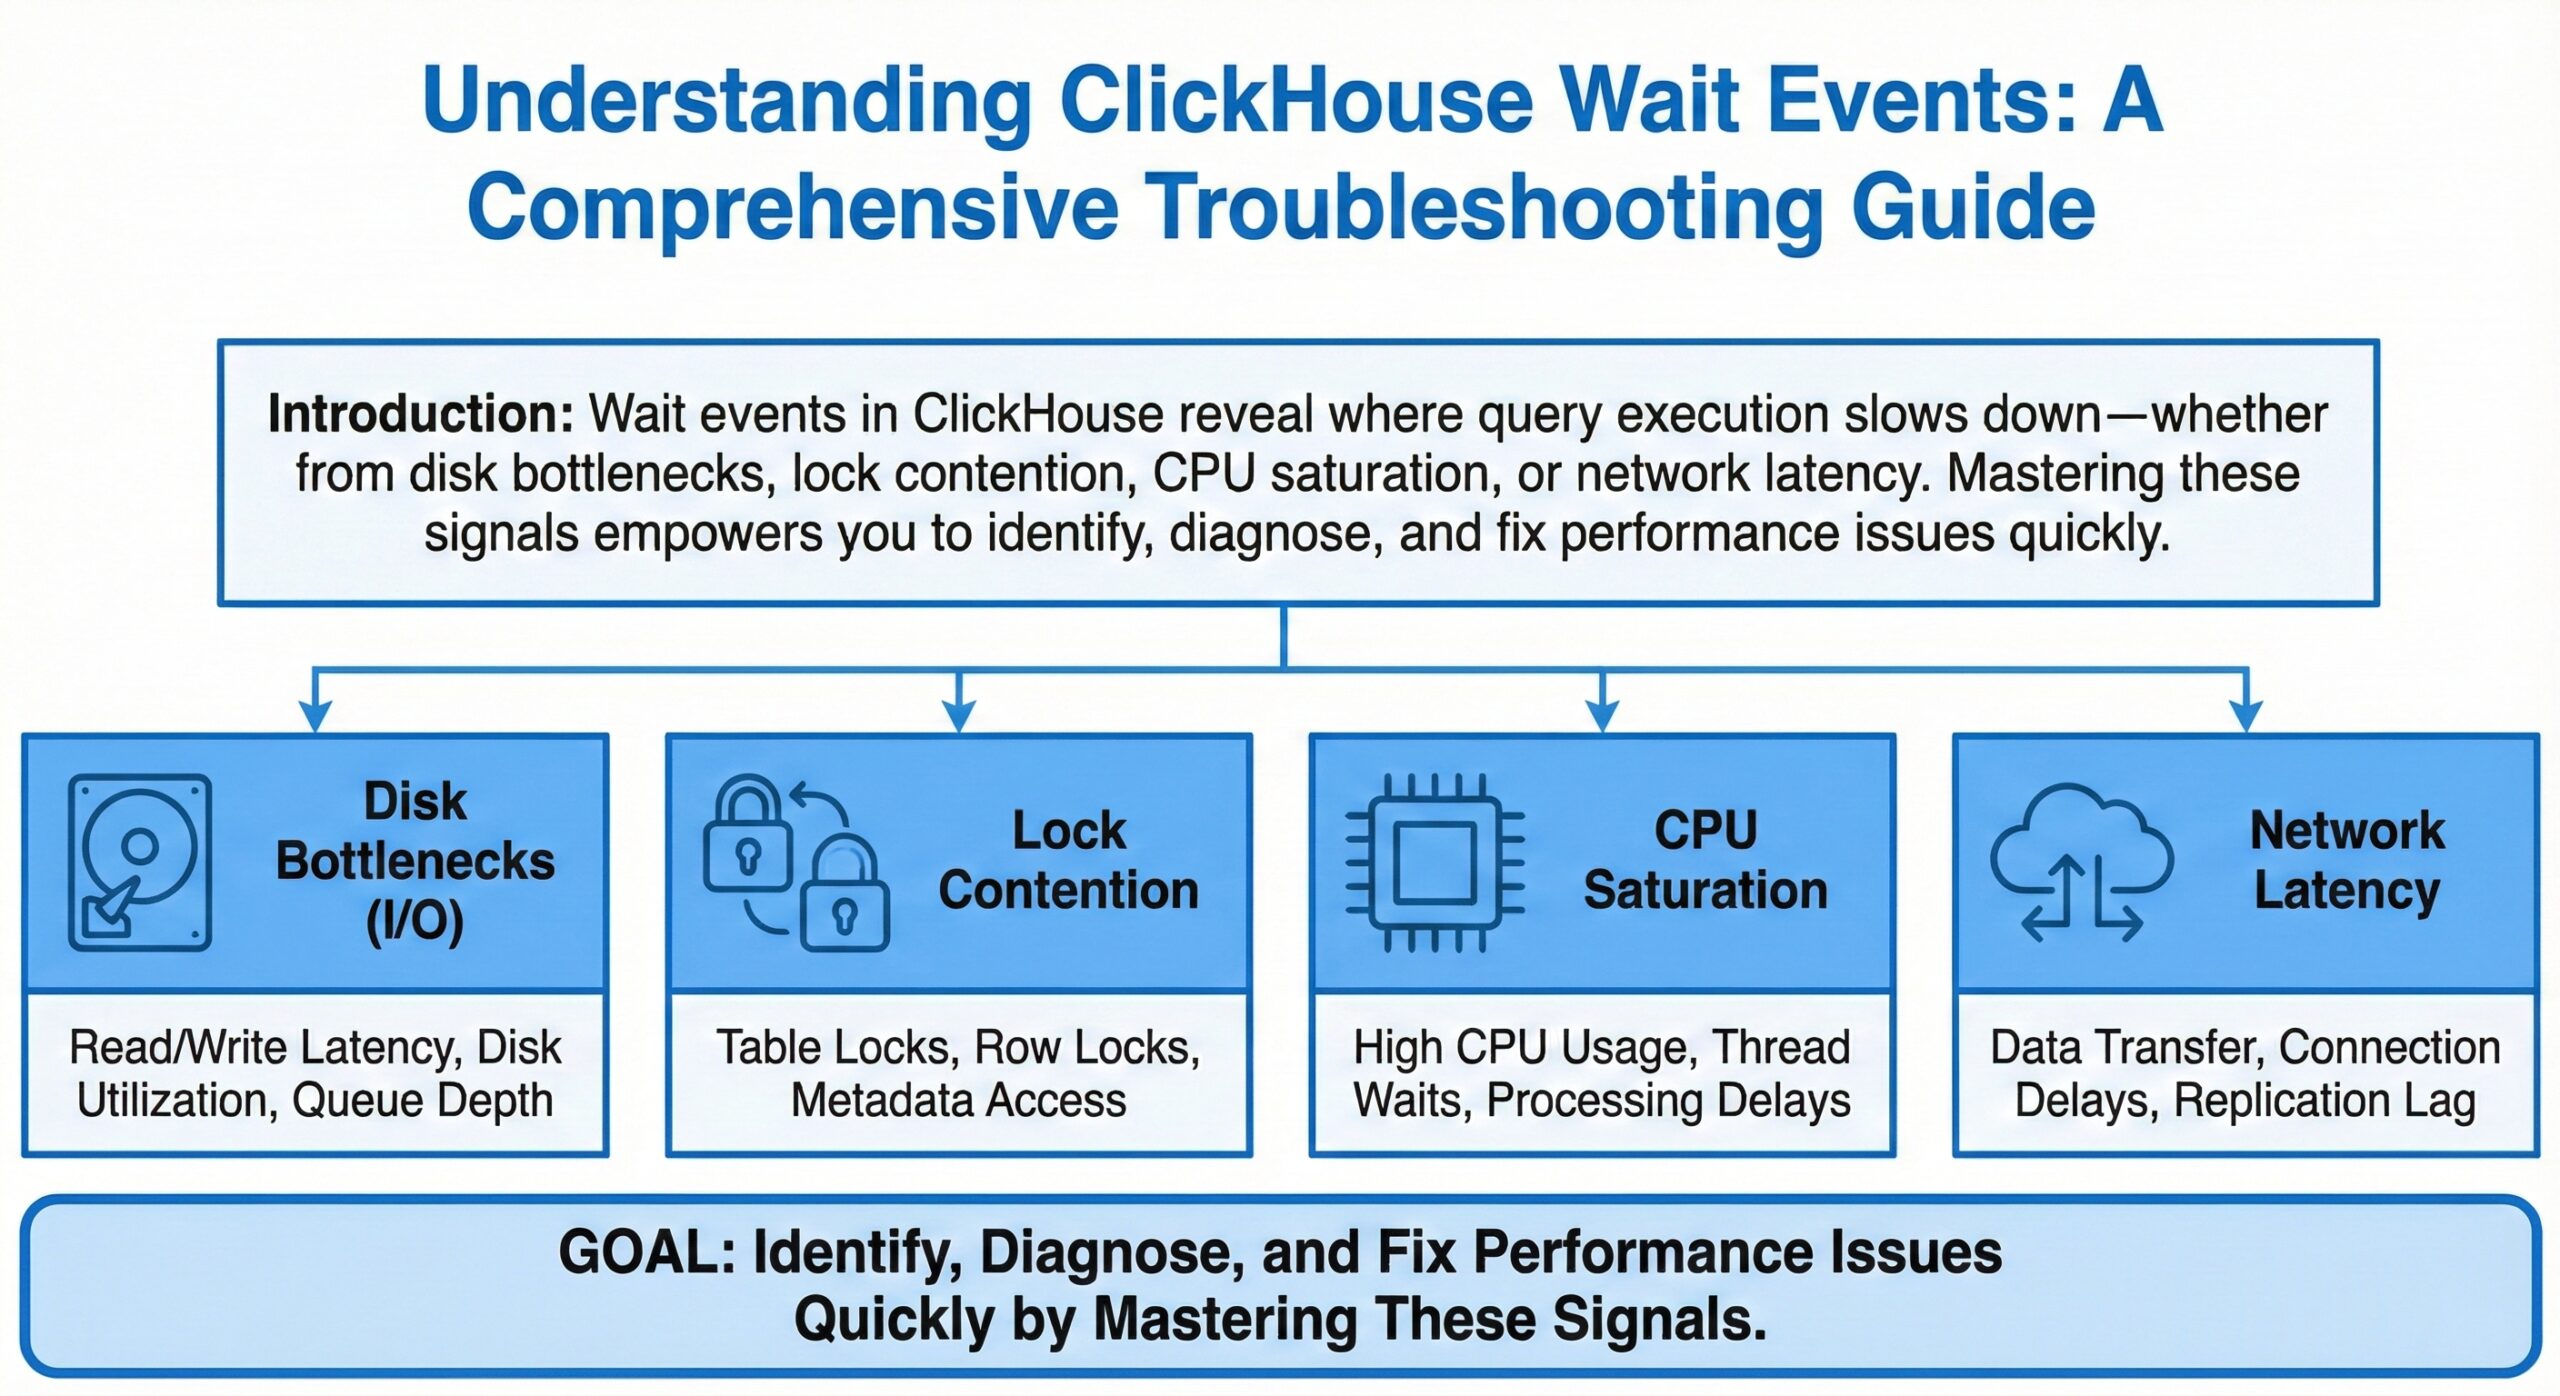
Wait events in ClickHouse reveal where query execution slows down—whether from disk bottlenecks, lock contention, CPU saturation, or network latency. Mastering these signals empowers you to identify, diagnose, and fix performance issues quickly.
1. What Are ClickHouse Wait Events?
Wait events record specific points in query processing where ClickHouse pauses, most often for resources like disk, CPU, mutexes, or network. These pauses are logged as metrics through system tables, letting you pinpoint execution bottlenecks.
2. Key Diagnostic Tables
system.query_log
- Stores query metadata: start time, duration, resource use, error messages, and statistics
- Columns to monitor: QueryDurationMicroseconds, ReadRows, ReadBytes, MemoryUsage, ProfileEvents
system.query_thread_log
- Provides thread-level breakdowns of query execution
- Essential for understanding exactly where threads are spending time—disk IO, mutex waits, CPU scheduling, network delays
- Columns: ProfileEvent, EventTimeMicroseconds
system.metric_log
- Tracks ongoing system-wide metrics, including mutex lock times (LockAcquireMicroseconds), useful for spotting concurrency and contention issues
3. Interpreting ProfileEvent Metrics
ProfileEvents map ClickHouse’s internal actions, from disk access to CPU cycles:
- Disk IO waits: High DiskReadElapsedMicroseconds or DiskWriteElapsedMicroseconds
- CPU contention: Elevated CPU wait times, insufficient max_threads
- Mutex waits: High LockAcquireMicroseconds or thread pool lock contention, which can severely degrade performance in concurrent settings
- Network delays: Increased durations in distributed send/merge events or when waiting for ZooKeeper/quorum in replicated clusters
4. Common Wait Event Scenarios & Practical Workflows
a. Disk I/O Bottleneck
Symptom: High disk wait metrics, slow query execution
Troubleshooting:
- Check DiskIOWait in system logs
- Use iostat -dx 1 for OS-level disk checks
- Review table partitioning and query patterns—optimize for sequential reads
b. Mutex/Lock Contention
Symptom: Increased lock acquisition waits, thread pool idling
Troubleshooting:
- Analyze LockAcquireMicroseconds in system.metric_log
- Use thread pool stats and OS profiling to find hotspots
- Consider schema and query changes to reduce concurrent DDL or persistent locks
c. Network Latency
Symptom: Delays in data transfer in distributed queries
Troubleshooting:
- Audit network latencies in distributed wait events
- Review replication and ZooKeeper health for lag
- Optimize partitioning for local data access when possible
d. CPU Contention
Symptom: Slow queries when system load is high but not disk-bound
Troubleshooting:
- Check CPUWait events and OS resource graphs
- Adjust max_threads and block sizes for better parallelism
5. Workflow Example: Diagnosing a Slow Query
SELECT query_id, QueryDurationMicroseconds, ProfileEvents
FROM system.query_log
WHERE QueryDurationMicroseconds > 10000000
ORDER BY QueryDurationMicroseconds DESC
LIMIT 5;
- Zero in on long-running queries
- Check their associated ProfileEvents for Disk IO, Lock, Network, and CPU metrics
- Drill down into thread logs to see if wait times are clustered on disk, mutexes, or network
6. Proactive Troubleshooting Tips
- Keep system logs and metrics enabled for detailed history
- Regularly optimize tables and review schema for concurrent operations
- Profile queries with high wait events—apply targeted schema/query/model changes for relief
- Adjust resource parameters (max_threads, block sizes) to tune for current hardware and load
Conclusion
ClickHouse wait events offer deep insights into query delays and system bottlenecks. By leveraging system tables—system.query_log, system.query_thread_log, system.metric_log—and focusing on ProfileEvent metrics, database engineers can quickly diagnose issues ranging from disk IO and mutex contention to CPU and network latency. Regular reviews and targeted adjustments ensure smooth, responsive analytic workloads at scale.
Need help with a recurring bottleneck or want step-by-step query troubleshooting advice? Reach out—let’s optimize your ClickHouse stack!
Why ChistaDATA Recommends ClickHouse for Modern Analytics
At ChistaDATA, we’ve witnessed firsthand how ClickHouse transforms analytics capabilities across industries. Our clients consistently report:
- 10x to 100x performance improvements over traditional databases
- Significant cost reductions through efficient resource utilization
- Faster time-to-insight enabling data-driven decision making
- Simplified architecture reducing operational complexity
Getting Started with ClickHouse: Your Path to Analytics Excellence
Assessment and Planning
Our experts evaluate your current analytics infrastructure and identify optimization opportunities specific to your use case.
Implementation and Migration
Seamless migration strategies ensure minimal disruption while maximizing performance gains from day one.
Optimization and Support
Ongoing performance tuning and expert support ensure you’re getting maximum value from your ClickHouse investment.
The Future of Analytics is Here
ClickHouse represents the future of analytical databases—purpose-built for the scale and speed demands of modern business. Its versatile architecture makes it suitable for a wide range of analytics use cases, from simple reporting to complex machine learning pipelines.
Don’t let slow queries and outdated infrastructure hold your business back. The companies that will thrive in the data-driven economy are those that can turn information into insights faster than their competition.
Further Reading
- Reduce Query Memory Usage in ClickHouse
- Partitioning in ClickHouse
- Connect Prometheus to Your ClickHouse® Cluster
- ClickHouse Projections: A Complete Guide to Query Optimization
- Updating and Deleting ClickHouse Data with Mutations