The ClickHouse query parser is the first thing a statement meets and the part of the engine engineers understand least, because it works silently until the day a query is rejected with a syntax error that looks valid, returns a column it was not asked for, or runs a plan nobody expected. This page follows one statement from text to executable plan through the stages ClickHouse actually has: lexing and parsing into an abstract syntax tree, the analyzer that resolves names and types, the rewrites and optimisations that transform the tree, and the planner that turns it into the pipeline.
At each stage it shows how to see the intermediate result with EXPLAIN, which settings change the behaviour, and which production surprises originate there.
The posts in this category are broad, covering everything from the query optimizer’s stages to PREWHERE, LowCardinality, materialized views and query-log mining; this page is the front end of that chain, and it links to the posts for what happens after the parser hands off.
Stage 1: text to AST, what the ClickHouse query parser accepts
ClickHouse uses a hand-written recursive-descent parser, not a generated grammar, which is why its error messages point at a position and list the tokens it expected (“Syntax error: failed at position 42 (‘FROM’): … Expected one of: …”). The parser produces an AST whose nodes are the SQL clauses and expressions, with identifiers still unresolved: at this stage user_id is just a name, not a column of a known table with a known type.
Two things the parser does that other engines defer to later stages: it applies some syntactic rewrites immediately (aliases, * expansion markers, tuple and lambda syntax), and it enforces the dialect (dialect = 'clickhouse' by default; 'prql' and 'kusto' exist as experimental front ends since 22.x).
EXPLAIN AST
SELECT tenant_id, count() AS c
FROM events
WHERE event_date = today() AND status = 'failed'
GROUP BY tenant_id
ORDER BY c DESC
LIMIT 10;
-- SelectWithUnionQuery
--  ExpressionList
--   SelectQuery
--    ExpressionList (children 2)
--     Identifier tenant_id
--     Function count (alias c)
--    TablesInSelectQuery ...
--    Function and (children 1) ...
--    ExpressionList  (GROUP BY)
--    ...
Reading EXPLAIN AST is rarely necessary in production, but it settles the questions the ClickHouse query parser is blamed for: whether a keyword is reserved, whether a construct parsed as a function call or an identifier, and whether an alias was attached where it was intended. The parser’s own limits are also settings: max_query_size (default 256 KiB) bounds the text, max_parser_depth (default 1,000) bounds nesting, and max_ast_elements and max_expanded_ast_elements bound the tree after expansion, which is where a generated query with ten thousand OR terms fails.
Stage 2: the analyzer behind the ClickHouse query parser, where names become columns
The analyzer takes the AST and resolves every identifier against the tables in scope, assigns types, expands * and COLUMNS(), resolves aliases (ClickHouse allows an alias to be used anywhere in the same query, including in WHERE, which other dialects forbid), and produces a typed query tree. Since 24.3 this is the new analyzer (allow_experimental_analyzer = 1 by default, renamed enable_analyzer in 24.x); the old analyzer remains selectable for compatibility and behaves differently in edge cases, which is the single most common source of “this query changed meaning after the upgrade” tickets.
The behaviours worth knowing at this stage. Alias resolution can shadow a column: SELECT toDate(ts) AS ts ... WHERE ts > ... filters on the alias, not the column, under both analyzers, and the predicate will not use the primary index. Scalar subqueries are evaluated once and cached per query.
ARRAY JOIN and lambda parameters introduce scopes the old analyzer resolved loosely and the new one strictly, so a query that relied on a name leaking out of a subquery breaks under the new analyzer with UNKNOWN_IDENTIFIER. And GROUP BY with an alias that matches a column name groups by the alias.
EXPLAIN QUERY TREE
SELECT toDate(ts) AS ts, count()
FROM events
WHERE ts >= '2026-09-01'
GROUP BY ts;
-- shows the resolved tree: WHERE compares the alias expression toDate(ts), not the column
-- the primary index on ts is therefore not usable; rename the alias to fix

SET enable_analyzer = 0;   -- compare with the old analyzer's resolution when a query changed meaning across 24.3
Stage 3: rewrites the ClickHouse query parser pipeline applies before planning
Between the analyzer and the planner, a series of tree-level rewrites run, each controlled by a setting and each visible as a difference between EXPLAIN QUERY TREE and EXPLAIN PLAN.
The ones that matter for production behaviour: predicate push-down into subqueries and views (enable_optimize_predicate_expression, on), moving predicates to PREWHERE (optimize_move_to_prewhere, on), constant folding, count() from metadata when the table supports it (optimize_trivial_count_query), rewriting uniq over a key to count, injective function removal from GROUP BY keys (optimize_injective_functions_in_group_by), IN with a constant list turned into a set, and the materialized-view and projection selection that decides whether a query reads the base table at all (optimize_use_projections, allow_experimental_projection_optimization in older versions).
EXPLAIN PLAN actions = 1, optimize = 1
SELECT tenant_id, uniq(order_id), count()
FROM events
WHERE event_date = today()
GROUP BY tenant_id;
-- with optimize = 0 the plan shows the tree before rewrites; the diff is the rewrite set
-- Expression → Aggregating → Filter (PREWHERE) → ReadFromMergeTree
-- ReadFromMergeTree shows the projection or the base table that was chosen
The PREWHERE versus WHERE post measures the most consequential of these rewrites, and the query optimizer post walks the whole sequence from AST to execution.
Stage 4: the planner and the pipeline
The planner turns the rewritten tree into a query plan (EXPLAIN PLAN), a tree of steps such as ReadFromMergeTree, Filter, Aggregating, Sorting, Limit, and then into a pipeline (EXPLAIN PIPELINE), a graph of processors with a parallelism per step.
This is where index analysis happens (EXPLAIN indexes = 1 annotates the ReadFromMergeTree step with partition, minmax, primary-key and skip-index pruning), where the join algorithm is chosen, and where distributed queries are split into initiator and shard plans. The EXPLAIN PIPELINE post reads a pipeline in detail; the point for this page is that everything the planner does is downstream of what the analyzer resolved, so a wrong plan is often a parser- or analyzer-stage problem in disguise.
| Stage | EXPLAIN form | Settings that change it | Production symptom it explains |
|---|---|---|---|
| 1. Parse | EXPLAIN AST | max_query_size, max_parser_depth, dialect | syntax error on a generated query; “expected one of” |
| 2. Analyze | EXPLAIN QUERY TREE | enable_analyzer, prefer_column_name_to_alias | alias shadowing a column; UNKNOWN_IDENTIFIER after upgrade |
| 3. Rewrite | EXPLAIN PLAN optimize = 0 vs 1 | optimize_move_to_prewhere, optimize_use_projections, enable_optimize_predicate_expression | predicate not pushed into a view; projection not used |
| 4. Plan | EXPLAIN PLAN indexes = 1, EXPLAIN PIPELINE | max_threads, join_algorithm, optimize_skip_unused_shards | full scan; single-threaded stage; all shards hit |
| 5. Execute | system.query_log, trace_log | max_execution_time, max_memory_usage | the limits and the profile |
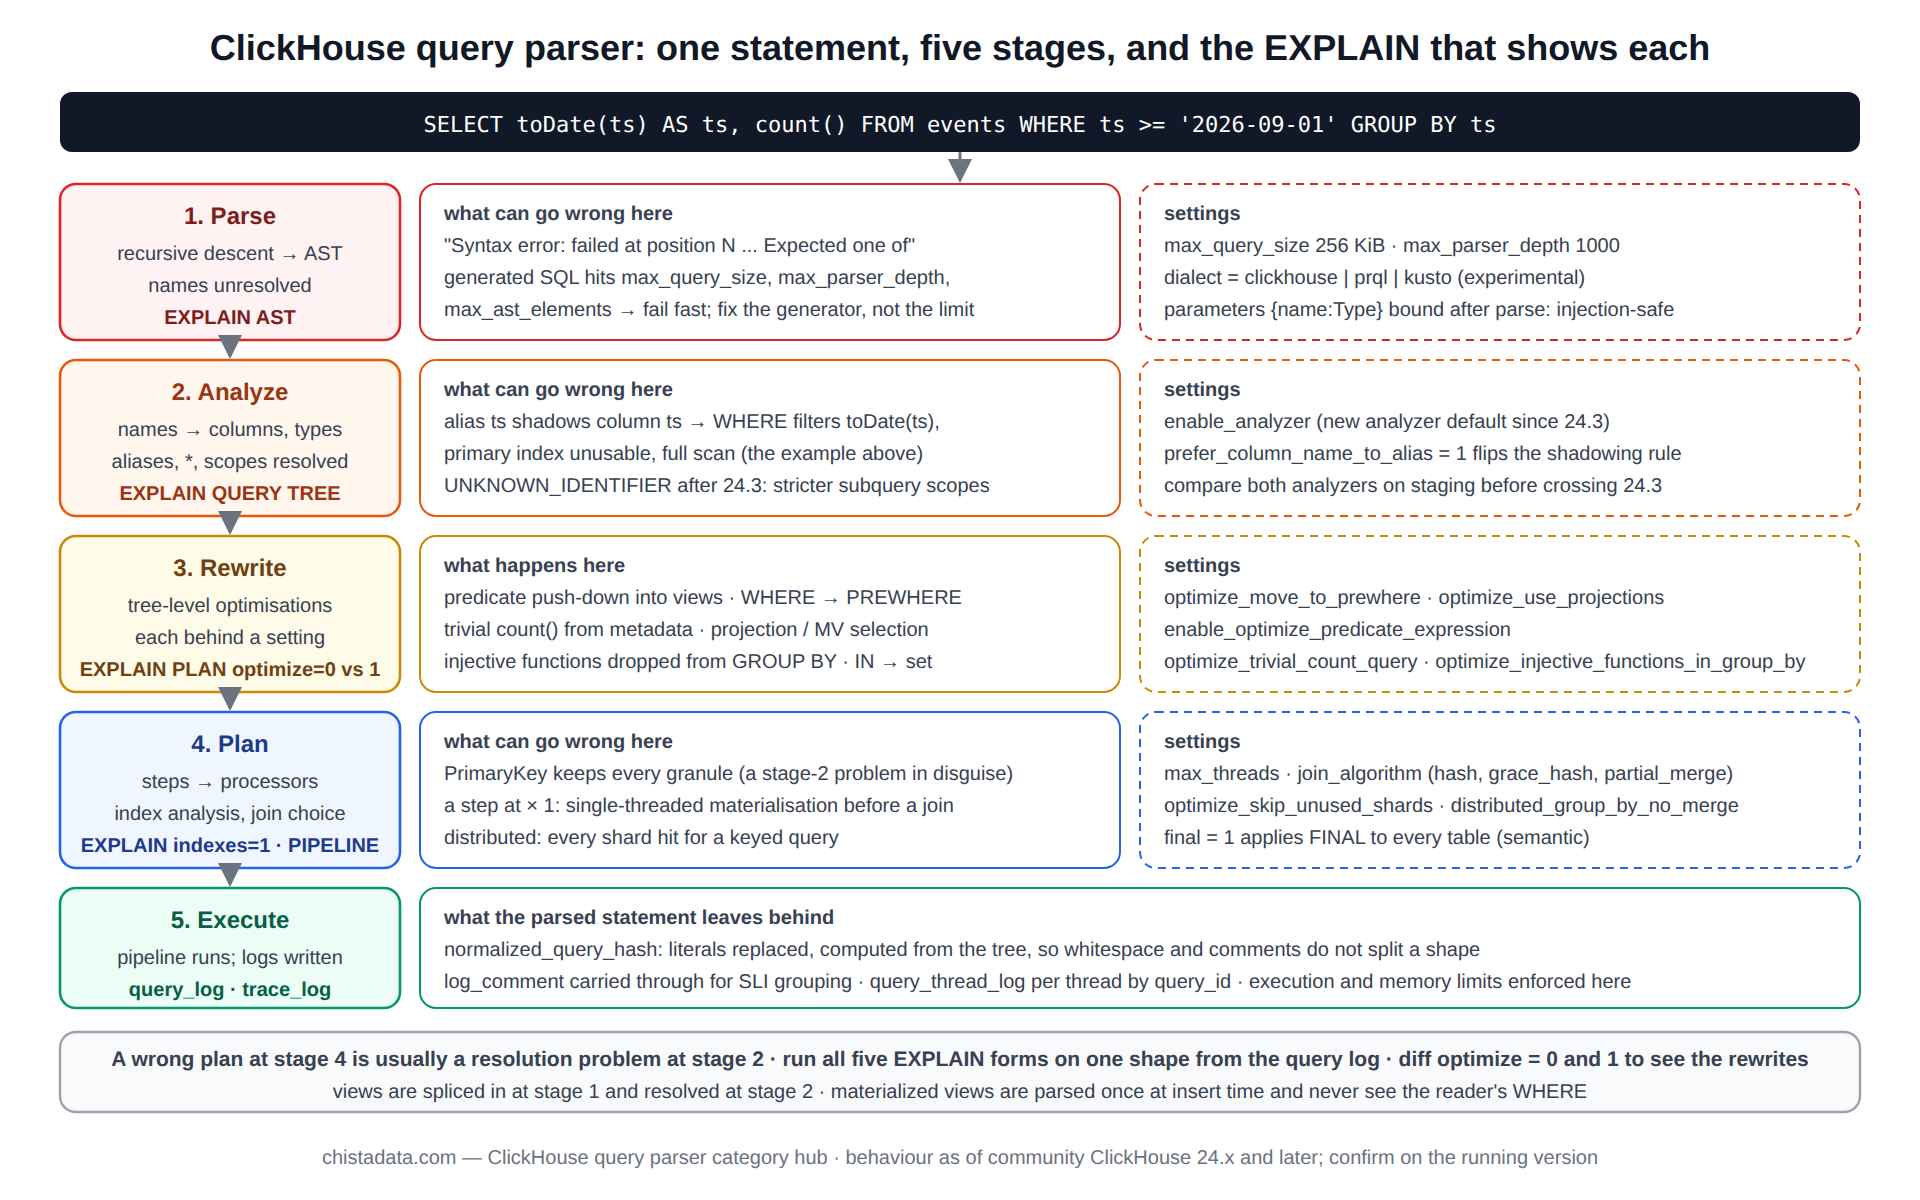
A ClickHouse query parser walkthrough: one statement, five outputs
The fastest way to internalise the stages is to run the five EXPLAIN forms against one real statement from the query log and read them in order. The sequence below is the one used in reviews; each form answers one question, and the answers compose.
-- 1. did it parse the way it was written?
EXPLAIN AST        SELECT tenant_id, sum(amount_cents) AS cents FROM events WHERE event_date = today() GROUP BY tenant_id;
-- 2. what did every name resolve to, and what type?
EXPLAIN QUERY TREE SELECT tenant_id, sum(amount_cents) AS cents FROM events WHERE event_date = today() GROUP BY tenant_id;
-- 3. what did the rewrites change? (run with optimize = 0 and optimize = 1, diff the two)
EXPLAIN PLAN optimize = 0 SELECT ...;
EXPLAIN PLAN optimize = 1 SELECT ...;
-- 4. what will be read, and through which index?
EXPLAIN indexes = 1 SELECT ...;
-- 5. how will it run, and how parallel is each step?
EXPLAIN PIPELINE SELECT ...;
Three findings recur when this sequence is run on a customer’s top shapes. The query tree shows an alias shadowing a key column (stage 2), which explains a full scan that the SQL text made look impossible. The plan with optimize = 1 shows a projection being chosen for one shape and ignored for a near-identical one because of a function on the group key (stage 3).
And the pipeline shows a × 1 step where a subquery’s result is being materialised on one thread before a join (stage 4). None of the three is visible from the query text, and all three are visible in under a minute with the five commands.
Views, materialized views and the ClickHouse query parser
A normal view is a stored AST: at query time the parser splices the view’s tree into the outer query and the analyzer resolves the combined tree, which is why predicates can be pushed into a view (stage 3) and why a view over a Distributed table behaves as if the outer query were written against it directly.
A materialized view is different in kind: its SELECT is parsed and analysed once at insert time against the block being inserted, not at query time, so the query tree it produces never sees the base table’s existing rows and never sees a WHERE from a later reader. That distinction is the source of most materialized-view surprises, and the materialized view performance post works through them with the tree in hand.
What the ClickHouse query parser does with the query text afterwards
The parsed statement leaves two artefacts that operations depend on, and both are products of the ClickHouse query parser rather than of the raw text. system.query_log stores the original text in query and a normalised form in normalized_query_hash, where literals are replaced by placeholders so that the same shape with different constants hashes identically; this is what makes query-log mining possible, and it is computed from the parsed tree, not from the text, so whitespace and comment differences do not split a shape.
system.query_thread_log, covered in the query_thread_log post, records per-thread execution against the same query_id, which is how a plan step’s cost is attributed.
The log_comment setting rides alongside: a client can attach a string to every statement, the parser carries it through, and it lands in the log as a column that groups queries by application, dashboard or SLI group without touching the SQL. The reliability hub uses it as the basis for per-group SLIs.
Where the ClickHouse query parser differs from PostgreSQL and MySQL
Engineers arriving from transactional engines meet five differences in the first week. Aliases are visible everywhere in the query, including WHERE and GROUP BY, which is convenient and is the shadowing trap above. Identifiers are case-sensitive and back-tick or double-quote quoted. Function names are case-sensitive too, and the library is enormous (over a thousand functions), so SELECT name FROM system.functions WHERE name ILIKE '%date%' is the fastest way to find one.
SELECT without FROM is valid, and FROM can precede SELECT since 23.x. And there is no implicit type coercion in comparisons between a String column and a number; the parser accepts it and the analyzer rejects it with ILLEGAL_TYPE_OF_ARGUMENT, which reads as a parse error to the unfamiliar.
-- valid ClickHouse that most dialects reject
SELECT number * 2 AS doubled FROM system.numbers WHERE doubled > 10 LIMIT 3;     -- alias in WHERE
FROM system.numbers SELECT number LIMIT 3;                                      -- FROM first (23.x+)
SELECT 1;                                                                       -- no FROM

-- rejected at analysis, not parsing
SELECT * FROM events WHERE status = 1;            -- status is String: ILLEGAL_TYPE_OF_ARGUMENT
SELECT * FROM events WHERE toString(status) = '1'; -- fine, but defeats the index; fix the literal instead
Guarding the ClickHouse query parser in production
Generated SQL is the usual source of parser-stage incidents: an ORM that builds a ten-thousand-term IN list, a BI tool that nests subqueries forty deep, a template that produces a 2 MB statement. Each hits a limit (max_ast_elements, max_parser_depth, max_query_size) and fails fast, which is the correct outcome; raising the limit is rarely the fix, and rewriting the generator to use a temporary table or an external dictionary usually is.
Parameterised queries ({name:Type} syntax with --param_name or the HTTP param_name) are the other guard: the ClickHouse query parser binds the value after parsing, so a value cannot alter the statement’s structure, which closes the injection class that string concatenation opens.
-- parameterised, bound after parse
SELECT count()
FROM events
WHERE tenant_id = {tenant:UInt32}
AND event_date >= {since:Date};
-- clickhouse-client --param_tenant=42 --param_since=2026-09-01
-- HTTP: ?param_tenant=42¶m_since=2026-09-01Settings that live at the parser and analyzer boundary
A short list is worth keeping in the profile review, because each of these changes what a statement means rather than how fast it runs. prefer_column_name_to_alias (default 0) flips the alias-shadowing rule so that a column wins over an alias of the same name; turning it on fixes the shadowing trap globally but changes the result of any query that relied on the alias.
enable_analyzer selects the analyzer generation. dialect selects the front end. max_query_size, max_parser_depth, max_ast_elements and max_expanded_ast_elements are the parser’s limits. final (since 23.x) applies FINAL to every table in the query, a semantic change the parser stage enforces. Each is recorded with its value in the settings baseline that the daily settings audit compares against, because a silent change to any of them changes query results without an error.
Version notes
The new analyzer became the default in 24.3 (allow_experimental_analyzer, later enable_analyzer); the old analyzer is still selectable through 25.x for compatibility and is scheduled for removal, so confirm on the running version. EXPLAIN QUERY TREE exists only under the new analyzer. FROM-first syntax is 23.x and later. PRQL and Kusto dialects are experimental front ends since 22.x. Parameterised query syntax has been stable since 20.x. The EXPLAIN documentation is the reference for every form used above.
Reading the archive
The archive is wider than the ClickHouse query parser itself, because most of what goes wrong at the front end is only visible at the back end: a resolution mistake at stage 2 appears as a slow scan at stage 5. Read the posts with the five-stage table beside them and place each symptom on its stage.
Start with the query optimizer post for the end-to-end journey, then the EXPLAIN PIPELINE post for stage 4, PREWHERE versus WHERE for the most important stage-3 rewrite, and the query-log and query_thread_log posts for what the parsed statement leaves behind. The LowCardinality and materialized-view posts explain why the analyzer’s type resolution matters for speed.
ChistaDATA’s ClickHouse consulting practice reviews analyzer-boundary upgrades (any crossing of 24.3) query-shape by query-shape before production, and 24×7 support handles the parser-stage incidents generated SQL produces. Compare EXPLAIN output under both analyzers on staging before upgrading, keep the old analyzer switchable per profile for the transition, and never raise a parser limit without understanding what generated the statement that hit it.