Troubleshooting Disk Space Issues: Managing ClickHouse Log Tables
ClickHouse is a high-performance, columnar database management system optimized for real-time analytical workloads. While its speed and scalability make it ideal for large-scale data processing, one common operational challenge is uncontrolled growth of system log tables, which can consume significant disk space over time. This guide provides a comprehensive approach to identifying space-consuming log tables, implementing retention policies using TTL (Time-to-Live), safely truncating system tables, and configuring query logging to balance observability with storage efficiency.
Why ClickHouse Log Tables Consume Disk Space
ClickHouse maintains several system tables that record internal operations such as query execution, errors, and performance metrics. Key tables include:
- system.query_log – Logs every executed query.
- system.query_thread_log – Tracks thread-level details of queries.
- system.trace_log – Captures stack traces for profiling.
- system.text_log – Stores server logs at various severity levels.
By default, these tables are enabled and can grow rapidly, especially under high query load. For example, older ClickHouse configurations or third-party integrations (like FastNetMon) have been known to log every single query, consuming tens of gigabytes of disk space. Without proper management, this can lead to disk exhaustion and service outages.
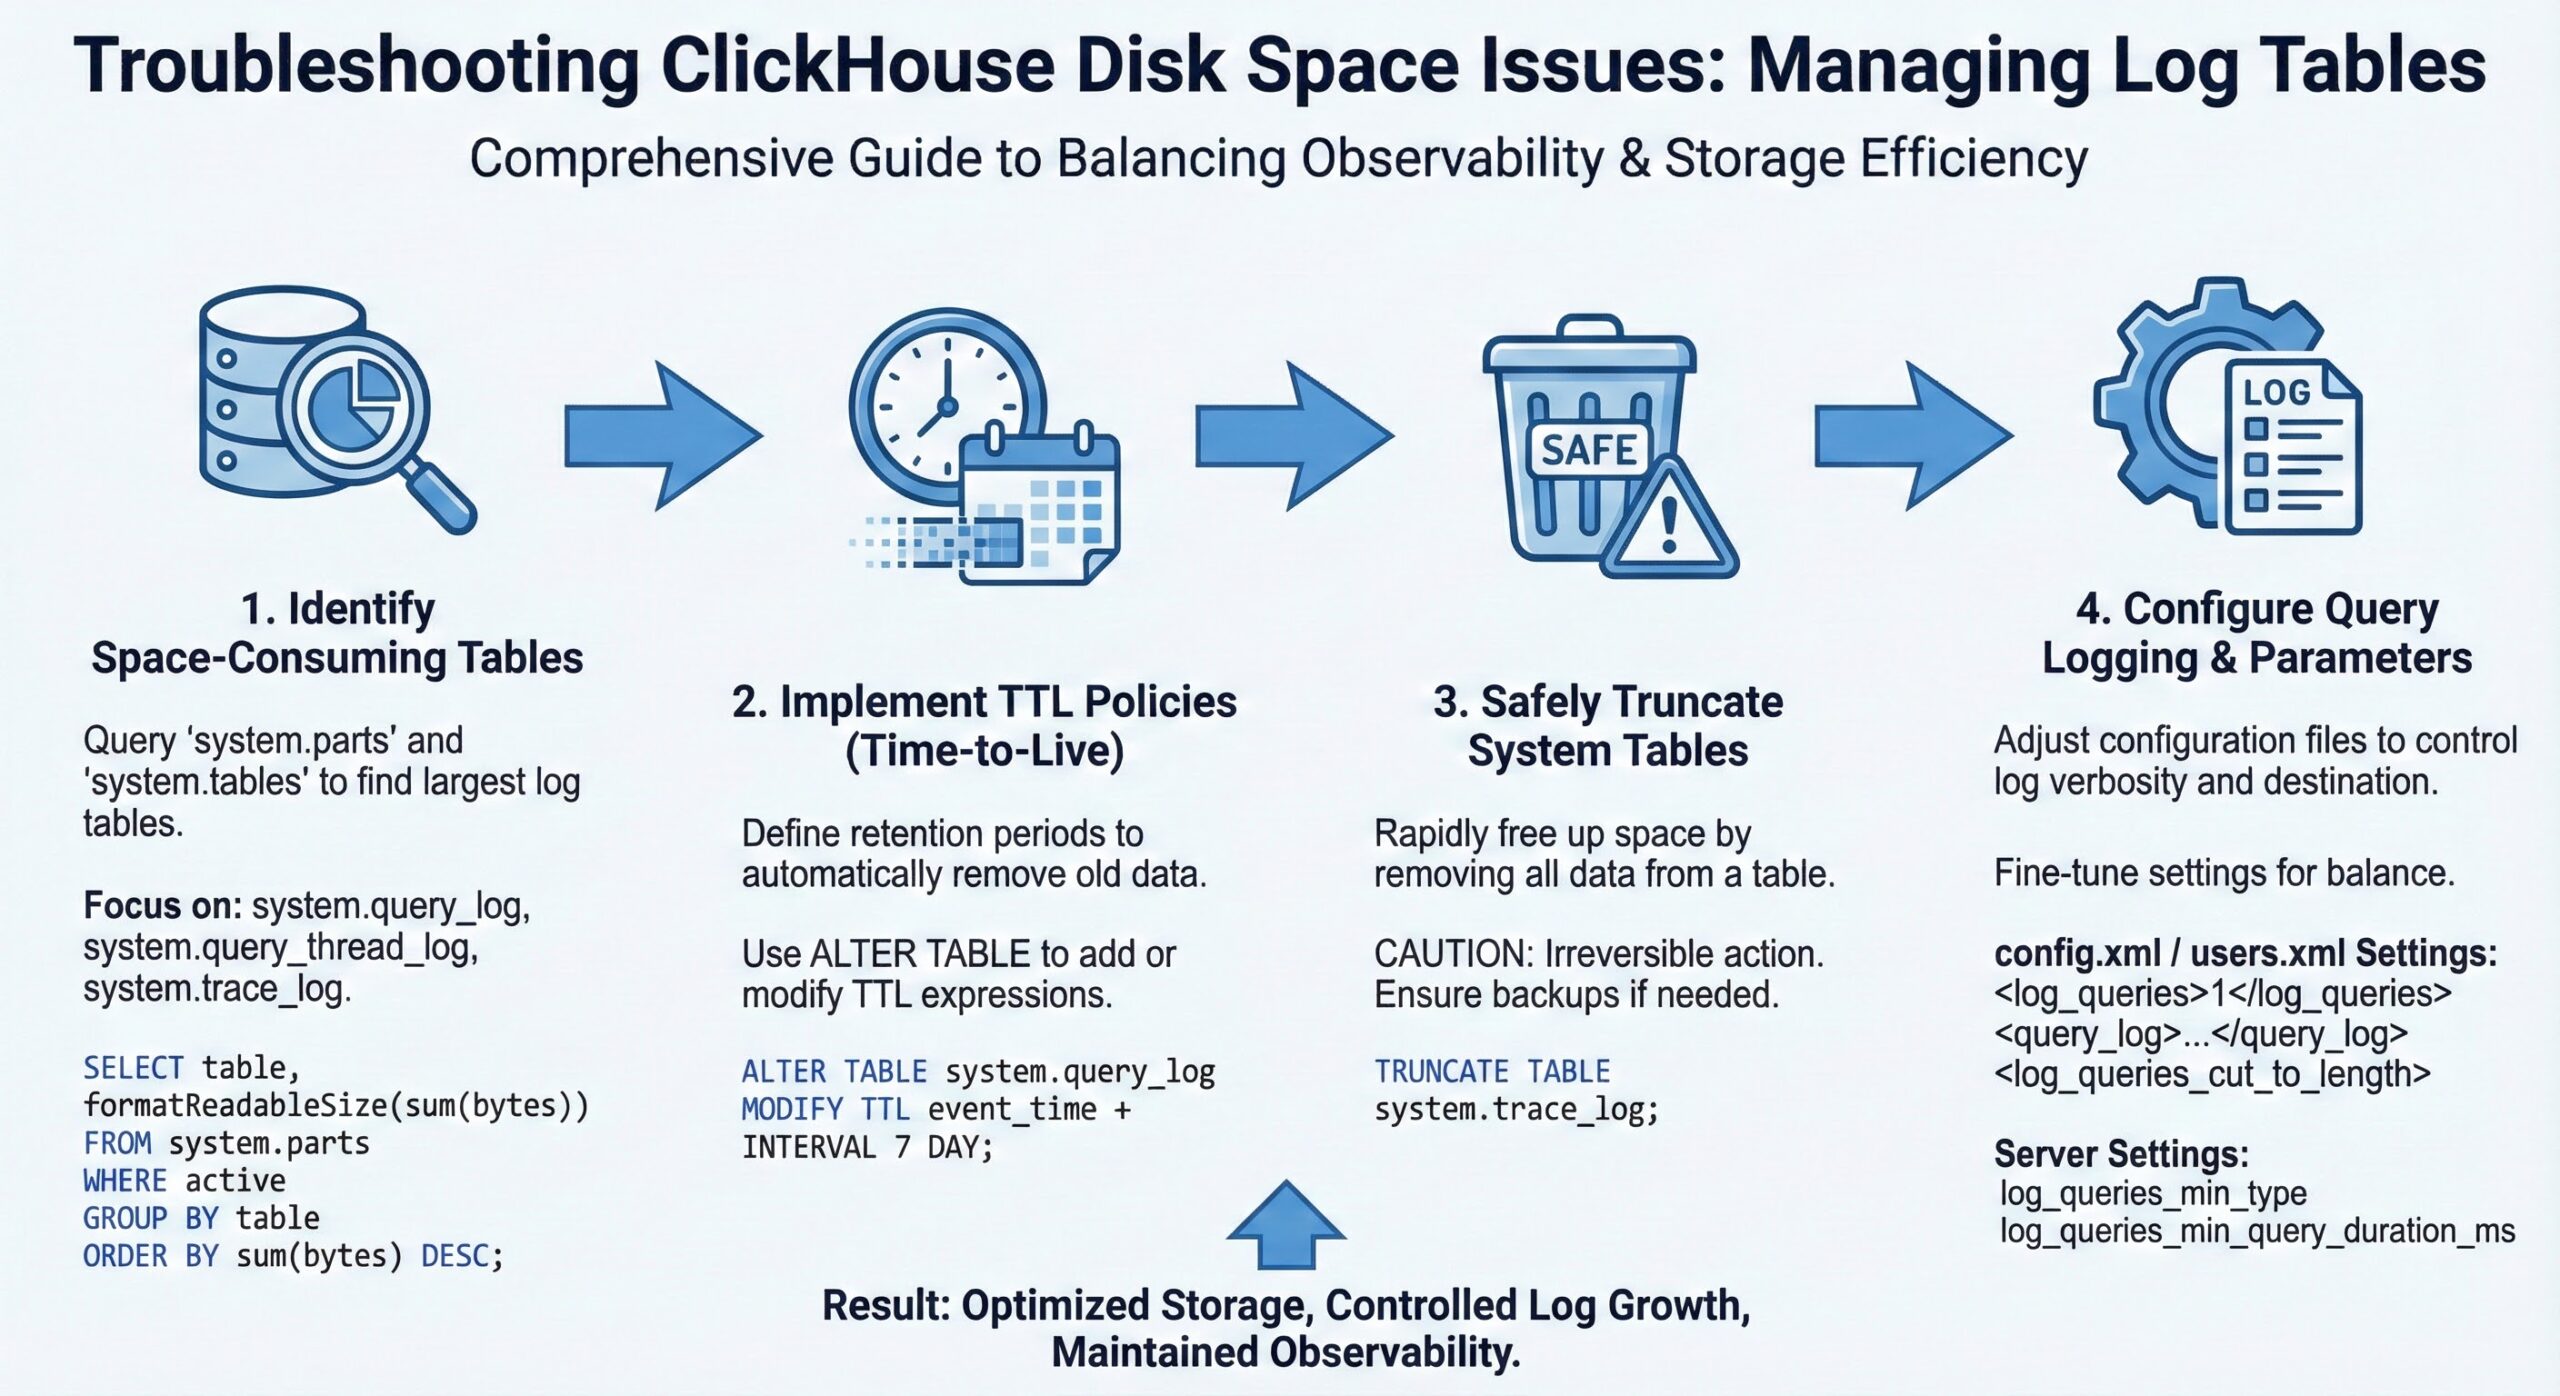
Step 1: Identify Space-Consuming Log Tables
Before taking corrective action, identify which system tables are consuming the most space.
Use Built-in Queries to Analyze Table Sizes
Run the following query to list all system tables by their disk usage:
SELECT
    database,
    table,
    formatReadableSize(sum(data_compressed_bytes)) AS compressed_size,
    sum(rows) AS row_count,
    min(min_date) AS min_date,
    max(max_date) AS max_date
FROM system.parts
WHERE database = 'system'
GROUP BY database, table
ORDER BY data_compressed_bytes DESC
This query uses system.parts, which contains metadata about data parts on disk, to calculate the total compressed size and row count per table 4. The formatReadableSize() function makes the output human-readable.
> Tip: If you’re using ClickHouse Cloud or a clustered setup, wrap the query with clusterAllReplicas() to aggregate data across all nodes 5.
Step 2: Implement TTL (Time-to-Live) for Automatic Retention
TTL is the most effective way to automate log retention and prevent unbounded growth. It allows you to define how long data should be retained before being automatically deleted or moved.
Enable TTL on Query Log Tables
To set a 7-day retention policy on system.query_log, execute:
ALTER TABLE system.query_log
MODIFY TTL event_date + INTERVAL 7 DAY;
Similarly, apply TTL to other log tables:
ALTER TABLE system.query_thread_log
MODIFY TTL event_date + INTERVAL 7 DAY;

ALTER TABLE system.trace_log
MODIFY TTL event_date + INTERVAL 7 DAY;

ALTER TABLE system.text_log
MODIFY TTL timestamp + INTERVAL 7 DAY;
> Note: The TTL expression depends on the table’s timestamp column (event_date or timestamp). Always verify the correct column name using DESCRIBE TABLE system.query_log.
Verify TTL Configuration
Check that TTL is applied correctly:
SELECT database, table, engine, create_table_query
FROM system.tables
WHERE table LIKE '%log' AND database = 'system'
This shows the CREATE TABLE statement, where you can confirm the TTL clause is present.
TTL is processed asynchronously by ClickHouse’s merge scheduler. You can force an immediate cleanup using:
OPTIMIZE TABLE system.query_log FINAL;
Use this sparingly, as it can be resource-intensive.
Step 3: Safely Truncate System Tables
If log tables have already consumed excessive space, you may need to truncate them manually.
Truncate vs Drop
Use TRUNCATE instead of DROP to preserve table structure:
TRUNCATE TABLE system.query_log;
TRUNCATE TABLE system.query_thread_log;
TRUNCATE TABLE system.trace_log;
TRUNCATE TABLE system.text_log;
> Warning: Avoid dropping system tables unless absolutely necessary. In older ClickHouse versions (≤20), you may need to restart the server after renaming or dropping system tables.
Truncation is safe and immediate, but ensure no critical diagnostics are in progress.
Step 4: Optimize Query Logging Configuration
Reduce log verbosity to minimize data volume while retaining useful observability.
Modify config.xml to Control Logging
Edit your ClickHouse server configuration (/etc/clickhouse-server/config.xml) to adjust logging behavior.
Limit Query Logging Scope
Disable logging for specific query types in users.xml or config.xml:
<profiles>
  <default>
    <log_queries>1</log_queries>
    <!-- Log only queries that take longer than 1 second -->
    <log_queries_min_query_duration_ms>1000</log_queries_min_query_duration_ms>
    <!-- Exclude certain query types -->
    <log_queries_min_type>QUERY_FINISH</log_queries_min_type>
  </default>
</profiles>
- log_queries=1 enables query logging.
- log_queries_min_query_duration_ms logs only slow queries.
- log_queries_min_type can be set to EXCEPTION_BEFORE_START to avoid logging successful queries.
Reduce Text Log Verbosity
Adjust server log level in config.xml:
<logger>
  <level>warning</level> <!-- Change from 'trace' or 'debug' -->
</logger>
This reduces the volume in system.text_log and on-disk logs (/var/log/clickhouse-server).
Step 5: Monitor Disk Usage and Set Alerts
Proactive monitoring prevents surprise disk exhaustion.
Use system.disks to Check Disk Utilization
SELECT name, path, formatReadableSize(free_space) AS free, formatReadableSize(total_space) AS total
FROM system.disks;
This shows available space on each configured disk.
Monitor Table Growth Over Time
Create a monitoring dashboard that tracks:
- Daily growth of system.query_log
- Disk usage trends
- Merge and mutation activity
Use tools like Grafana with ClickHouse as a data source to visualize these metrics.
Best Practices Summary
| Practice | Recommendation |
|---|---|
| TTL Retention | Set 3–7 day TTL on all system log tables |
| Query Logging | Log only slow or failed queries |
| Text Logging | Use warning or error level in production |
| Monitoring | Track table sizes and disk usage daily |
| Backups | Use clickhouse-backup for critical configurations |
Conclusion
ClickHouse system log tables are invaluable for troubleshooting and performance tuning, but they require active management to prevent disk space issues 1. By identifying high-growth tables, applying TTL-based retention, and tuning logging verbosity, you can maintain a healthy balance between observability and storage efficiency. Regular monitoring and automated cleanup ensure long-term stability, especially in production environments with high query throughput.
Implement these strategies today to keep your ClickHouse deployment fast, reliable, and scalable.
Further Reading
- Essential ClickHouse Metrics
- Boosting Materialized View Performance
- PREWHERE vs WHERE in ClickHouse Queries
- Understanding ClickHouse Wait Events
- Reduce Query Memory Usage in ClickHouse