ClickHouse Performance Audit and Recommendations for Optimal Performance and Scalability | ChistaDATA Inc.
Introduction: Unlocking the Full Potential of ClickHouse
In today’s data-driven landscape, organizations rely on high-performance analytical databases to process billions of rows in real-time. ClickHouse, the open-source columnar database management system, has emerged as the gold standard for real-time analytics, offering unparalleled speed and efficiency for OLAP workloads. However, achieving optimal performance requires more than just deploying ClickHouse—it demands expert engineering, continuous optimization, and strategic architecture design.
ChistaDATA Inc. is the industry leader in ClickHouse consulting, support, and managed services, providing enterprise-class expertise in performance engineering, scalability optimization, and database SRE. With a dedicated team of ClickHouse performance engineers and 24×7 enterprise support, ChistaDATA ensures your analytical infrastructure remains responsive and efficient even as data volumes and query complexities grow.
What is a ClickHouse Performance Engineering Audit?
A ClickHouse Performance Engineering Audit is a comprehensive, ultra-low-level analysis of your database system’s performance, scalability, reliability, and data security. This detailed assessment goes beyond surface-level metrics to examine every aspect of your ClickHouse deployment—from server configuration and hardware utilization to query patterns, indexing strategies, and storage engine optimization.
The audit is performed by experienced ClickHouse performance engineers who use advanced tools and techniques to identify performance bottlenecks, scalability limitations, reliability issues, and security vulnerabilities. The result is a comprehensive report with actionable recommendations tailored to your specific workload characteristics and business requirements.
ChistaDATA’s Ultra-Low-Level Performance Audit Methodology
ChistaDATA’s performance audit methodology encompasses eight critical areas of analysis, ensuring no aspect of your ClickHouse deployment is overlooked:
1. Information Gathering
The audit begins with comprehensive data collection about your ClickHouse environment, including server configuration, hardware specifications, operating system settings, database schema, query patterns, and indexing strategies. This information is gathered through interviews with database administrators, review of system tables, query profiler analysis, and log examination.
2. Performance Testing
ChistaDATA utilizes advanced benchmarking tools to simulate realistic workloads and measure response times, throughput, and resource utilization. Key metrics monitored include CPU usage, memory consumption, disk I/O, network I/O, and query throughput. Tools such as the ChistaDATA Centralized Performance Monitoring system, Grafana, and Prometheus provide real-time visibility into database performance.
3. Query Analysis
Query analysis examines SQL queries executed by the database system to identify slow, inefficient, or resource-intensive operations. Using the ChistaDATA Anansi query profiler and system tables like system.query_log and system.query_thread_log, engineers analyze query performance metrics and generate detailed execution reports.
4. Compression Analysis
ClickHouse’s built-in compression algorithms (LZ4, ZSTD, Gzip) can significantly reduce storage requirements and improve query performance. The audit analyzes compression settings to identify the most effective algorithm for each column and optimize storage configurations accordingly.2
5. Database Schema Analysis
Schema analysis reviews data types, normalization, constraints, and data consistency using system tables such as system.columns and system.tables. This identifies opportunities to optimize data types, implement LowCardinality for string columns, and eliminate unnecessary Nullable columns that add processing overhead.
6. Storage Engine Analysis
ClickHouse supports multiple storage engines including MergeTree, ReplacingMergeTree, AggregatingMergeTree, and Distributed. The audit determines the most appropriate table engine for your use case, optimizes table parameters, and identifies data replication issues or network bottlenecks.
7. Disk Usage Analysis
Using system tables like system.parts, system.disks, and system.volumes, the audit analyzes disk usage patterns, data distribution, and storage availability. This identifies disk-related problems such as fragmentation, unbalanced data distribution, or insufficient disk space.
8. Security Analysis
Security analysis reviews access management, audit logging, encryption, network security, and compliance measures. By analyzing access logs, engineers identify suspicious activity, unauthorized access attempts, and potential vulnerabilities.
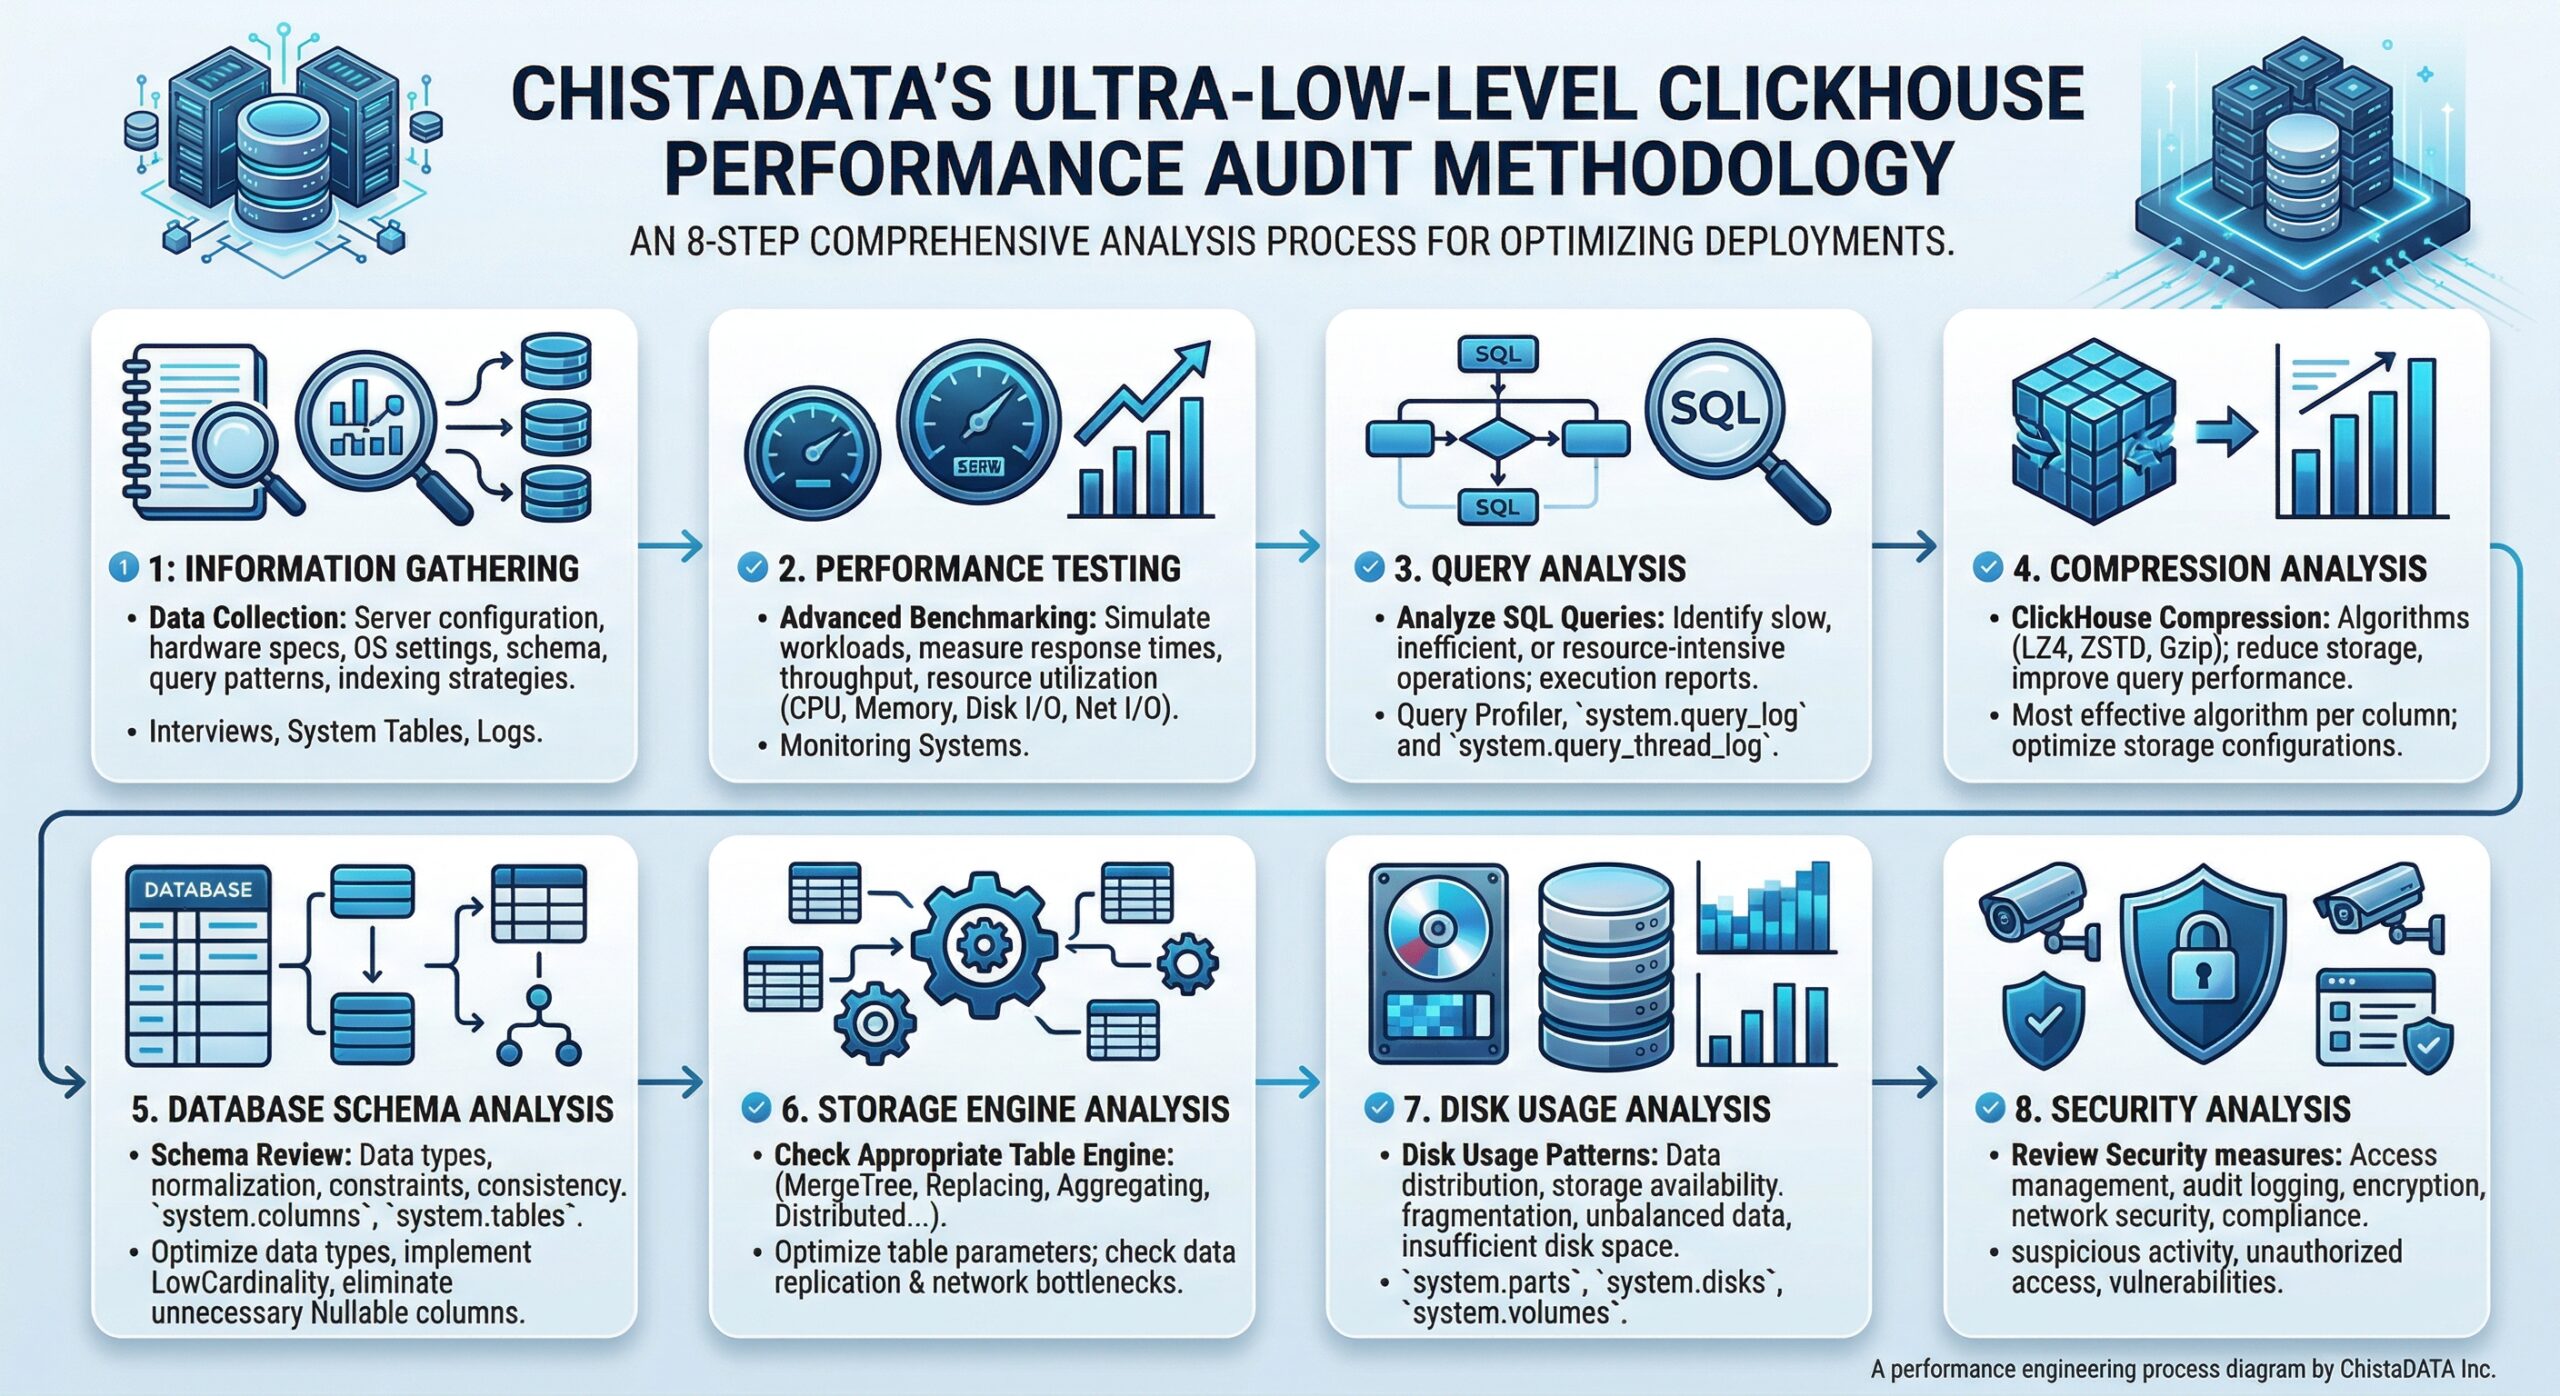
Figure 1: ChistaDATA’s comprehensive 8-stage ClickHouse Performance Engineering Audit workflow
Key Recommendations for Optimal ClickHouse Performance
Based on audit findings, ChistaDATA provides actionable recommendations across several critical areas:
Strategic Data Partitioning
Partitioning is a powerful feature that organizes table data into distinct parts based on specified key columns, allowing ClickHouse to quickly exclude large volumes of data from query processing.
Best Practices:
- Partition Key Selection: Choose partition keys that reflect the most common filtering criteria. For time-series data, partitioning by date (e.g., the toYYYYMM(dateColumn)) enables efficient time-range filtering.
- Granularity Balance: Avoid overly broad partitions that don’t sufficiently reduce scanned data, and overly fine partitions that create management overhead from many small files.
- TTL Implementation: Implement Time-To-Live rules for automatic data lifecycle management, ensuring old data is automatically archived or deleted.
Advanced Indexing Strategies
Proper indexing dramatically reduces the amount of data ClickHouse needs to scan, which is critical for large datasets.
Primary Index Optimization:
ClickHouse uses a sparse index that stores minimum and maximum values of indexed columns for each data part. Order primary key columns by cardinality (lowest to highest) for optimal data skipping.
Data-Skipping Indexes:
Secondary indexes allow the system to skip data blocks during query processing. Available index types include:
- Min-max indexes
- Set indexes
- N-gram indexes
- Bloom filter indexes
Implementation Guidelines:
- Implement primary indexing based on columns most frequently used in filtering conditions
- Consider secondary indexes for high-cardinality columns not covered by the primary index
- Regularly review index effectiveness as query patterns evolve
Query Optimization Techniques
ChistaDATA consultants employ sophisticated query optimization techniques:
System Table Analysis:
SELECT query, elapsed, read_rows, exception
FROM system.query_log
WHERE type = 'QueryFinish'
ORDER BY elapsed DESC LIMIT 10;
This query identifies the slowest-running queries for optimization.
EXPLAIN Statement Usage:
EXPLAIN SYNTAX SELECT * FROM my_table WHERE column = 'value';
The EXPLAIN statement reveals query execution plans, showing whether indexes are being used effectively.
Data Type Optimization:
- Avoid Nullable columns when not necessary (adds processing overhead)
- Apply LowCardinality to String columns with fewer than 10,000 unique values
- Choose the smallest appropriate data type (UInt8 for small integers, Float32 for floats)
Merge Operations Management
Merges are critical background operations for MergeTree tables. Excessive or inefficient merges can degrade performance.
Monitoring Merges:
SELECT database, table, elapsed, progress FROM system.merges;
ChistaDATA experts tune merge parameters to optimize background operations, ensuring merges don’t consume excessive resources.
Parts and Partitions Inspection
Understanding data distribution across parts and partitions helps optimize storage and access patterns:
SELECT table, partition, name, rows, data_compressed_bytes
FROM system.parts
WHERE active
ORDER BY data_compressed_bytes DESC LIMIT 10;
Large numbers of small parts indicate suboptimal insert patterns, while oversized parts may suggest partitioning strategy issues.
Scalability Best Practices for ClickHouse
Horizontal Scaling with Sharding
A ClickHouse cluster is a distributed database system that synchronizes multiple server instances, enabling horizontal scalability by distributing storage and processing load across multiple nodes. This setup allows complex queries to be handled efficiently through distributed task execution.
Key Considerations:
- Use dedicated hosts for ClickHouse Keeper in production environments
- Keeper servers can be smaller (4GB RAM is generally sufficient until clusters grow large)
- Design sharding strategies that align with query access patterns
Replication for High Availability
Replication ensures data durability and enables failover capabilities. The ReplicatedMergeTree engine family provides automatic data synchronization across replicas, ensuring business continuity during node failures.
Distributed Query Execution
With distributed architecture, data is spread across different nodes, and queries are split and executed in parallel. This parallel execution allows ClickHouse to handle large-scale data analytics efficiently while minimizing data transfer between nodes.
MergeTree Engine Family Optimization
The MergeTree engine family is the core of ClickHouse data storage capabilities, providing columnar storage, custom partitioning, sparse primary indexes, and secondary data-skipping indexes. Selecting the appropriate engine variant (MergeTree, ReplacingMergeTree, AggregatingMergeTree) based on your use case is critical for optimal performance.
ClickHouse Performance & Scalability Recommendations Architecture
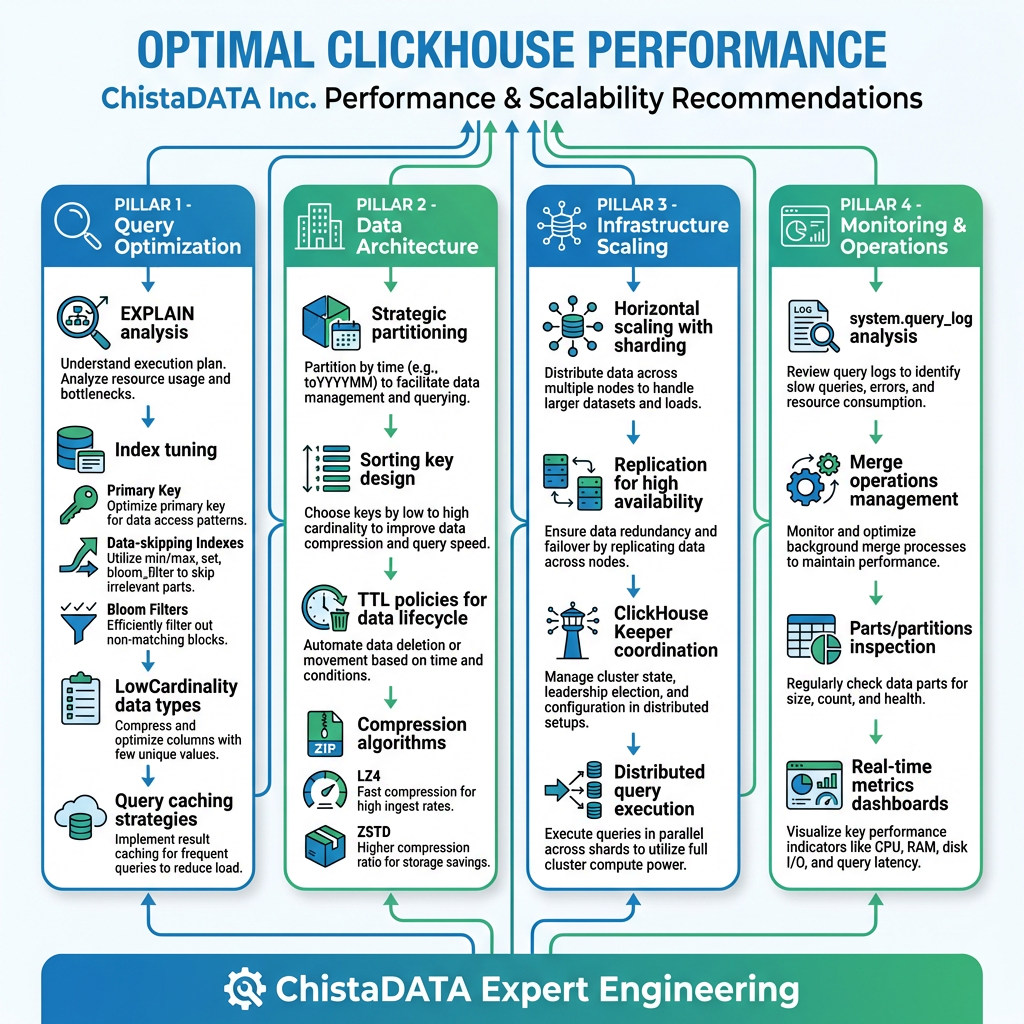
Figure 2: Four pillars of ClickHouse performance and scalability optimization by ChistaDATA
Why Choose ChistaDATA for ClickHouse Performance Engineering?
ChistaDATA offers a holistic approach to ClickHouse management, covering every stage of the database lifecycle—from initial deployment to ongoing optimization and long-term scalability planning. The service is built around three core pillars:
Operational Excellence
24×7 enterprise-class consultative support with rapid response times and proactive monitoring ensures your ClickHouse infrastructure operates at peak efficiency.
Performance Engineering
Expert query optimization, indexing strategies, and configuration tuning maximize throughput and minimize latency across all workloads.
Strategic Enablement
Long-term capacity planning, architecture design, and scalability roadmaps align your database infrastructure with business growth objectives.
ChistaDATA’s Unique Advantages:
- Elite-class consulting team with deep ClickHouse expertise
- Proprietary tools including ChistaDATA Anansi query profiler and Centralized Performance Monitoring
- Comprehensive managed services covering performance, scalability, and database SRE
- Unbiased guidance for installation, configuration, capacity planning, and sizing
Conclusion: Transform Your ClickHouse Performance Today
Achieving optimal ClickHouse performance requires expert engineering, continuous monitoring, and strategic optimization. ChistaDATA’s Ultra-Low-Level Performance Audit provides the comprehensive analysis and actionable recommendations needed to unlock your database’s full potential.
Whether you’re experiencing slow query performance, planning for scale, or seeking to optimize resource utilization, ChistaDATA’s team of ClickHouse experts is ready to help. With proven methodologies, advanced tooling, and 24×7 enterprise support, ChistaDATA is your trusted partner for building high-performance, scalable, and reliable ClickHouse analytics infrastructure.
Ready to optimize your ClickHouse deployment? Contact ChistaDATA Inc. today for a comprehensive performance engineering audit and discover how expert optimization can transform your analytical capabilities.
ChistaDATA Inc. — Enterprise-Class ClickHouse Consulting, Support, and Managed Services