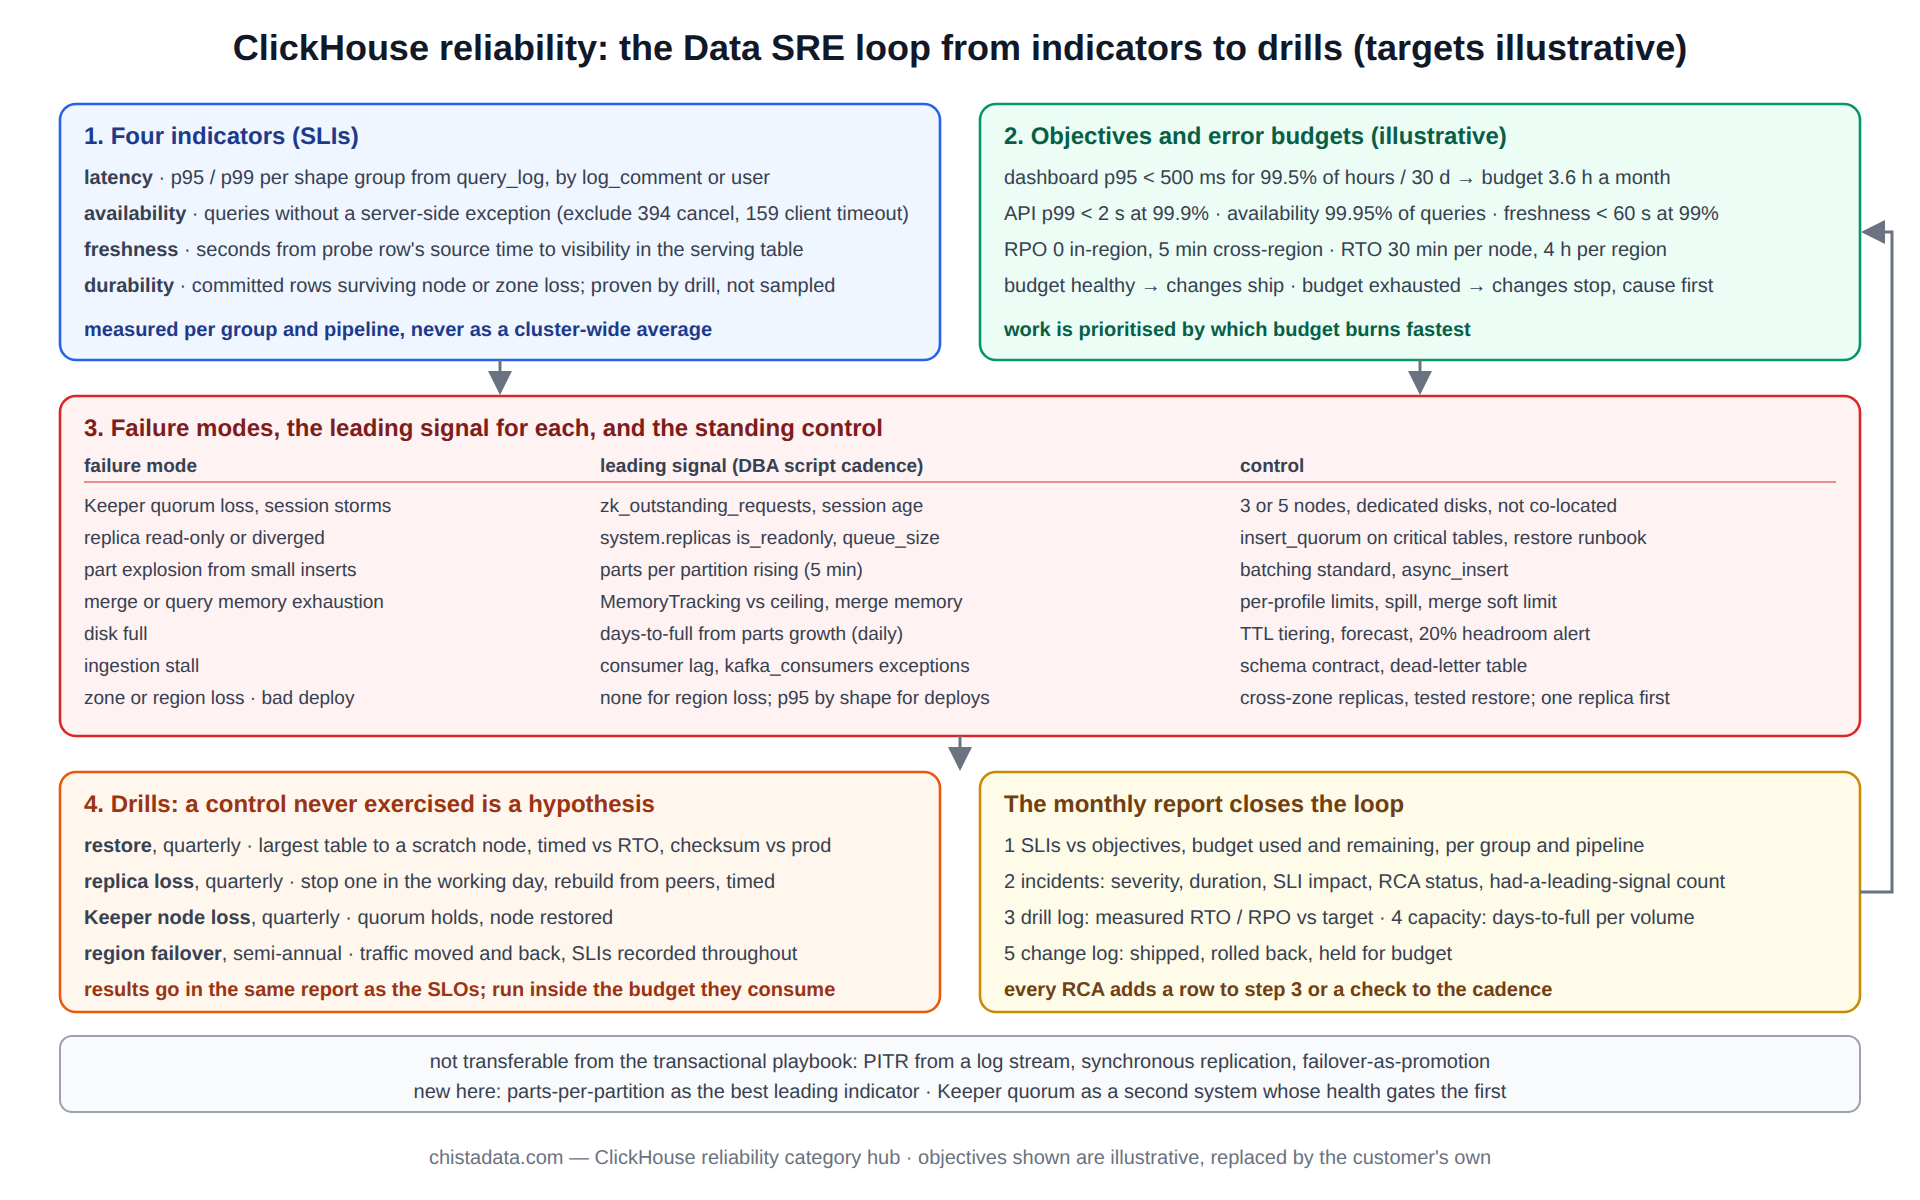
ClickHouse reliability is a set of promises with numbers attached: this query group answers within this latency this fraction of the time, this pipeline is no more than this many seconds behind, this cluster loses no more than this much data if a zone disappears, and a restore takes no longer than this.
Everything else on this page, the failure modes, the drills, the architecture choices, exists to keep those numbers true. The page is written as the Data SRE framework ChistaDATA applies to ClickHouse estates: service-level indicators and objectives first, the failure modes that threaten them second, the design and operating controls that defend them third, and the drills that prove the controls work last.
The posts in this category supply the detail: data reliability engineering on ClickHouse, the signed-SLO lakehouse engagement, the 26.8 LTS performance, scalability and HA notes, the upgrade guide, the thread-scheduling and CPU-efficiency posts, and the security vulnerability remediation post. This page is the framework they fit into.
Step 1: the four SLIs that define ClickHouse reliability
Four indicators cover what users of a ClickHouse system experience. Query latency per shape group, measured as p95 or p99 from system.query_log for the shapes that matter (dashboards, API, batch), not as a cluster-wide average that hides the slow group inside the fast one. Query availability, the fraction of queries that complete without an exception the client did not cause, from the same log.
Freshness, the lag between an event’s source timestamp and its visibility in the serving table, measured by a probe row or by the Kafka consumer lag translated into seconds. And durability, the fraction of committed rows that survive a node loss, which is not measured continuously but proven by the drill in step 4.
-- SLI 1 and 2 for one shape group, hourly, from query_log
-- shape groups are identified by the client's log_comment setting or by user
SELECT
    toStartOfHour(event_time)                                    AS hour,
    quantile(0.95)(query_duration_ms)                            AS p95_ms,
    quantile(0.99)(query_duration_ms)                            AS p99_ms,
    countIf(type = 'QueryFinish')                                AS ok,
    countIf(type = 'ExceptionWhileProcessing'
            AND exception_code NOT IN (394, 159))                AS failed,   -- exclude client cancel, client timeout
    round(ok / greatest(ok + failed, 1) * 100, 3)                AS availability_pct
FROM system.query_log
WHERE log_comment = 'group:dashboard'
  AND type IN ('QueryFinish', 'ExceptionWhileProcessing')
  AND event_time > now() - INTERVAL 7 DAY
GROUP BY hour
ORDER BY hour;
The exclusions matter, and they are the first thing a ClickHouse reliability review checks in an existing SLI definition. A query the client cancelled (code 394) or that hit its own max_execution_time (code 159) is not an availability failure of the database; counting it would let a badly written dashboard burn the error budget for everyone.
Measuring freshness: the ClickHouse reliability SLI that needs a probe
Latency and availability fall out of system.query_log; freshness does not, because ClickHouse does not know when an event happened upstream. The reliable method is a probe: the producer writes one marker row per pipeline per minute with its own wall-clock timestamp, and a scheduled query on the serving table measures the gap between that timestamp and now() at the moment the row becomes visible. For Kafka-fed tables, consumer lag in messages converts to seconds only if the message rate is known, so the probe row is the measurement of record and the consumer lag is the leading signal.
-- freshness SLI: seconds between the newest probe's source time and now, per pipeline
SELECT
    pipeline,
    max(source_ts)                          AS newest_probe,
    dateDiff('second', max(source_ts), now()) AS lag_s
FROM serving.events
WHERE event_type = 'probe'
  AND event_date >= today() - 1
GROUP BY pipeline
ORDER BY lag_s DESC;
-- objective (illustrative): lag_s under 60 for 99% of one-minute samples in a 30-day window
A freshness breach with a healthy consumer usually means the materialized view behind the Kafka engine is failing on a subset of messages; system.query_views_log and system.kafka_consumers confirm it, as the troubleshooting hub describes. A breach with a lagging consumer is capacity or a stalled merge pool, and the ClickHouse reliability response is to slow the producer before the parts count becomes an availability incident too.
Step 2: ClickHouse reliability objectives and error budgets
An objective is an SLI with a target and a window. Illustrative targets from engagements, replaced by the customer’s own in every case: dashboard shapes p95 under 500 ms for 99.5 percent of hours in a 30-day window; API shapes p99 under 2 s at 99.9 percent; freshness under 60 s at 99 percent; availability 99.95 percent of queries per month; durability RPO of zero within a region and 5 minutes across regions, RTO of 30 minutes for a single node and 4 hours for a region.
The error budget is the complement: at 99.5 percent over 30 days a dashboard group may miss its latency target for 3.6 hours a month, and ClickHouse reliability work is prioritised by which budget is burning fastest.
Budgets change behaviour in two ways. When a budget is healthy, changes ship: the upgrade, the sort-key rebuild, the new ingestion pipeline. When a budget is exhausted, changes stop until the cause is fixed, and the on-call conversation shifts from “is it down” to “are we inside the objective”. The signed-SLO lakehouse post describes a customer engagement in which the objectives were contractual, and the data reliability engineering post sets out the framework in full.
Step 3: the failure modes that threaten ClickHouse reliability
| Failure mode | SLI hit | Leading signal | Control |
|---|---|---|---|
| Keeper quorum loss or session storms | availability, freshness | zk_outstanding_requests, session age in system.zookeeper_connection | 3 or 5 Keeper nodes, dedicated disks, not co-located |
| Replica divergence or read-only | availability | system.replicas is_readonly, queue_size | insert_quorum on critical tables, restore-replica runbook |
| Part explosion from small inserts | latency, then availability | parts per partition rising | batching standard, async_insert, five-minute check |
| Merge or query memory exhaustion | availability | MemoryTracking vs ceiling, merge memory | per-profile limits, spill settings, merge soft limit |
| Disk full | availability, durability | days-to-full from growth trend | TTL tiering, capacity forecast, 20% headroom alert |
| Ingestion pipeline stall | freshness | consumer lag, kafka_consumers exceptions | schema contract, dead-letter table, lag alert |
| Zone or region loss | all four | none; only the drill proves readiness | cross-zone replicas, cross-region replication, tested restore |
| Bad deploy (schema, settings, upgrade) | latency, availability | p95 by shape after the change | one replica first, baseline comparison, rollback |
The table is the working document of ClickHouse reliability: it is reviewed after every incident and grows with the estate.
Every row’s leading signal is a check the DBA script hub runs at a fixed cadence, and every control is a standing rule rather than a one-time fix. The two rows without a continuous signal, region loss and durability, are the reason step 4 exists.
Step 4: the drills that prove ClickHouse reliability rather than assert it
A control that has never been exercised is a hypothesis. The drill programme has four exercises, each with a written expected outcome and a measured actual one. Restore drill, quarterly: a full restore of the largest table from the most recent backup onto a scratch node, timed against the RTO, with row count and a checksum compared against production.
Replica-loss drill, quarterly: one replica is stopped during the working day, the load balancer is observed to route around it, and the replica is rebuilt from its peers with SYSTEM RESTORE REPLICA or a fresh fetch, timed. Keeper-node-loss drill, quarterly: one Keeper node is stopped, quorum is confirmed to hold, and it is restored. Failover drill, semi-annually for multi-region estates: traffic is moved to the secondary region and back, with freshness and availability SLIs recorded throughout.
-- restore drill verification: production vs restored copy
-- run on production
SELECT count() AS rows, sum(cityHash64(*)) AS checksum
FROM db.big_table
WHERE event_date = '2026-09-01';
-- run on the scratch node after RESTORE
SELECT count() AS rows, sum(cityHash64(*)) AS checksum
FROM db.big_table
WHERE event_date = '2026-09-01';
-- both numbers equal, and elapsed restore time recorded against the RTO
Each drill is scheduled with the customer, announced to the teams whose SLIs it may touch, and run inside the error budget it consumes; a drill that would exhaust a budget is postponed, which is itself a finding about how thin the margin is.
Drill results go into the same report as the SLO numbers, because a restore that took three hours against a 30-minute RTO is a reliability gap of the same kind as a latency breach, only invisible until the day it matters. The upgrade guide treats the rolling upgrade as a drill of the same discipline: one replica, verify, next.
Architecture choices that raise ClickHouse reliability
Three choices carry most of the weight. Replication topology: at least two replicas per shard across availability zones, with ReplicatedMergeTree on every table that matters and insert_quorum = 2 on the ones whose durability objective is zero RPO.
Keeper topology: three nodes minimum, five for large estates, on dedicated hosts or at least dedicated disks, never co-located with a busy ClickHouse server. And storage policy: tiered volumes with TTL moves so that a disk-full event on the hot tier is a capacity S4 six weeks out rather than an S1 tonight, and object storage as the cold tier so that the durability of the archive is the object store’s, not a single disk’s.
<!-- config.xml fragment: Keeper hosts and a tiered storage policy, illustrative -->
<zookeeper>
    <node><host>keeper-1.internal</host><port>9181</port></node>
    <node><host>keeper-2.internal</host><port>9181</port></node>
    <node><host>keeper-3.internal</host><port>9181</port></node>
    <session_timeout_ms>30000</session_timeout_ms>
</zookeeper>

<storage_configuration>
    <disks>
        <hot><path>/var/lib/clickhouse/hot/</path></hot>
        <cold>
            <type>s3</type>
            <endpoint>https://s3.${AWS_REGION}.amazonaws.com/${CH_BUCKET}/cold/</endpoint>
            <access_key_id>${AWS_ACCESS_KEY_ID}</access_key_id>
            <secret_access_key>${AWS_SECRET_ACCESS_KEY}</secret_access_key>
        </cold>
    </disks>
    <policies>
        <tiered>
            <volumes>
                <hot><disk>hot</disk></hot>
                <cold><disk>cold</disk></cold>
            </volumes>
            <move_factor>0.2</move_factor>
        </tiered>
    </policies>
</storage_configuration>
The 26.8 LTS performance, scalability and HA post covers the current release’s specifics for each, and the replication and sharding archives have the design detail.
Operating controls: the rules that keep the budget
Change control is the biggest. Every production change is staged on one replica with the affected SLIs compared against a baseline before it reaches the rest, and every change has a rollback that has itself been rehearsed; a rollback that has never been run is another hypothesis.
Capacity control: the growth trend from system.parts is fitted monthly and the days-to-full figure per volume is on the reliability report, with an alert at 20 percent free that leaves time to act.
Access control: named accounts, minimum grants, an emergency role that expires, and system.session_log as the audit trail, as the vulnerability remediation post describes for the security side of ClickHouse reliability. And observability control: every alert names its runbook step, every runbook step names its verification query, and the alert set is reviewed quarterly against the incidents that happened, so that each incident either had a leading signal or gets one.
The ClickHouse reliability report: one page, monthly
The framework produces one document a month, and its shape is fixed so that trends are visible across months. Section one is the four SLIs against their objectives for each shape group and pipeline, with the budget consumed and the budget remaining. Section two is the incident list for the month with severity, duration, SLI impact and RCA status, and the count of incidents that had a leading signal versus the count that did not.
Section three is the drill log: which drills ran, the measured RTO and RPO against the targets, and any gap. Section four is capacity: days-to-full per volume, growth against forecast, and the date the next hardware or tier decision is due. Section five is the change log: what shipped, what was rolled back, and which changes were held because a budget was exhausted.
The report is the artefact that makes ClickHouse reliability a conversation between engineering and the business rather than between engineers. A budget that is consistently unused argues for shipping faster or tightening the objective; one that is consistently exhausted argues for investment, and the report shows where. In managed-service engagements the report is reviewed with the customer monthly and its objectives are re-signed annually.
Incident review under a ClickHouse reliability error budget
Every S1 and every recurring S2 gets a root-cause analysis within five business days, and under this framework the RCA carries two extra lines: how much budget the incident consumed, and whether a leading signal existed. An incident that consumed a third of the monthly budget and had no leading signal is the highest-priority reliability work in the estate, ahead of any feature, because it will recur and the next one will not be seen coming either.
The action from such an RCA is a new check on the DBA script cadence or a new alert, and the check is added to the failure-mode table above so that the framework grows with the estate’s history rather than staying at the shape it had on day one.
Where ClickHouse reliability engineering differs from the transactional playbook
Engineers bringing PostgreSQL or MySQL SRE practice to ClickHouse find that three familiar controls do not transfer and two new ones appear. There is no point-in-time recovery from a log stream; recovery is a backup snapshot plus the parts written since, which is why backup frequency is set from the RPO directly.
There is no synchronous replication in the streaming sense; insert_quorum is the equivalent, per insert, and it costs latency, so it is applied to the tables whose objective needs it rather than globally. Failover is not a promotion; every replica is already writable, and the “failover” is the load balancer’s route table plus Keeper’s view of which replicas are healthy.
The two new controls are the parts-per-partition check, which has no transactional analogue and predicts more incidents than any other single number, and the Keeper quorum, which is a second distributed system whose health is a precondition for the first.
Version notes
log_comment as a per-query setting is 21.x and later. system.session_log is 22.x and later. Native BACKUP/RESTORE is 22.x and later, with incremental backups from 22.x and object-storage targets throughout. SYSTEM RESTORE REPLICA is 21.x and later. ClickHouse Keeper is production-ready from 22.x and the recommended coordinator since. The official replication and fault-tolerance documentation is the reference for the topology guidance above; confirm every setting on the running version.
Reading the archive
The archive reads best in the order of the framework: indicators and objectives, then failure modes, then controls, then drills. A post that describes a single control (thread scheduling, CPU efficiency, a security remediation) makes more sense once the objective it protects is clear, which is why the framework posts come first.
Begin with the data reliability engineering post for the framework and the signed-SLO post for what it looks like under contract. The 26.8 LTS HA post and the upgrade guide cover the architecture and change-control sides; the thread-scheduling and CPU-efficiency posts are the latency-SLI detail; the vulnerability remediation post is the security control.
ChistaDATA’s managed services operate ClickHouse estates against exactly this framework, with the SLO report, the drill calendar and the change-control rules as the standing deliverables, and consulting engagements establish it for teams who run their own. Every control on this page is introduced on staging first, every drill is scheduled with the customer, and no objective is signed before its restore has been timed.