Most ClickHouse performance IO problems are misdiagnosed as CPU problems, because the symptom is a query that runs slowly while top shows the cores busy. The cores are busy waiting. ClickHouse reads compressed column granules through a thread pool, decompresses them, and only then filters; when the storage layer cannot feed that pool, threads spin on page-cache misses, prefetch queues and merge contention rather than on useful work.
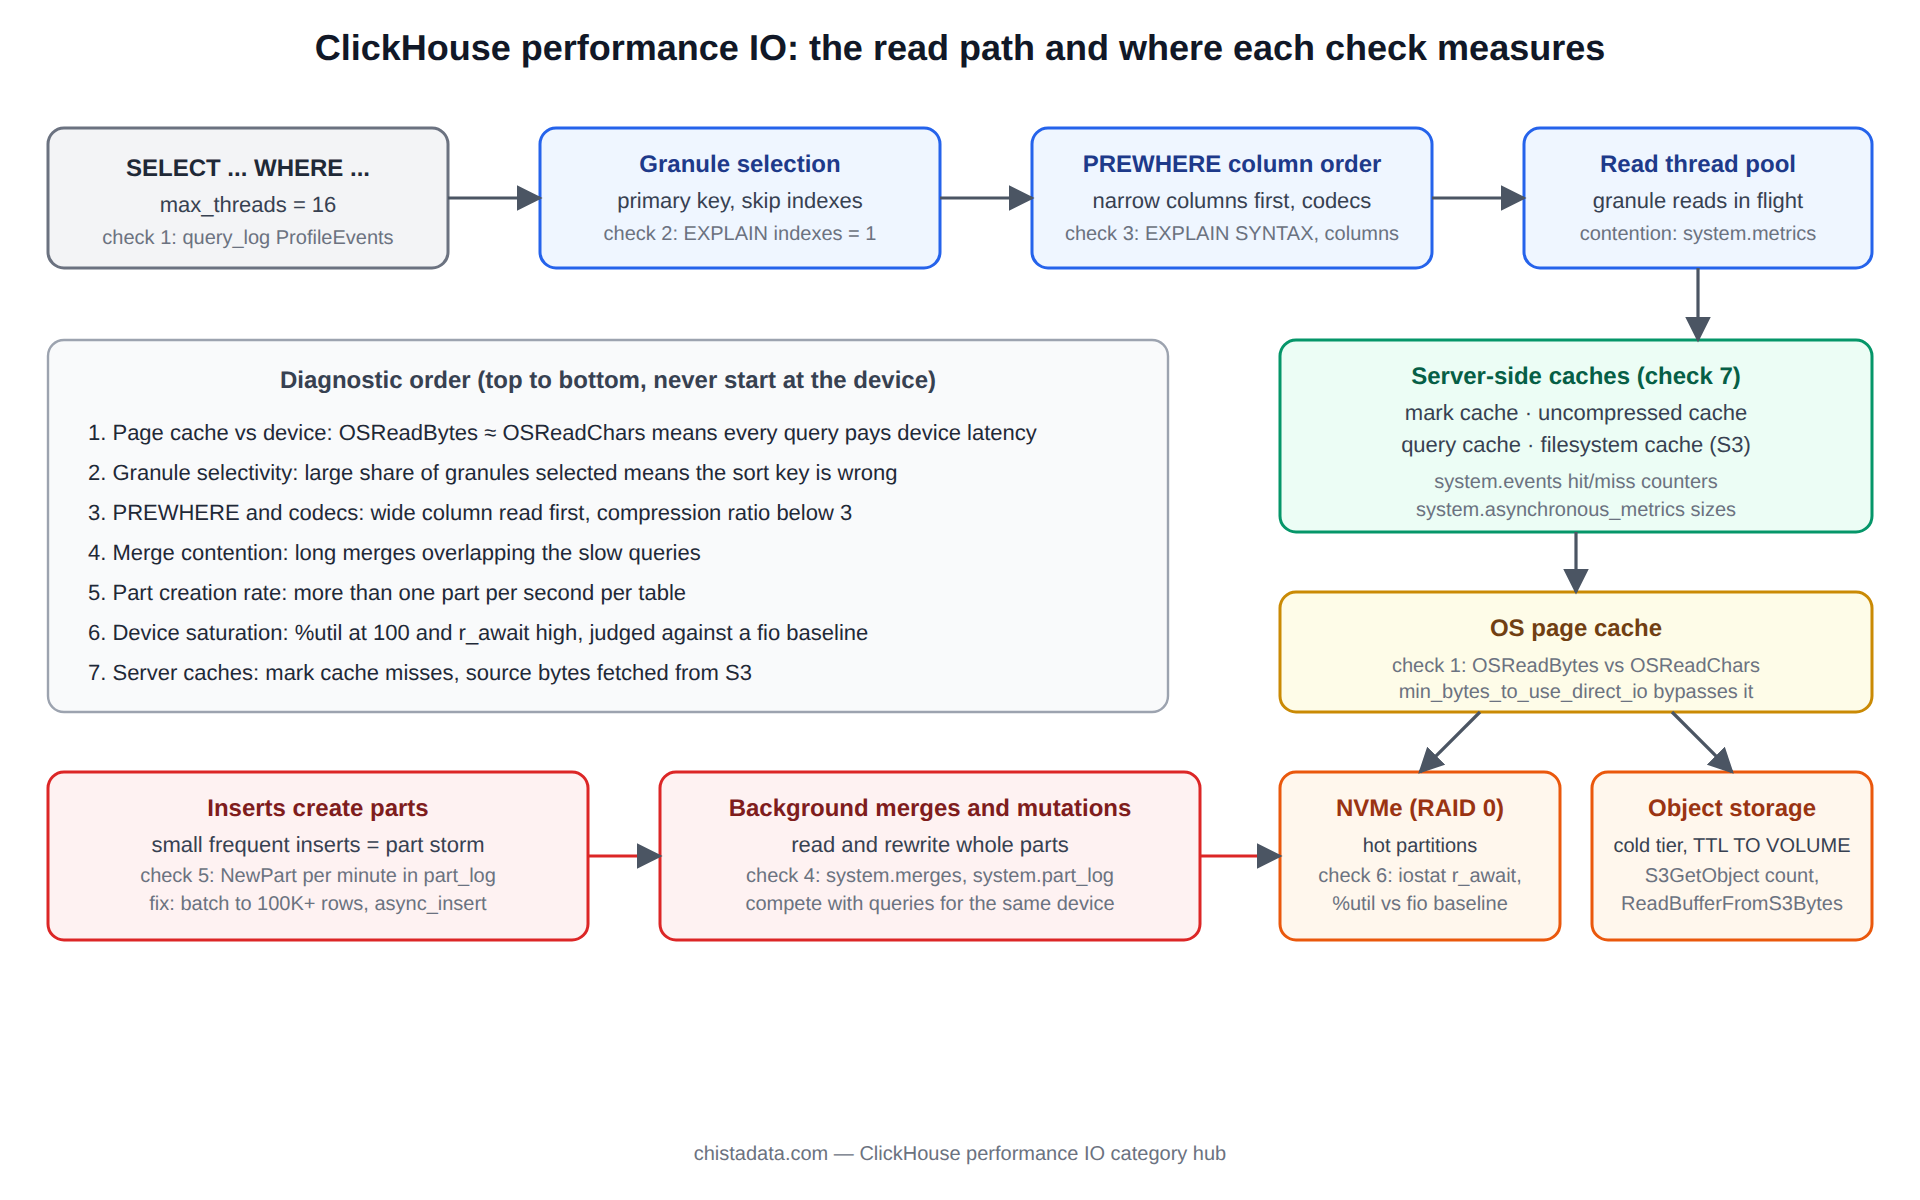
This page is the diagnostic order we follow on a slow cluster: seven checks, each anchored to a specific system table or OS counter, each with the reading that means “this is your bottleneck” and the change that fixes it.
The archive under this category holds the deeper treatments: query-log mining, merge and mutation behaviour, ingestion tuning, IOPS troubleshooting, LowCardinality, PREWHERE, and schema design for billion-row tables. This page is the checklist that decides which of them you need to read.
Check one: is the ClickHouse performance IO cost paid from disk or from page cache
The first question in any ClickHouse performance IO investigation is whether the bytes came from RAM or from the device. system.query_log exposes both through ProfileEvents. OSReadBytes is what the kernel actually fetched from storage; OSReadChars is what ClickHouse asked for. When the two are close, the page cache is not helping and every query is paying device latency.
SELECT
    query_id,
    query_duration_ms,
    read_rows,
    formatReadableSize(read_bytes)                                  AS read_bytes,
    formatReadableSize(ProfileEvents['OSReadChars'])                AS requested,
    formatReadableSize(ProfileEvents['OSReadBytes'])                AS from_device,
    round(ProfileEvents['OSReadBytes'] / ProfileEvents['OSReadChars'], 2) AS device_ratio,
    ProfileEvents['OSIOWaitMicroseconds'] / 1000                    AS io_wait_ms
FROM system.query_log
WHERE event_date = today()
  AND type = 'QueryFinish'
  AND query_kind = 'Select'
ORDER BY query_duration_ms DESC
LIMIT 20;
A device_ratio near 1.0 on a query that runs repeatedly means the working set does not fit in the page cache, which is a sizing problem before it is a tuning problem. The fixes, in order of cost, are: narrow the columns the query reads, tighten the ORDER BY so fewer granules are touched, and only then add memory. The archive post ClickHouse query log performance mining builds a full workload profile from the same table.
Check two: granule selectivity, the cheapest ClickHouse performance IO win
ClickHouse reads whole granules, 8,192 rows by default, and skips them only when the primary key or a skip index proves the granule cannot match. A query that touches 100 million rows to return 10 thousand is not slow because of disk speed; it is slow because the sort key does not match the filter. EXPLAIN indexes = 1 shows how many granules survived each index.
EXPLAIN indexes = 1
SELECT count()
FROM events
WHERE tenant_id = 4711
  AND event_time >= now() - INTERVAL 1 DAY
  AND event_type = 'purchase';

-- Look for lines like:
--   PrimaryKey  Parts: 12/40  Granules: 310/48200
--   Skip  Name: idx_type  Type: set  Parts: 12/12  Granules: 44/310
When Granules after the primary key is a large fraction of the total, the sort key is wrong for this query. The archive’s Designing ClickHouse schemas for one-billion-row tables and ClickHouse MergeTree optimization cover sort-key design; a projection with an alternate order is the fix when the table must serve two access patterns. Skip indexes help only when the filtered column is correlated with the sort order; a bloom_filter on a random UUID in a time-sorted table reads almost every granule anyway.
Check three: PREWHERE and column read order
ClickHouse moves cheap filter conditions into PREWHERE automatically, so it reads the small filter columns first and fetches the wide payload columns only for granules that pass. The optimiser’s choice is visible in EXPLAIN SYNTAX, and it is sometimes wrong: a condition on a heavily compressed LowCardinality column should almost always run first, and one on a String payload last. The archive post PREWHERE vs WHERE in ClickHouse queries measures the difference; on wide tables it is routinely a five to ten times reduction in bytes read.
SELECT
    name,
    type,
    formatReadableSize(data_compressed_bytes)   AS compressed,
    formatReadableSize(data_uncompressed_bytes) AS uncompressed,
    round(data_uncompressed_bytes / data_compressed_bytes, 1) AS ratio
FROM system.columns
WHERE database = 'analytics' AND table = 'events'
ORDER BY data_compressed_bytes DESC;
That query is the compression map of the table. Columns with a ratio below three are candidates for a better codec, Delta or DoubleDelta for monotonic integers and timestamps, Gorilla for floats, ZSTD(3) instead of LZ4 on cold partitions. Better compression is fewer bytes from the device per row, which is the most direct ClickHouse performance IO lever there is.
Check four: ClickHouse performance IO stolen by merges and mutations
Background merges rewrite parts, and a merge of two multi-gigabyte parts reads and writes both in full. On a busy cluster merges are frequently the largest consumer of device bandwidth, and a query that was fast at 09:00 is slow at 09:05 because a large merge started. system.merges shows what is running; system.part_log shows the history.
SELECT
    database, table,
    round(elapsed)                              AS elapsed_s,
    round(progress * 100, 1)                    AS pct,
    num_parts,
    formatReadableSize(total_size_bytes_compressed) AS input,
    formatReadableSize(bytes_read_uncompressed)     AS read_so_far,
    formatReadableSize(bytes_written_uncompressed)  AS written_so_far,
    is_mutation
FROM system.merges
ORDER BY elapsed DESC;

SELECT
    toStartOfHour(event_time)                    AS hour,
    countIf(event_type = 'MergeParts')           AS merges,
    formatReadableSize(sumIf(bytes_uncompressed, event_type = 'MergeParts')) AS merged_bytes,
    countIf(event_type = 'MutatePart')           AS mutations
FROM system.part_log
WHERE event_date = today()
GROUP BY hour
ORDER BY hour;
Two knobs govern the pressure. background_merges_mutations_concurrency_ratio and background_pool_size bound how many merges run at once, and max_bytes_to_merge_at_max_space_in_disk bounds how large a single merge can be. Mutations are worse than merges because a ALTER ... UPDATE rewrites every part that contains matching rows. The archive’s ClickHouse merge and mutation performance and Monitoring merge queues in ClickHouse go into scheduling; lightweight deletes, since 23.x, and lightweight updates, since 25.x, exist precisely to avoid the rewrite.
Check five: insert shape and part creation rate
Every insert creates at least one part per partition it touches. Small, frequent inserts create thousands of small parts, and each part costs an open file per column, a mark file read, and a future merge. The reading that identifies this is the active part count per partition and the parts created per minute in system.part_log.
SELECT
    toStartOfMinute(event_time) AS minute,
    table,
    countIf(event_type = 'NewPart') AS parts_created,
    round(avgIf(rows, event_type = 'NewPart')) AS avg_rows_per_part
FROM system.part_log
WHERE event_time >= now() - INTERVAL 1 HOUR
GROUP BY minute, table
HAVING parts_created > 60
ORDER BY parts_created DESC;
More than about one part per second per table is the threshold where merges stop keeping up on ordinary hardware. The fix is on the client side, batching to 100 thousand rows or more, or server side with async_insert = 1, which buffers small inserts into one part. The archive post ClickHouse ingestion performance measures both, and ClickHouse IOPS troubleshooting shows what a part storm looks like in iostat.
Check six: ClickHouse performance IO at the device, measured at the OS
ClickHouse’s own counters say how much it read; the OS says whether the device could deliver it. iostat -x 1 gives the two numbers that matter: %util near 100 on a single device means the queue is always non-empty, and r_await is the latency a read actually waited. For NVMe, sustained r_await above a few milliseconds indicates saturation; for network-attached volumes, above twenty.
iostat -xm 1 5 | awk '/^nvme|^md|^sd/ {print $1, "r/s="$2, "rMB/s="$3, "r_await="$6, "aqu-sz="$(NF-2), "util="$NF}'

# Baseline the device once, outside business hours, on a scratch file:
fio --name=chread --filename=/var/lib/clickhouse/fio.test --size=20G \
    --rw=randread --bs=1M --iodepth=32 --numjobs=4 --direct=1 \
    --runtime=60 --time_based --group_reporting
rm -f /var/lib/clickhouse/fio.test
A fio baseline is what turns an iostat reading into a verdict. If the device delivers 3 GB/s in the baseline and ClickHouse queries see 400 MB/s with %util at 100, something else is holding the device, usually merges, a backup, or a neighbouring tenant on shared storage. If the baseline itself is 400 MB/s, the hardware is the limit and the choices are more devices in RAID 0, a tier of NVMe in front of object storage, or fewer bytes per query through the checks above. The baremetal ClickHouse sizing page covers the hardware side.
Check seven: the caches ClickHouse manages itself
Three server-side caches sit above the page cache. The mark cache holds the index of where each granule starts in each column file; a miss costs a small read per column per part and shows up as MarkCacheMisses. The uncompressed cache holds decompressed blocks and is off by default because it only helps repeated point reads. The query cache, since 23.x, stores full result sets for identical queries. Their hit rates are in system.asynchronous_metrics and system.events.
SELECT metric, value
FROM system.asynchronous_metrics
WHERE metric IN ('MarkCacheBytes', 'MarkCacheFiles',
                 'UncompressedCacheBytes', 'QueryCacheBytes',
                 'OSMemoryAvailable', 'FilesystemCacheBytes');

SELECT event, value
FROM system.events
WHERE event IN ('MarkCacheHits', 'MarkCacheMisses',
                'UncompressedCacheHits', 'UncompressedCacheMisses',
                'QueryCacheHits', 'QueryCacheMisses',
                'CachedReadBufferReadFromCacheBytes', 'CachedReadBufferReadFromSourceBytes');
On object-storage-backed tables the filesystem cache is the one that decides everything: CachedReadBufferReadFromSourceBytes is the bytes fetched from S3, and every one of them costs both latency and money. Size the local cache to the hot working set, pin it with cache_on_write_operations for freshly inserted data, and treat a rising source-bytes counter as the same emergency as a saturated NVMe.
Thread contention that looks like a ClickHouse performance IO problem
One class of slowness is neither device nor cache: too many concurrent queries each asking for max_threads equal to the core count, so the scheduler time-slices between them and every query waits on every other. The reading is system.metrics Query and GlobalThreadActive against the core count, and system.query_log showing wall time far above ProfileEvents['UserTimeMicroseconds'] plus SystemTimeMicroseconds.
The fix is workload isolation: per-profile max_threads for dashboards versus batch jobs, max_concurrent_queries_for_user, and since 24.x the workload scheduler with CREATE WORKLOAD and resource limits per class. The archive post ClickHouse thread contention and troubleshooting works through the symptoms, and Designing ClickHouse for mixed workloads covers the isolation design.
Object storage changes the ClickHouse performance IO model
On S3-backed or tiered tables the device is a network, and the numbers above change scale. A granule read that costs 100 microseconds on NVMe costs 20 to 80 milliseconds as a GET request, so the thread pool that hides latency on local disk becomes the tool that hides it on object storage: max_threads and remote_filesystem_read_prefetch work together to keep many requests in flight. The filesystem cache is not optional there; it is the difference between a warm dashboard at 200 milliseconds and a cold one at 20 seconds.
The measurements are the same tables with different columns. ProfileEvents['S3GetObject'] and ProfileEvents['ReadBufferFromS3Bytes'] per query in system.query_log tell you request count and bytes, which map directly to the cloud bill. system.filesystem_cache shows what is resident. A cluster that tiers cold partitions to S3 with a TTL TO VOLUME rule should be checked for queries that unexpectedly cross the tier boundary; a dashboard that asks for 30 days when the hot tier holds 14 reads half its data over the network on every refresh.
SELECT
    query_id,
    query_duration_ms,
    ProfileEvents['S3GetObject']                              AS s3_gets,
    formatReadableSize(ProfileEvents['ReadBufferFromS3Bytes']) AS s3_bytes,
    formatReadableSize(ProfileEvents['CachedReadBufferReadFromCacheBytes']) AS cache_bytes
FROM system.query_log
WHERE event_date = today()
  AND type = 'QueryFinish'
  AND ProfileEvents['S3GetObject'] > 0
ORDER BY s3_gets DESC
LIMIT 20;
The time-series analytics at scale post in this archive shows a tiered layout with the hot window sized to the dashboard range, which is the design that keeps object-storage reads out of the interactive path.
Putting the ClickHouse performance IO checks in order
Run them top to bottom. Checks one and two find the query-side problems, which are fixable with DDL and cost nothing in hardware. Check three reduces bytes per row. Checks four and five find the write-side problems that steal bandwidth from reads.
Check six proves whether the device is actually the limit. Check seven covers the caches that make the difference between a cold and a warm cluster. Skipping to check six first, which is the instinct when a graph shows disk at 100 percent, leads to buying hardware to serve a query that reads 200 times more granules than it needs to.
| Check | Source of truth | Reading that confirms it | First fix |
|---|---|---|---|
| 1. Page cache vs device | system.query_log ProfileEvents | OSReadBytes close to OSReadChars | Read fewer columns, then more RAM |
| 2. Granule selectivity | EXPLAIN indexes = 1 | Granules selected is a large share of total | Sort key, projection, skip index |
| 3. PREWHERE and codecs | EXPLAIN SYNTAX, system.columns | Wide column read before selective one; ratio below 3 | Explicit PREWHERE, better codec |
| 4. Merge contention | system.merges, system.part_log | Long merges overlapping slow queries | Pool sizing, avoid mutations |
| 5. Part creation rate | system.part_log | More than one part per second per table | Batch inserts, async_insert |
| 6. Device saturation | iostat, fio baseline | %util at 100, r_await high | Find the competing writer, then hardware |
| 7. Server caches | system.events, asynchronous_metrics | Miss rates, source bytes from S3 | Mark cache size, filesystem cache size |
Settings that change ClickHouse performance IO behaviour
A short list, each with the reason it exists. max_threads sets query parallelism and therefore the number of concurrent granule reads; more threads help on NVMe and hurt on a saturated network volume. local_filesystem_read_method chooses between pread, mmap, io_uring and pread_threadpool; the thread-pool default is right for most hardware, and io_uring is worth a measured trial on recent kernels. min_bytes_to_use_direct_io bypasses the page cache for large reads so that a scan of a cold partition does not evict the hot working set. merge_tree_min_rows_for_concurrent_read and merge_tree_max_rows_to_use_cache control how reads are split and cached.
-- Current vs proposed, applied per profile, no restart required
SELECT name, value, changed, description
FROM system.settings
WHERE name IN ('max_threads', 'local_filesystem_read_method',
               'min_bytes_to_use_direct_io', 'merge_tree_min_rows_for_concurrent_read',
               'use_uncompressed_cache', 'use_query_cache', 'async_insert');
Every one of these is a per-query or per-profile setting that can be tested on a single session with SETTINGS before it goes into a profile, which is how we validate changes on client clusters: same query, same data, two settings, system.query_log as the judge. The reference for the full list is the ClickHouse settings documentation; confirm the exact server version, because io_uring support, lightweight updates and the query cache each landed in a specific release.
Reading the archive
For a cluster that is slow today, read ClickHouse IOPS troubleshooting and ClickHouse performance observability and monitoring first. For a schema being designed, read the billion-row schema post and the complete guide to LowCardinality. For the mistakes list, ClickHouse performance mistakes and ClickHouse performance pitfalls are the two we send to every new client.
Two habits make the archive more useful. Keep a weekly snapshot of the compression map and the part-creation rate per table, so that a regression has a before-and-after. And record the fio baseline of every node at commissioning time, because the first question in a saturation incident is whether the device got slower or the workload got heavier, and only the baseline can answer it.
ChistaDATA’s ClickHouse consulting practice runs this seven-check sequence as a fixed-scope performance audit with a written findings report, and 24×7 ClickHouse support handles the incidents in between. Test every setting and schema change on a staging cluster with a replayed production workload before it reaches production, and keep a verified backup and restore path for every table you alter.