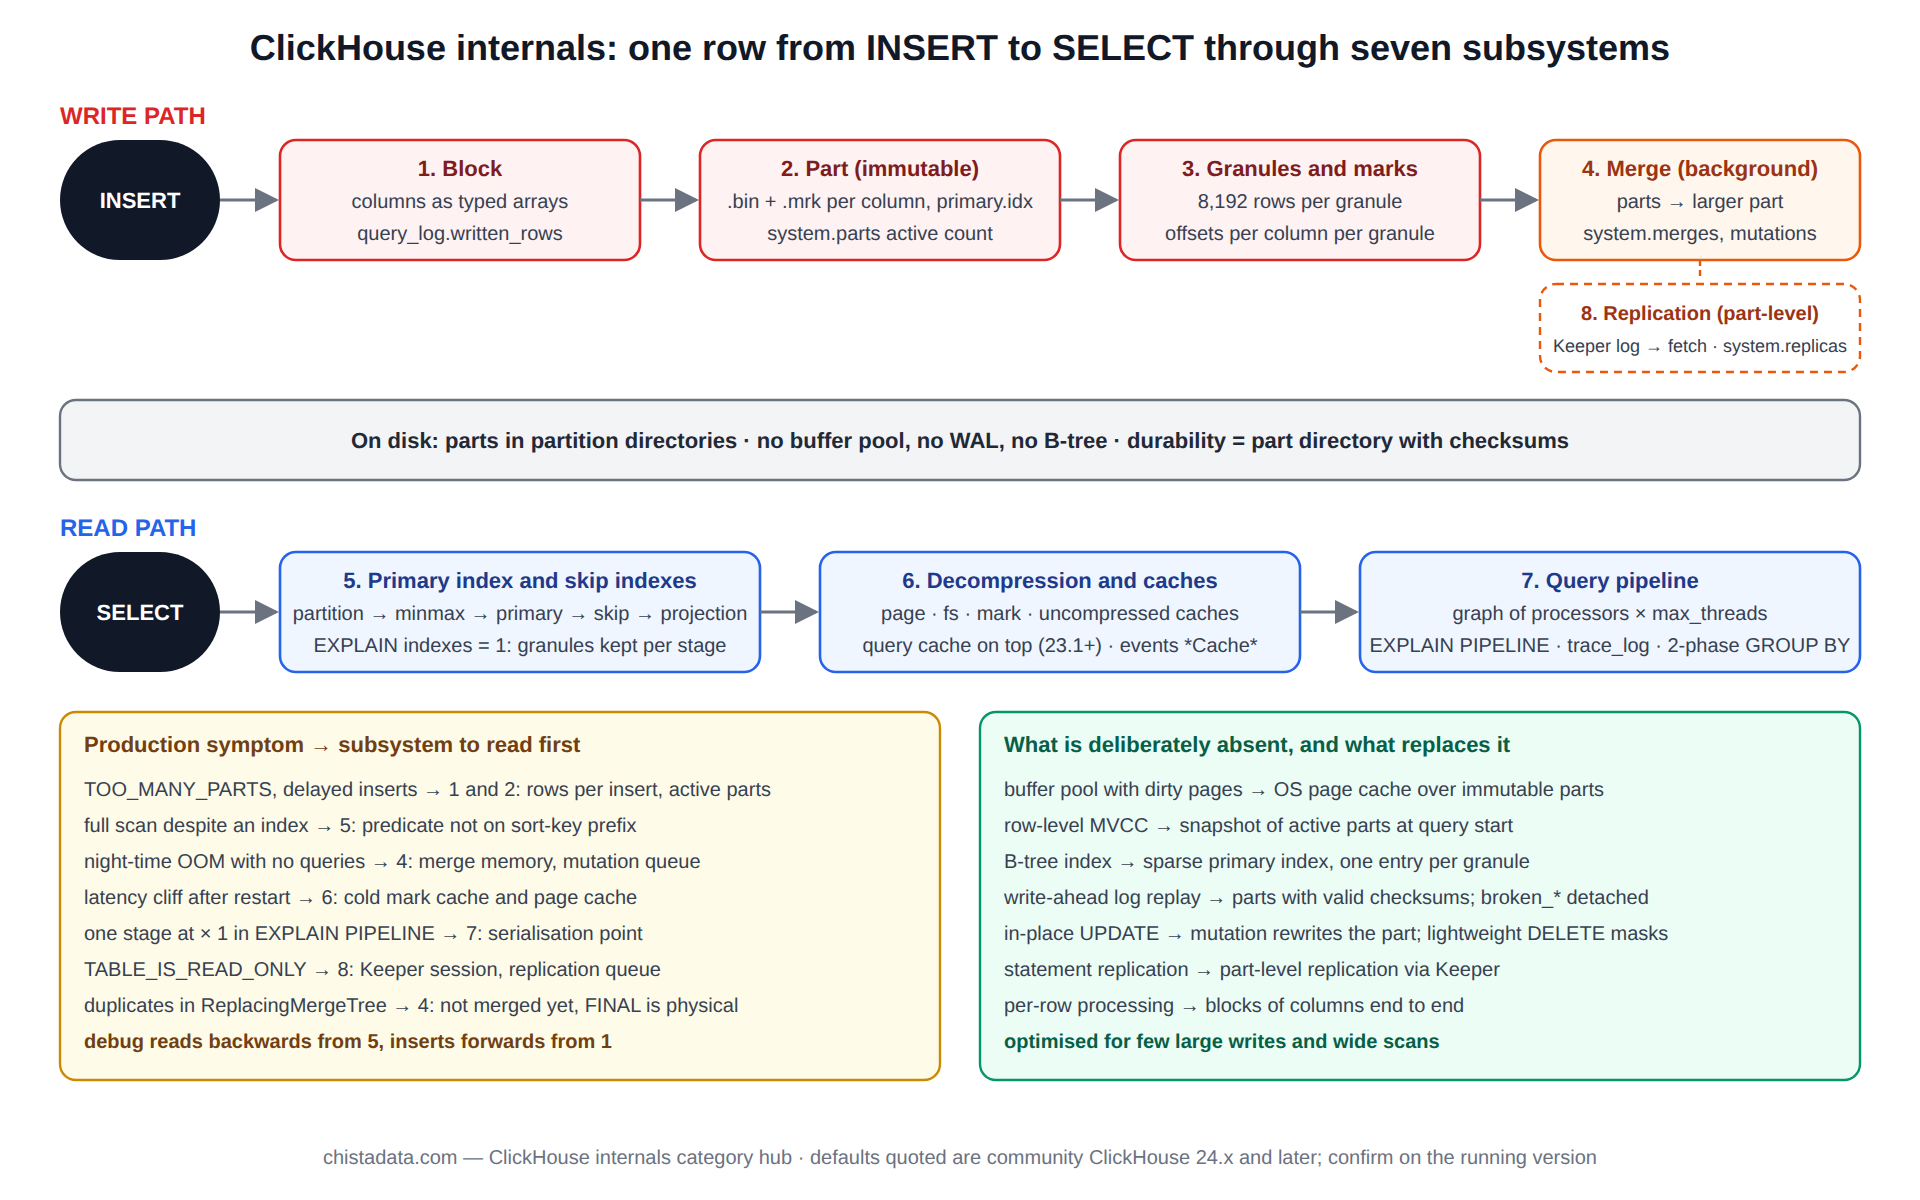
ClickHouse internals are easiest to learn by following one row from INSERT to SELECT and naming every subsystem it passes through. The row is parsed into a block, written as an immutable part, indexed by marks, merged in the background, found again through the primary index and skip indexes, decompressed through a cache hierarchy, and processed by a pipeline of parallel processors. Each of those seven stops has a system table that shows it working and a failure mode that shows up in production when it is misunderstood.
This page traces that path in order. The 180 posts in this category go deeper at every stop: MergeTree internals and query latency, partition pruning versus primary-key pruning, reading EXPLAIN PIPELINE, thread pool management, ReplacingMergeTree in practice, and the release-by-release performance settings notes. The trace below is the map that ties them together.
Stop 1: the block, and why ClickHouse internals start with columns not rows
An INSERT is parsed into a Block: a set of columns, each a contiguous typed array, with a row count. Nothing inside the server is ever a row; every operator, codec and network transfer works on blocks of columns. This is the first fact of ClickHouse internals and the one that explains most of the others. A 10,000-row insert with 30 columns is 30 arrays, not 10,000 tuples, and every subsequent stage keeps that shape.
The size of the block is governed by max_insert_block_size (default 1,048,449 rows) for inserts and max_block_size (default 65,409) for reads. Both matter for memory: a block is materialised in full, so a wide table with large String columns can hold hundreds of megabytes per block. The system table that exposes this is system.query_log, whose written_rows and written_bytes per INSERT reveal whether clients are batching or trickling.
SELECT
    count()                          AS inserts,
    avg(written_rows)                AS avg_rows_per_insert,
    quantile(0.5)(written_rows)      AS p50_rows,
    formatReadableSize(sum(written_bytes)) AS bytes
FROM system.query_log
WHERE type = 'QueryFinish'
  AND query_kind = 'Insert'
  AND event_time > now() - INTERVAL 1 HOUR;
-- avg under 10,000 rows per insert means part churn is coming
Clients that cannot batch on their own can hand the job to the server with async_insert = 1 (stable since 22.x). The server then buffers rows from many small inserts in memory and flushes one block when async_insert_max_data_size or async_insert_busy_timeout_ms is reached, so the part layer at stop 2 sees a few large writes instead of thousands of small ones. system.asynchronous_inserts shows the buffers in flight, and system.asynchronous_insert_log records every flush with its row count.
Stop 2: the part, the only unit ClickHouse ever writes
Every insert block becomes one part: a directory containing one file pair per column (.bin data and .mrk marks, or a single data.bin for compact parts), primary.idx, checksums.txt, columns.txt and a few metadata files. Parts are immutable. There is no in-place update anywhere in ClickHouse internals; a mutation writes a new part and drops the old one, and a merge writes a combined part and drops its inputs.
This is why there is no write-ahead log in the PostgreSQL sense. Durability is the part directory landing on disk with its checksums, and the archive posts on MergeTree internals and TTL scheduling work through what that means: the “log” is the sequence of parts, and the “checkpoint” is a merge. A crash between the block arriving and the part being renamed into place loses that insert, which is why insert_quorum exists on replicated tables and why clients retry on SOCKET_TIMEOUT.
system.parts is the catalog of this layer. Its active column separates live parts from ones awaiting deletion, and the count of active parts per partition is the single most important operational number in ClickHouse internals: too many and inserts are delayed (parts_to_delay_insert, default 1,000 since 24.x) then rejected (parts_to_throw_insert, default 3,000).
SELECT
    database,
    table,
    partition_id,
    count()                            AS active_parts,
    sum(rows)                          AS rows,
    formatReadableSize(sum(bytes_on_disk)) AS on_disk
FROM system.parts
WHERE active
GROUP BY database, table, partition_id
ORDER BY active_parts DESC
LIMIT 10;
Stop 3: granules and marks, the addressing scheme inside a part
Within a part, rows are grouped into granules of index_granularity rows (default 8,192) or index_granularity_bytes (default 10 MiB), whichever fills first. For every granule and every column, the .mrk file records the offset of the compressed block that contains the granule’s first row and the offset inside that block after decompression. The primary.idx file holds the sort-key values of the first row of each granule.
Reading in ClickHouse internals is therefore always a two-level lookup: the primary index decides which granules might match, and the marks translate granule numbers into byte offsets per column. A query that reads 3 of 50 columns opens 3 mark files and touches 3 data files, which is the mechanical reason column pruning is the largest optimisation available. EXPLAIN indexes = 1 shows the granule count before and after each index is applied.
EXPLAIN indexes = 1
SELECT count()
FROM events
WHERE tenant_id = 42
  AND ts >= toDateTime('2026-09-01 00:00:00');
-- ReadFromMergeTree (default.events)
--   Indexes:
--     MinMax     Parts: 12/48   Granules: 9800/61440
--     Partition  Parts: 12/48   Granules: 9800/61440
--     PrimaryKey Keys: tenant_id, ts   Parts: 4/12   Granules: 61/9800
The mark cache (mark_cache_size, default 5 GiB) keeps .mrk contents in memory. It should never be undersized, because a mark-cache miss turns a granule lookup into a disk read before any data is fetched. system.asynchronous_metrics reports MarkCacheBytes and MarkCacheFiles, and system.events reports MarkCacheMisses.
Stop 4: background merges, where ClickHouse internals spend most of their I/O
Parts are merged continuously by a pool of background threads (background_pool_size, default 16 since 22.x, with background_merges_mutations_concurrency_ratio multiplying it). The merge selector picks parts of similar size within a partition and writes one larger part, applying the engine’s logic on the way: nothing for plain MergeTree, deduplication for ReplacingMergeTree, aggregation for AggregatingMergeTree, row cancellation for CollapsingMergeTree. Merges are where FINAL semantics become physical, and they are the reason a ReplacingMergeTree shows duplicates until it has merged.
Merges also carry the memory that queries cannot see. A merge of two 50 GB parts holds column buffers, index buffers and codec state, and the sum across the pool is capped only by merges_mutations_memory_usage_soft_limit (default half of RAM). system.merges shows each running merge with progress, elapsed, memory_usage and is_mutation, and a merge that stays in the table for hours is either huge (check total_size_bytes_compressed) or starved by a mutation queue.
SELECT
    database,
    table,
    round(elapsed)                                   AS elapsed_s,
    round(progress * 100, 1)                         AS pct,
    num_parts,
    formatReadableSize(total_size_bytes_compressed)  AS input,
    formatReadableSize(memory_usage)                 AS mem,
    is_mutation
FROM system.merges
ORDER BY elapsed DESC;
Mutations (ALTER TABLE ... UPDATE/DELETE) ride the same machinery and rewrite entire parts, which is why they are slow and why lightweight deletes (DELETE FROM, stable since 23.x) write a mask instead and apply it on read until the next merge. system.mutations with is_done = 0 and a non-empty latest_fail_reason is the table to read when a schema change appears stuck.
Stop 5: the primary index and skip indexes, how a read finds its granules
The primary index is sparse: one entry per granule, not per row, so a table with a billion rows and default granularity has roughly 122,000 index entries and the whole index fits in a few megabytes of memory. It is loaded per part (lazily since 24.x with primary_key_lazy_load) and binary-searched for range predicates on a prefix of the sort key. Predicates on later sort-key columns without the earlier ones fall back to a generic exclusion search that reads more granules.
Skip indexes (minmax, set, bloom_filter, tokenbf_v1, ngrambf_v1, and the text index in 25.x and 26.x) add a second layer that records a summary per block of GRANULARITY granules, and can only exclude, never locate. The order of evaluation inside ClickHouse internals is partition pruning, then minmax on the partition key, then the primary index, then each skip index, then the projection selector if projections exist. The EXPLAIN indexes = 1 output above lists them in that order.
The archive post on partition pruning versus primary-key pruning is really a post about this stop: every rule (filter on the sort-key prefix, avoid functions on the key column, prefer IN over OR chains, keep PREWHERE on selective cheap columns) exists so that the primary index and skip indexes can do their work before the data files are opened.
Stop 6: decompression and the cache hierarchy
A granule that survives indexing is read as compressed blocks (default 64 KiB to 1 MiB uncompressed, max_compress_block_size) through a stack of caches: the OS page cache, the optional filesystem cache in front of object storage, and the optional uncompressed cache (use_uncompressed_cache). Decompression happens per column per block, with the column’s codec chain applied in reverse: a CODEC(DoubleDelta, ZSTD) column is ZSTD-decompressed then delta-decoded.
Above the storage caches sits the query cache (use_query_cache, since 23.1), which stores whole results keyed by query text and settings. The archive posts on reducing query memory usage and on the query cache explain the design decision that matters most: it is transactionally inconsistent by design, serving a stale result for query_cache_ttl seconds, so it belongs on dashboards and not on anything that reads its own writes. system.query_cache lists entries; QueryCacheHits and QueryCacheMisses in system.events measure it.
SELECT
    event,
    value
FROM system.events
WHERE event IN (
    'MarkCacheHits', 'MarkCacheMisses',
    'UncompressedCacheHits', 'UncompressedCacheMisses',
    'QueryCacheHits', 'QueryCacheMisses',
    'CompressedReadBufferBytes', 'ReadCompressedBytes'
)
ORDER BY event;
Stop 7: the query pipeline, ClickHouse internals as a graph of processors
The last stop is execution. Since the pipeline rewrite completed in 20.x, a query is a directed graph of processors, each pulling blocks from its inputs and pushing to its outputs, scheduled across max_threads worker threads. EXPLAIN PIPELINE prints the graph and the parallelism at each stage; the number after a processor name (for example MergeTreeSelect × 16) is the count of parallel instances, and a stage that narrows to × 1 before the end is a serialisation point worth understanding.
EXPLAIN PIPELINE
SELECT tenant_id, count()
FROM events
WHERE ts >= now() - INTERVAL 1 DAY
GROUP BY tenant_id;
-- (Expression)
-- ExpressionTransform × 16
--   (Aggregating)
--   Resize 16 → 16
--     AggregatingTransform × 16
--       (Expression)
--       ExpressionTransform × 16
--         (ReadFromMergeTree)
--         MergeTreeSelect(pool: ReadPool, algorithm: Thread) × 16
Aggregation is two-phase: each thread builds a partial hash table, and a final merge combines them, spilling to disk when max_bytes_before_external_group_by is set. Joins default to a hash join with the right table built in memory, which is why the right side should be the smaller one, and why join_algorithm = 'grace_hash' or 'partial_merge' exist for the cases where it is not. system.query_log records memory_usage and ProfileEvents per query, and system.trace_log with query_profiler_real_time_period_ns gives a sampled flame graph of where the pipeline spent its time.
Replication: the eighth stop that only replicated tables visit
On ReplicatedMergeTree the part written at stop 2 is also announced to ClickHouse Keeper (or ZooKeeper) as a log entry, and every other replica fetches it over the interserver HTTP port. Replication in ClickHouse internals is therefore part-level, not row-level or statement-level: a replica that falls behind has a queue of parts to fetch and merges to reproduce, visible in system.replication_queue, and system.replicas summarises it as queue_size, absolute_delay and is_readonly.
Two consequences follow. Merges are coordinated so that every replica ends up with byte-identical parts, which is why a replica may fetch a merged part rather than merge locally when prefer_fetch_merged_part_time_threshold is exceeded. And a lost Keeper session puts the table into read-only mode rather than risking divergence, which is the origin of most TABLE_IS_READ_ONLY incidents and the reason Keeper latency belongs on the same dashboard as insert latency.
SELECT
    database,
    table,
    is_readonly,
    is_session_expired,
    queue_size,
    inserts_in_queue,
    merges_in_queue,
    absolute_delay
FROM system.replicas
WHERE queue_size > 0 OR is_readonly OR is_session_expired
ORDER BY absolute_delay DESC;
ClickHouse internals in one table: subsystem, catalog, failure mode
| Subsystem | Where to observe it | Production failure it explains |
|---|---|---|
| Block | system.query_log written_rows | Small inserts → part churn |
| Part | system.parts active count | TOO_MANY_PARTS, delayed inserts |
| Granule and mark | EXPLAIN indexes = 1, MarkCache* | Full scans despite an index |
| Merge | system.merges, system.mutations | Night-time OOM, stuck ALTER |
| Primary and skip index | EXPLAIN indexes = 1 | Filter on wrong key column |
| Cache hierarchy | system.events *Cache* | Latency cliff after restart |
| Pipeline | EXPLAIN PIPELINE, trace_log | Single-threaded stage, hash-join OOM |
Where ClickHouse internals differ from a transactional engine
Engineers arriving from PostgreSQL or InnoDB tend to look for four things that ClickHouse internals do not have. There is no buffer pool with dirty pages; parts are written once and the OS page cache is the read buffer. There is no row-level MVCC; a query sees the set of active parts at the moment it starts, and a concurrent merge does not change that set for it.
There is no B-tree; the primary index is sparse and only prunes granules. And there is no write-ahead log to replay, so recovery is the set of parts with valid checksums, which is why system.detached_parts with broken_ prefixes appears after an unclean shutdown rather than a replay phase.
The archive posts comparing ClickHouse with PostgreSQL and MySQL for real-time analytics place these choices next to the transactional engines, and the practical difference is consistent: ClickHouse internals optimise for append-heavy, scan-heavy workloads with a small number of large writes, and every anti-pattern in the field (single-row inserts, frequent updates, point lookups by a non-key column) is a case of using it as the transactional engine it is not.
Version notes for ClickHouse internals
Compact parts (single data.bin) are the default for small parts since 20.x via min_bytes_for_wide_part. Lightweight deletes are stable since 23.3. The query cache arrived in 23.1. primary_key_lazy_load is 24.x. The text skip index is the 25.x and 26.x form of the earlier experimental inverted index. Default parts_to_delay_insert rose from 150 to 1,000 in 24.x. Confirm every one of these on the running version with SELECT version() and system.merge_tree_settings, because defaults move between releases and a hub page cannot track every minor.
Reading the archive
The trace is also the order in which to debug. A slow query is diagnosed from stop 5 backwards (did the indexes prune, did the marks hit cache, did the pipeline parallelise), and a slow insert from stop 1 forwards (is the block large enough, are parts accumulating, are merges keeping up). Working the stops in sequence avoids the common mistake of tuning the pipeline when the problem is a sort key.
Start with the MergeTree internals post for stops 2 to 4, the pruning post for stop 5, the query-memory post for stop 6, and the EXPLAIN PIPELINE and thread-pool posts for stop 7. The scaling, multi-tenant and release-notes posts in the archive are the operational context around all seven. The official MergeTree engine documentation is the reference for the storage-layer settings named on this page.
ChistaDATA’s ClickHouse consulting engagements begin with exactly this trace on the customer’s cluster, reading each system table in order to find which stop is the bottleneck, and 24×7 ClickHouse support keeps the same telemetry under watch afterwards. Reproduce any setting change from this page on staging with a production-sized sample first, and keep a tested restore before touching merge or memory settings on a running cluster.